

Abstract
Ovarian serous carcinomas (OSCs) comprise over half of all ovarian carcinomas and account for the majority of ovarian cancer-related deaths. We used a 2-dimensional liquid-based protein mapping strategy to characterize global protein expression patterns in 19 OSC tumor samples from 15 different patients to facilitate molecular classification of tumor stage. Protein expression profiles were produced, using pI-based separation in the first dimension and hydrophobicity-based separation in the second dimension, over a pH range of 4.0-7.0. Hierarchical clustering was applied to protein maps to indicate the tumor interrelationships. The 19 tumor samples could be classified into two different groups, one group associated with low stage (Stage 1) tumors and the other group associated with high stage (Stages 3/4) tumors. Proteins that were differentially expressed in different groups were selected for identification by LTQ-ESI-MS/MS. Fourteen of the selected proteins were over-expressed in the low stage tumors; 46 of the proteins were over-expressed in the high stage tumors. These proteins are known to play an important role in cellular functions such as glycolysis, protein biosynthesis, and cytoskeleton rearrangement and may serve as markers associated with different stages of OSCs. To further confirm the stage-dependent protein identifications, Lamin A/C and Vimentin expression in ovarian serous carcinomas was assessed by immunohistochemistry using ovarian tumor tissue microarrays for 66 samples.
Keywords: Mass Mapping, Ovarian Cancer, Tumor Stage, Cancer Markers, Tissue Microarrays, 2-D Liquid Separations
Introduction
Ovarian cancer remains the fifth leading cause of cancer deaths among women in the United States [1]. Five-year survival rates can be as high as 94% with early detection of the malignancy. However, as ovarian cancer is insidious in onset, less than 20% of ovarian tumors present at early stages of tumor development[2]. Currently, the only marker with utility for therapeutic monitoring of ovarian cancer is CA125. However, CA125 does not possess sufficient specificity and sensitivity to have utility for patient screening, (3, 4, 5). Thus, additional diagnostic and prognostic markers for ovarian cancer are urgently needed. Identification of novel ovarian cancer markers may lead to the development of improved monitoring of tumor progression and therapy.
Epithelial ovarian cancers (carcinomas) occur as several distinct morphological subtypes. [5-9]. For ovarian serous carcinomas, a substantial body of literature supports the notion that low grade and high grade OSCs represent distinctly different tumors. In particular, it is believed that the low grade OSCs likely arise from serous borderline tumors, while high grade OSCs likely arise de novo [10]. Low grade OSCs are typically more indolent than the high grade neoplasms [11, 12], [13], whereas clinically aggressive high-grade neoplasms spread rapidly and are usually associated with poor outcomes. Molecular studies of OSCs show very distinct genetic alterations between low and high grade neoplasms, with the low grade/well differentiated ones having frequent K-Ras and/or B-Raf mutations in approximately 65% of the tumors and rarely showing p53 mutations, while high grade OSCs show p53 mutations in 50-80% of the cases [14].
Though comprehensive studies of tumor RNA and DNA have provided a number of insights into ovarian cancer pathogenesis, proteins are the major effector molecules in tumor cells. Protein levels may be discordant with corresponding transcript levels and, importantly, a variety of post-translational modifications can have profound biological effects on protein function. To date, a number of proteomics-based studies have been conducted on ovarian tumors or on sera obtained from patients with ovarian tumors using several methods, including 2-D PAGE [15, 16] and 2-D liquid-based separation methodologies[17, 18]. The latter methodology not only has greater reproducibility, but also has the ability to identify and quantify proteins, and the capability to compare results amongst different sets of experiments and samples [19]. Histologic type-specific protein expression patterns in ovarian carcinomas have not been defined to date.
We have compared protein expression in low stage (Stage 1) versus high stage (Stages 3/4) ovarian serous adenocarcinomas (OSCs) to identify stage-dependent protein expression. All but one of the tumors were high grade (grade 2 or 3), thus the observed expression differences between high and low stage tumors was not attributable to differences in the distribution of tumor grade (degree of differentiation) between the two groups. We used a 2-dimensional liquid-based fractionation system to separate and map the protein expression of 19 OSCs from 15 different patients. We utilized hierarchical clustering analysis to explore tumor interrelationships based upon protein expression profiles. The tissues were classified into two groups, with one group consisting of low stage (Stage 1) tumors and another of high stage (Stages 3/4) tumors. Through the use of global protein expression profiling, a number of differentially expressed tumor-associated protein biomarkers with potential biological relevance in ovarian tumorigenesis or tumor progression were identified.
2. Materials and Methods
2.1. Samples and Preparation
2.1.1. Samples
Nineteen snap-frozen primary human OSC tissue samples obtained from 15 different patients were analyzed, including 15 from The University of Michigan Hospital (11 separate patients) and 4 from the Cooperative Human Tissue Network/Gynecologic Oncology Tissue Bank). Tumors were classified as well differentiated (grade 1), moderately differentiated (grade 2), or poorly differentiated (grade 3) using standard criteria [20, 21]. Tumor stage (1-4) was assigned according to FIGO criteria. Collection and analysis of human ovarian tumors was approved by the University of Michigan's Institutional Review Board (IRB). The OSCs were histologically analyzed by a Board-Certified Pathologist (K.R.C.) prior to utilization in this study. All tumor samples were obtained at the time of primary tumor debulking surgery (i.e., before chemotherapy). Therefore, there was no treatment prior to obtaining the samples.
2.1.2. Tissue lysis and buffer exchange
All OSCs were promptly frozen and stored at -80°C until analysis. Tissue samples were minced into small pieces on dry ice to prevent thawing and subsequently placed into 2-ml screw-cap micro-centrifuge vials (BioSpec Products, OK) containing approximately 2/3 vial volume of minute glass beads (BioSpec Products). The vials were subsequently filled with 1 ml lysis buffer (7.5 M urea, 2.5 M thiourea, 4% n-octyl-β-D-glucopyranoside (n-OG), 10 mM tris(2-carboxyethyl) phosphine (TCEP), 12.5% v/v glycerol, and 1% v/v protease inhibitor cocktail (Sigma, St. Louis, MO)). The tissue samples were homogenized for 3 min in a mini-bead beater cell disruptor, followed by centrifugation at 3000 × g for 10 min at room temp to pellet the bead mix. The supernatant containing tumor proteins were collected and stored on ice. In order to avoid incomplete tissue lysis and protein extraction, the vials were filled with 1 ml fresh lysis buffer and again homogenized for 2 min as above. These two lysis solutions were combined in 10 mL polycarbonate centrifuge tubes and the insoluble material was removed by ultracentrifugation at 86,000 × g at 4°C for 1h. The supernatant was collected and the buffer exchanged with the chromatofocusing start buffer using a PD-10 G-25 column (Amersham Biosciences, Piscataway, NJ). The proteins were quantified with the Bradford assay (Bio-Rad), and then the buffer-exchanged protein mixtures were stored in a -80°C freezer until further use.
2.2. Separation
2.2.1. Chromatofocusing
CF separation was performed on an HPCF-1D column (250 × 2.1 mm) (Beckman Coulter, Fullerton, CA) using the ProteomeLab™ PF2D protein fractionation system (Beckman Coulter), as described previously [22]. Two buffers were used to generate the pH gradient on the column. The SB solution was composed of 6M urea, 25mM Bis-Tris (pH 7.4). The EB solution was composed of 6M urea and 10% polybuffer74 (pH 4.0). Both buffer solutions were brought to pH by addition of a saturated solution of iminodiacetic acid. The CF column was pre-equilibrated with SB. After equilibration, 4.5 mg of proteins were loaded onto the CF column and the column was washed with 100% SB to remove material that did not bind to the column at pH 7.4. Elution is achieved by applying a pH 4.0 elution buffer at a flow rate of 0.2 mL/min. The pH gradient was monitored on-line by a flow-through pH probe (Beckman Coulter). The UV absorbance of the eluent was monitored on-line at 280nm. The flow rate was 0.2ml/min, with 16 fractions in total being collected in 0.2 pH units in the range of pH 7.0 - 4.0. Each fraction was stored at -80°C until use.
2.2.2. NPS-RP-HPLC with sample collection
When the first-dimension separation was completed, the pI fractions collected from the first dimension were separated by nonporous silica reverse phase HPLC (NPS-RP-HPLC) using a HPCF-2D (4.6 × 33 mm) NPS column (Beckman Coulter) and detected by absorbance at 214 nm using a Beckman model 166 UV absorption detector. The RP separation was performed at 0.75 mL/min and monitored at 214 nm using a Beckman 166 Model UV detector (Beckman-Coulter). Proteins eluting from the column were collected by an automated fraction collector (Model SC 100, Beckman), controlled by an in-house designed DOS-based software program. To enhance the speed, resolution, and reproducibility of the separation, the RP column was heated to 65°C by a column heater (Jones Chromatography, Model 7971, Resolution Systems, Holland, MI). Both mobile phase A: MilliQ® water (Millipore, Billerica, MA), and solvent B: acetonitrile (ACN) (Sigma) contains 0.1% v/v trifluoroacetic acid (TFA). The gradient was run from 15 to 25% B in 1 min, 25 to 35% in 6 min, 35 to 38% in 4 min, 38 to 45% in 6 min, 45 to 65% in 2 min, 65 to 67% in 6 min, and finally up to 100% in 1 min, then back to 5% in 1 min. After the gradient, the column was washed by two fast gradients from 5% B to 100% B in 5 min, 100% B back to 5% B in 1 min. Fractions from the HPLC eluent were collected using a semi-automated in-house program using a Model SC-100 fraction collector. Collected peak fractions were stored at -80°C for further use.
2.3. Protein Identification
2.3.1. Trypsin Digestion of Nonporous Reversed-Phase HPLC Fractions
Second dimension fractions of interest (obtained from NPS-RP-HPLC) were concentrated to 20 μL with a SpeedVac concentrator (Labconco, Kansas City, MO) operating at 45°C. Twenty microliters of 200 mM ammonium bicarbonate (Sigma) and 2 μL of 100 mM dithiothreitol (DTT) (Sigma) were mixed with each concentrated sample to obtain a pH value of approximately 8.0. 0.5μL of L-1-tosylamido-2-phenylethyl chloromethylketone (TPCK) modified sequencing-grade porcine trypsin (Promega, Madison, WI) was vortexed prior to an overnight incubation at 37°C, with agitation. Following incubation, 1 μl TFA was added to each tube to halt digestion.
2.3.2. LC-MS/MS
The trypsin-digested samples were separated by a capillary RP column (C18, 0.3 × 150mm) (Michrom Biosciences, Auburn, CA) on a Paradigm MG4 micropump (Michrom Biosciences) with a flow rate of 0.3 μL/min. The gradient, started at 5% ACN, was ramped to 60% ACN in 25 min and finally ramped to 95% in another 5 min. Both solvents A (water) and B (ACN) contain 0.3% formic acid. The resolved peptides were analyzed on a Finnigan LTQ mass spectrometer (Thermo Electron Corp., San Jose, CA) with an ESI ion source (Thermo). The capillary temperature was set at 175°C, spray voltage was 2.8 kV, and capillary voltage was 30 V. The normalized collision energy was set at 35% for MS/MS. MS/MS spectra were searched using the SEQUEST algorithm, Version 27, incorporated in Bioworks software Rev. 3.1 SR1(Thermo) against the Swiss-Prot human protein database release version 51.0 which contains 241,242 sequence entries and comprises 88,541,632 amino acids abstracted from 158,294 references. The search was performed using the following parameters: (1) database species, Homo sapiens; (2) allowing one missed cleavage; (3) possible modifications, none; (4) peptide ion mass tolerance 1.50 Da; (5) fragment ion mass tolerance 0.0 Da; (6) mass tolerance for precursor ions 1.40 Da; (7) peptide charges +1, +2, and +3. The filter function in Bioworks browser was used for protein identification. The single threshold was considered with Xcorr of greater than or equal to 3.5 for triply charged ions, 2.5 for doubly charged ions, and 1.9 for singly charged ions, while no ions at higher charged states were considered. The search results that passed these criteria were subjected to manual inspection using ΔCn. ΔCn represents the difference in cross-correlation score (Xcorr) between the top two candidates for a given input data file where the value must be between 0 and 1.0. In this work a value of ΔCn ≥ 0.1 was considered. If multiple members of a protein family were identified, stringent criteria were used for selection as follows: (1) ranked preliminary score (Rsp) <5; (2) at least 2 peptides matching; (3) if the same spectrum matched different proteins, the lower Rsp and the higher ΔCn would be selected. Positive protein identification was validated by the Trans-Proteomics Pipeline. This software includes both the PeptideProphet and ProteinProphet programs developed by Keller et al(23). The probabilities of all the selected peptides are higher than 0.95(see Supplementary Table). The probability of most selected proteins is 1 and all the proteins reported have a probability higher than 0.90.
2.4. Software
The data from the 2-D liquid separations were displayed using the Mapping Tools Software Suite from Beckman-Coulter. The chromatographic UV data resulting from the NPS-RP-HPLC second-dimension separation of each pI fraction were analyzed by the ProteomeLab software to produce peak information (peak retention time, peak height, peak area). The Mapping Tools Software Suite imports the raw chromatogram intensity vs. retention time data and those processed peaks for each pI range in a data set. The multiple data sets (one for each pI range as a “lane”) were displayed as a two dimensional image based upon retention time versus pI range axis (termed a ProteoVue map). Each raw chromatogram intensity and/or processed peak data value is shown proportional to color intensity or color value at its corresponding retention time and pI range location.
Two such complete data sets or maps were compared. Corresponding peaks in similar pI ranges were selected for comparison. A DeltaVue difference map was prepared from the paired peaks. A single pI range can be compared across many data sets by creating a lane-band pattern image map. One data set was defined as the Reference data set and the peaks in the Reference lane were paired with peaks in each of the individual Comparison data set's lane. A MultiVue map was prepared for these paired peaks to allow comparison of many data sets at a specific pI value.
2.5. Data analysis and clustering
Data Standardization and Alignment
The raw UV data for each sample were standardized to remove differences in the level and slope of the baseline. After standardization, the UV data for each pair of samples were aligned in order to maximize the local correlation coefficients between the aligned samples. The method used for the standardization and alignment was identical to that utilized previously [22].
Comparisons
To compare the overall pattern of protein expression in the samples, each pair was aligned separately, and then a correlation matrix was formed by calculating the Pearson correlation coefficient between each aligned pair of samples. These correlation matrices were then visualized using a hierarchical clustering technique, thus producing a dendrogram in which pairs of points with greater correlation are linked sooner. Complete linkage clustering analysis was used to define the dendrograms.
Ovarian tumor tissue microarrays and immunohistochemistry
Two ovarian tumor tissue microarrays were constructed as described [24], with the tissues randomly selected from the University of Michigan Pathology archives. These two tissue microarrays (combined) contained triplicates of ovarian tumor samples, including 5 clear cell carcinomas, 26 ovarian papillary serous carcinomas, 6 ovarian endometrioid carcinomas, 15 metastatic ovarian carcinomas, 8 mixed ovarian serous/endometrioid carcinomas, 4 ovarian serous/clear cell carcinomas, 1 papillary serous cystadenocarcinoma and 1 mixed anaplastic/endometrioid carcinoma. Immunohistochemistry for Lamin A/C was performed using a mouse monoclonal antibody (clone JOL2, Chemicon) at 1:50 dilution; immunohistochemistry for Vimentin was performed using a mouse monoclonal antibody (Clone V9, Dako, pre-diluted). Anti-Lamin A/C and anti-Vimentin primary antibodies were hybridized to both tissue microarrays for 30 min at RT using citrate buffer (pH 6.0) and microwave antigen retrieval (10 min) and the Dako automated instrument (Dako Cytomation, Carpinteria, CA). Detection of the primary antibody was performed using the Dako Envision kit.
Results and Discussion
Analysis of ovarian serous carcinoma samples
Nineteen OSC tumor samples were used for proteomic analysis. Available clinico-pathological data associated with tumor specimens is provided in Table 1. Notably, all but one of the tumors were high grade (grade 2 or 3), so that expression differences between high and low stage tumors was not attributable to differences in the distribution of tumor grade (degree of differentiation) between the two groups. 2-D liquid-based mapping methodology was developed and applied to profile global protein expression of both low stage (Stage 1) and high stage (Stage 3/4) OSCs. A hierarchical clustering technique was applied to classify the samples which were followed by the identification of differentially expressed proteins of different groups based on the classification.
Table 1.
Serous ovarian carcinoma tumors utilized for proteomic analysis of ovarian cancer proteins
| Tumor ID | Stage | Grade | Age |
|---|---|---|---|
| UM-OS-001T | 3 | 2 | 70 |
| UM-OS-002T | 3c | 2-3 | 40 |
| UM-OS-003T | 4 | 3 | 56 |
| UM-OS-007T | 3c | 3 | 54 |
| UM-OS-007Tb | 3c | 3 | 54 |
| UM-OS-014 (met 1) | 3c | 3 | 54 |
| UM-OS-014 (met 2) | 3c | 3 | 54 |
| UM-OS-015T | 4 | 3 | 49 |
| UM-OS-016T | 3c | 1 | 30 |
| UM-OS-017Tb | 3c | 2-3 | 81 |
| UM-OS-019T | 3 | 3 | 44 |
| UM-OS-020T | 3 | 3 | 65 |
| UM-OS-021-1T | 1a | 3 | 68 |
| UM-OS-021-2T | 1a | 3 | 68 |
| UM-OS-021-3T | 1a | 3 | 68 |
| CHTN-OS-004 | 1a | 2 | 47 |
| CHTN-OS-041 | 1c | 3 | 61 |
| CHTN-OS-050 | 1a | 2 | 80 |
| CHTN-OS-098 | 1a | 2 | 59 |
Proteome analysis
In this study, the global protein expression profiles for 19 OSC tissue samples (7 Stage 1 (from 5 individuals) and 12 Stage 3/4 (from 10 individuals)) were generated using the 2-D liquid mapping methodology to assess protein expression differences between both low and high stage OSCs. Maps were produced using protein pI as the separation parameter in the first dimension and hydrophobicity, based upon reverse phase (RP)-HPLC separation, in the second dimension. Protein detection in the first dimension was performed using UV absorption at 280 nm, with UV absorption at 214 nm in the second dimension. Equal amounts of protein were loaded for each sample in order to generate the 2-D UV maps. As shown (Figure 1), 4.5 mg of tumor proteins were loaded onto the first dimension chromatofocusing column. In this figure, each lane corresponds to a different pI value, and the bands correspond to the hydrophobicity as generated by the percentage of acetonitrile on the HPLC gradient at that pI. Each map consists of a total of 15 pI fractions, corresponding to a pH range of 4.0-7.0. Each of the fractions obtained after chromatofocusing contained as many as 60-100 proteins, which were further resolved by RP-HPLC. Thus, it is estimated that each sample was fractionated into around 1000 to 1500 software-visualized protein bands using the 2-D liquid mapping method. While the numbers of bands visualized were similar in number to what is reasonably expected in 2D-PAGE, approximately 25-fold more protein is loaded in the liquid mapping methodology, and all fractions are maintained in liquid phase, thus facilitating mass spectrometric analysis.
Figure 1.
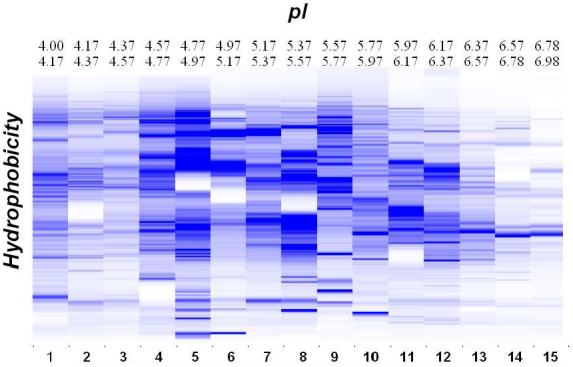
OSC sample UM-OS-007 was separated using chromatofocusing over a pH range of 4.0-7.0, in 0.2 pH intervals, followed by separation in the second dimension using NPS RP-HPLC. The x-axis is pI of the chromatofocusing and the y-axis is hydrophobicity of the RP-HPLC. The scale of the bands represents the relative intensity of each band by UV detection at 214nm.
The chromatographic UV data resulting from the nonporous silica RP-HPLC second dimension separation of each pI fraction were displayed using ProteoVue software and analyzed to obtain peak information. The processed peaks were displayed in a 2-D “lane and band” format resulting in a highly detailed pI versus hydrophobicity protein expression map, using a color-coded format where color hue or its intensity is proportional to the relative quantitative UV peak volume of each peak, thus facilitating viewing of relationships or patterns within the complex chromatographic data set.
Reproducibility studies
The reproducibility of the analysis technique was studied. Figure 2A represents the first dimension chromatofocusing profile for sample UM-OS-21-1, UM-OS-21-2 and UM-OS-21-3. Sample UM-OS-21-1 and UM-OS-21-2 are different protein lysates from the same tumor that were utilized for analysis of tumor heterogeneity. Sample UM-OS-21-3 is the same sample as UM-OS-21-1, and was run twice for the first dimension chromatofocusing to explore experimental reproducibility. The second dimension hydrophobicity profiles for all pI fractions are shown in Fig. 2B. These results indicate good reproducibility between the chromatograms of the band patterns and retention times in both the first dimension chromatofocusing separation and the second dimension reverse phase liquid separation. Such reproducibility was observed in all the pI lanes separated for all three samples (data not shown).
Figure 2.
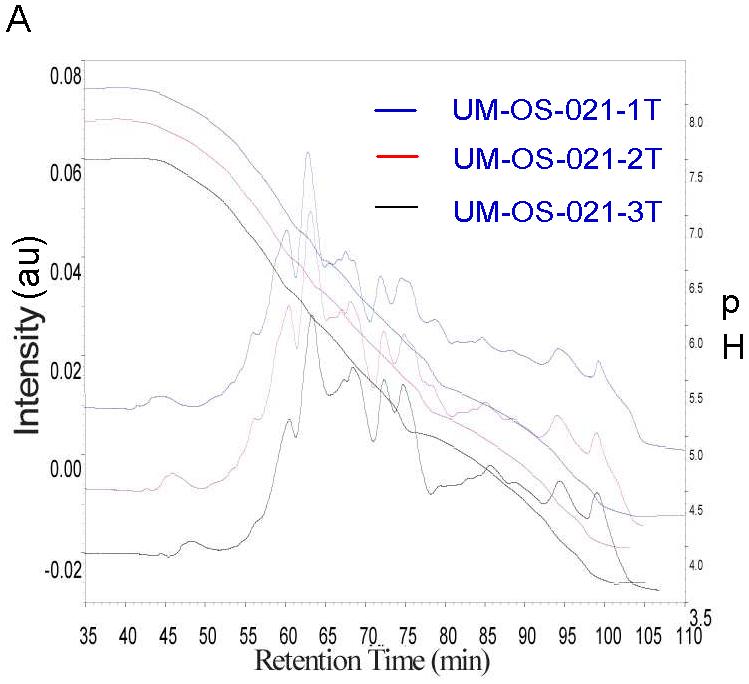

A. Analysis of technical reproducibility. Displayed is the first dimension chromatofocusing profile for sample UM-OS-21-1, UM-OS-21-2 and UM-OS-21-3 where the right y-axis units are in pH. The total amount of each sample that was run was 4.5mg, and the protein content of the samples was detected by UV absorption at 280nm where intensity is measured on the left -axis. B. 2nd dimension separation was run continuously by NPS RP-HPLC for each CF separation. UV maps are shown. UV absorption is at 214nm.
Hierarchical Clustering
Complete linkage cluster analysis was performed following standardization and alignment. All pI fractions, from pH 4.0-7.0, were analyzed by this method. Total results were obtained by the average of all the fractions, and are shown in Figure 3.
Figure 3.

Tumor samples were aligned separately and then grouped, using complete linkage hierarchical clustering analysis. A. Dendrogram of samples showing overall similarity in protein expression profiles across the samples. B. Clustering of pI fraction 4.4-4.6 from all tumor samples. C. Clustering of pI fraction 6.0-6.2 from all tumor samples.
In the dendrograms in Figure 3, the length and the subdivision of the branches display the relatedness of the tissue samples and the expression of the proteins. The dendrogram illustrated in Figure 3A shows a major division in the distribution of different OSC tissue samples based upon respective protein expression using all protein fractions generated during the 2-D liquid mapping. In the rightmost major node (black dots), seven stage 1 OSC samples clustered together, with the three independent replicate OSC samples (UM-OS-021(1-3)) from the same patient clustering on the same node. In the leftmost major node, the twelve stage 3/4 OSC tumor samples clustered together. Two independent sets of replicate tumor samples (UM-OS-7T/UM-OS-7Tb and UM-OS-014T (met 1 and met 2)) were found to cluster tightly together with the corresponding replicate OSC sample. However, upon analysis of individual fractions, differences in clustering patterns were noted. Although all of the replicate OSC samples clustered tightly with the corresponding replicate sample from the same patient, thus indicating good reproducibility of the methodology, the difference between different stages was very apparent in the low pH fractions. Figure 3B represents the pH fraction from 4.4-4.6, with all the low stage tumors being grouped together, apart from the high stage tumors. The low and high stage tumors did not completely segregate in the pH fraction from 6.0-6.2 based on their protein expression profiles (Figure 3C). Within this pH range, the expression profiles of five low stage OSCs were clustered with one high stage tumor (UM-OS-017Tb). All other high stage tumors clustered with two low stage tumors (CHTN-OS-041 and CHTN-OS-050). Thus, whereas protein profiling of all fractions simultaneously provided good segregation of high and low stage OSCs, protein profiling of individual fractions indicated that some low and high stage OSCs may have a similar protein expression profile.
Stage-dependent Candidate Protein Markers of Ovarian Serous Carcinoma
We next sought to identify proteins whose expression pattern could serve as potential stage-dependent markers of OSC. In these comparisons between different stage samples, only peak areas that demonstrated at least 2-fold changes in quantitative protein expression were selected, and analyzed further by mass spectrometry. To individually identify the proteins in each peak, the proteins were identified using LTQ analysis, with the data shown in Figure 4. The differentially expressed proteins that were identified are shown in Figure 4. Each cell in the matrix represents the expression level of a single protein in a single sample, with red or orange indicating intensity above the mean and blue or dark blue indicating intensity below the mean for that protein across all samples within that group.
Figure 4.

Differentially expressed proteins in Stage 1 versus Stage 3/4 OSC tumors. The rows represent data for individual proteins. Each column represents data for individual samples. Each cell in the matrix represents the expression level of a single protein in a single sample, with red or orange and blue or dark blue indicating intensity above and below the mean for that protein across all samples. Red indicates the ratio is above 4, orange indicates the ratio is above 2, light blue indicates the ratio is less than 0.5 and dark blue means less than 0.25. Gray squares means the data were not available. Absent values indicates a value close to zero and were omitted from the table.
For protein identification, after database searching, most of the protein peaks that were detected provided only a single confident ID. However, for 10 peaks, we found that more than one protein was confidently identified. In these cases, a spectral counting-based quantitation method [25] was used. Using this method, we split the protein expression levels that were obtained from mapping tools between the identified proteins, based on the ratio of their quantitation. We also performed off-line ESI mass spectrometry on the LCT for sample UM-OS-007 fraction 4.6-4.4, with a peak retention time of 11 min to confirm the spectral counting-based quantitation method. As shown in Figure 5A, the proteins contained in this fraction were identified as Tumor Protein D54 and astrocytic phosphoprotein PEA-15. After spectrum deconvolution in Figure 5D, we observed that the intensity of Tumor Protein D54 was 1.71 × 10² and for astrocytic phosphoprotein PEA-15 the intensity was 1.42 × 10². For the spectral counting-based quantitation method, the numbers were 1189 and 1166, respectively. Thus, the total expression levels were split for these two proteins based on the protein-protein ratio of 1.20.
Figure 5.


A. Protein expression maps for a given pH fraction of all tumors analyzed for Tumor Protein D54. B. Protein expression levels for Tumor Protein D54 among all tumors analyzed. C. LTQ analysis of several peptides identified as Tumor Protein D54. D. LCT data after spectrum deconvolution showing the molecular weight of two proteins, including Tumor Protein D54.
A subset of differentially expressed proteins was further evaluated as possible candidate biomarkers to distinguish between different stages in OSC samples. We focused on several proteins previously associated with cancer that displayed the largest-fold change. The image in Figure 5A is displayed in a format with each different sample on the x-axis and hydrophobicity on the y-axis. The relative intensities of the peak are quantitatively proportional to the amount of corresponding protein detected by UV absorption. The leftmost six columns are samples from low stage tumors, while the rightmost twelve columns are samples from high stage tumors. The band circled in the picture shows high expression in the high stage tumors, but almost no expression in low stage tumors, and has been identified as containing both astrocytic phosphoprotein PEA-15 and Tumor Protein D54. Tumor Protein D54 belongs to the TPD52 family, which consists of four members, TPD52 or D52, TPD52L1 or D53, and TPD52L2 or D54. The Tumor Protein D52 (TPD52) gene was originally identified as being over-expressed in human breast carcinomas specifically within the neoplastic cells and was subsequently shown to encode a tumor-associated antigen in breast carcinoma through SEREX screening[26]. Tumor Protein D52 is known to be over-expressed in breast, prostate and ovarian carcinomas [27-30]. Byrne et al [26] demonstrated that normal ovarian epithelium samples were predominantly TPD52-negative, whereas TPD52 was over-expressed in most (44/57; 77%) ovarian carcinomas regardless of histological subtype. The encoded proteins are likely to function as adaptor proteins and to interact with D52-like proteins and several other intracellular partner proteins [31]. We have shown that Tumor Protein D54 is over-expressed in high stage OSC tumors, as compared to low stage tumors (Figure 5B). Figure 5C shows the tandem mass spectra of Tumor Protein D54-specific peptides. Figure 5D shows the LCT data after spectrum deconvolution indicating the molecular weight of two proteins, including Tumor Protein D54.
Vimentin, an intermediate filament protein, was significantly over-expressed in the high stage tumors as compared with the low stage tumors in our study (Figure 6A, 6B). It is expressed in many hormone-independent mammary carcinoma cell lines. Vimentin is found in various cell types, especially mesenchymal cells. As we have found them to be significantly over-expressed in the high stage carcinomas, it is possible that the high stage tumors were undergoing epithelial to mesenchymal transition. Previous reports have also demonstrated the increase of vimentin in the hyperplastic tissue compared to adjacent normal human prostatic epithelium (32). Figure 6A shows vimentin expression (as indicated by UV absorption) and Figure 6B indicates protein expression levels for each of the individual tumors, sorted by stage. Figure 6C shows the tandem mass spectra of vimentin-specific peptides.
Figure 6.

A. Protein expression maps for a given pH fraction of all tumors analyzed for Vimentin. B. Protein expression levels for Vimentin among all tumors analyzed. C. LTQ analysis of several peptides identified as Vimentin.
Histone proteins were also found to be differentially expressed amongst low and high stage OSCs. Histone proteins are core components of the nucleosome which wrap and compact DNA into chromatin, limiting DNA accessibility to the cellular machineries which require DNA as a template. Histones thereby play a central role in transcription regulation, DNA repair, DNA replication and chromosomal stability. Nucleosome remodeling is regulated via a complex set of post-translational modifications of histones. Acetylation of the lysine residues at the N-terminus of histone proteins removes positive charges, thus reducing the affinity between histones and DNA, and allowing for RNA polymerase and transcription factors to access the promoter region. Thus, histone acetylation enhances transcription while histone deacetylation represses transcription. We have found many histone proteins over-expressed in the high stage tumors relative to low-stage tumors. Typically, histones have a very basic pI, usually above 11. As we have found them with pI's of less than 7, this suggests that these proteins may be heavily acetylated in the high stage tumors, thus shifting the pI of those proteins into our detection range, and which may suggest enhanced transcription in the high stage tumors. Figure 7 shows the tandem mass spectra of a histone peptide with a two acetylation modification.
Figure 7.

A Histone peptide with a two acetylation modification.
Immunohistochemical analysis of Lamin A/C and Vimentin
To further confirm the stage-dependent protein identifications, Lamin A/C and Vimentin expression in ovarian serous carcinomas was assessed by immunohistochemistry (Fig. 8), using mouse monoclonal anti-Lamin A/C and anti-Vimentin antibodies and the ovarian tumor tissue microarrays. Nuclear membrane immunoreactivity for Lamin A/C was documented (Fig. 8A, B) in the majority of the ovarian serous tumors. There were increased levels of immunoreactivity observed in the higher stage tumors, in concordance with the findings from the protein mapping experiments. Whereas only stromal and vascular bed vimentin immunoreactivity was documented in low stage ovarian serous tumors, the high stage tumors exhibited intense levels of immunoreactivity (Fig. 8C, D). These findings are concordant with the findings from the protein mapping experiments. It is interesting to speculate that the high stage ovarian serous carcinomas were undergoing epithelial-to-mesenchymal transition, with concomitant increased expression of vimentin, a marker of mesenchymal cells.
Figure 8.

Immunohistochemical staining of Lamin A/C and Vimentin. Both low stage (stage 1; A) and high stage (stage 3; B) ovarian serous carcinomas stained for Lamin A/C immunoreactivity are shown, demonstrating predominantly nuclear membrane immunoreactivity in the neoplastic cells, with higher immunoreactivity in the high stage tumor. Both low stage (stage 1; C) and high stage (stage 3; D) ovarian serous carcinomas stained for Vimentin immunoreactivity are shown, demonstrating stromal and vascular bed immunoreactivity in the low stage tumor (C), with neoplastic cells showing intense immunoreactivity in the high stage tumor (D).
Function of differentially expressed proteins
A biological process clustering of differentially expressed proteins in low- versus high stage OSCs was created to analyze the distribution of important cellular regulatory functions. Based on a deregulation ratio threshold of +/- 2, we found 46 proteins over-expressed in the high stage OSCs (Figure 8B) and 14 under-expressed proteins (Figure 8A), with respect to the low stage tumors. Rather than being evenly distributed in all protein function categories, the over- and under-expressed proteins were clustered within specific biological processes. The percentage of identified proteins in each assigned molecular function was calculated based on the number of assigned proteins over the total proteins. For the proteins that were over-expressed in the high stage tumors, 28% of identified proteins are involved in cytoskeletal organization, 19% are involved in transcription/translation, and 13%, 13%, 6%, 4% and 2% (respectively) are involved in cellular metabolism, response to stress, antioxidant, signal transduction or are mitochondria-related. 15% of the identified proteins have been classified as other (or unknown) function. For the under-expressed proteins, 0%, 7%, 33%, 7%, 0%, 20% and 20% (respectively) are involved in cytoskeletal organization, transcription/translation, cellular metabolism, response to stress, antioxidant, signal transduction or mitochondria-related. Proteins with other (or unknown) function are 13%. Notably, proteins involved in cytoskeleton organization or antioxidant pathways were found to be over-expressed in the high stage tumors relative to their proportion in the differentially expressed protein population. Interestingly, the mitochondria-related proteins that we have identified are clearly under-expressed in the high stage tumors, consistent with the study of Cuezva et al [33] who showed that liver carcinogenesis involves a depletion of the cellular mitochondrial content, as revealed by reduced content of mitochondrial markers.
Finally, of interest, the low stage OSC samples showed more protein in the acidic fractions and less protein in the basic fractions, as compared to high stage OSC samples. This phenomenon may result not only from changes in gene/protein expression, but also from alterations in the levels and types of post-translational modifications of expressed proteins (i.e., changes in acetylation and glycosylation, etc.), changes that are more difficult to ascertain on an individual basis, but can be observed globally by protein profiling. Thus, progress to define markers for diagnosis of low stage OSC may be facilitated by the establishment of protein profiles rather than by analysis of uniquely-expressed proteins.
Conclusion
In conclusion, we utilized 2-D liquid mapping and hierarchical clustering analysis of 19 OSC tissue samples (seven Stage 1 (from 5 individuals) and twelve Stages 3/4 (from 10 individuals). Replicate samples obtained from the same tumor demonstrated good reproducibility in our analyses. Further, we have demonstrated that the tumors could be classified in two groups, with one group associated with low stage OSCs and the others associated with high stage tumors. Notably, all but one of the tumors were high grade (grade 2 or 3), so that expression differences between high and low stage tumors was not attributable to differences in the distribution of tumor grade (degree of differentiation) between the two groups. With differential expression maps, 60 proteins were classified as over-expressed or under-expressed between the low and high stage OSCs. Further analysis of the differentially expressed proteins may facilitate identification of candidate prognostic markers in ovarian cancer.
Supplementary Material
Figure 9.

Distribution of identified proteins which are differentially expressed between low stage (stage 1) and high stage (stage 3/4) tumors. A. Over-expressed proteins in the high stage tumors B. Under-expressed proteins in the high stage tumors.
Acknowledgment
This work was supported in part by the National Cancer Institute under grant R01CA100104 (DML, KRC) and the National Institutes of Health under grant R01GM49500(DML). Eprogen, Inc. also generously provided support.
Synopsis
We have used a 2-dimensional liquid-based protein mapping strategy to characterize global protein expression patterns in 19 OSC tumor samples from 15 different patients to facilitate molecular classification of tumor stage. Protein expression profiles were produced, using pI-based separation in the first dimension and hydrophobicity-based separation in the second dimension, over a pH range of 4.0-7.0. Hierarchical clustering was applied to protein maps to indicate the tumor interrelationships. The 19 tumor samples could be classified into two different groups, one group associated with low stage (Stage 1) tumors and the other group associated with high stage (Stages 3/4) tumors. Proteins that were differentially expressed in different groups were selected for identification by LTQ-ESI-MS/MS. Fourteen of the selected proteins were over-expressed in the low stage tumors; 46 of the proteins were over-expressed in the high stage tumors. These proteins are known to play an important role in cellular functions such as glycolysis, protein biosynthesis, and cytoskeleton rearrangement and may serve as markers associated with different stages of OSCs. To further confirm the stage-dependent protein identifications, Lamin A/C and Vimentin expression in ovarian serous carcinomas was assessed by immunohistochemistry using ovarian tumor tissue microarrays for 66 samples.

References
- 1.Bonome T, Lee JY, Park DC, Radonovich M, Pise-Masison C, Brady J, Gardner GJ, Hao K, Wong WH, Barrett JC, Lu KH, Sood AK, Gershenson DM, Mok SC, Birrer MJ. Cancer Research. 2005;65:10602–10612. doi: 10.1158/0008-5472.CAN-05-2240. [DOI] [PubMed] [Google Scholar]
- 2.Jemal A, Siegel R, Ward E, Murray T, Xu JQ, Smigal C, Thun MJ. Ca-a Cancer Journal for Clinicians. 2006;56:106–130. doi: 10.3322/canjclin.56.2.106. [DOI] [PubMed] [Google Scholar]
- 3.Eltabbakh GH, Yadev PR, Morgan A. Gynecologic Oncology. 1999;75:476–479. doi: 10.1006/gyno.1999.5621. [DOI] [PubMed] [Google Scholar]
- 4.Nagele F, Petru E, Medl M, Kainz C, Graf AH, Sevelda P. Obstetrics and Gynecology. 1995;86:259–264. doi: 10.1016/0029-7844(95)00126-c. [DOI] [PubMed] [Google Scholar]
- 5.Schwartz DR, Wu R, Kardia SLR, Levin AM, Huang CC, Shedden KA, Kuick R, Misek DE, Hanash SM, Taylor JMG, Reed H, Hendrix N, Zhai Y, Fearon ER, Cho KR. Cancer Research. 2003;63:2913–2922. [PubMed] [Google Scholar]
- 6.Schaner ME, Ross DT, Ciaravino G, Sorlie T, Troyanskaya O, Diehn M, Wang YC, Duran GE, Sikic TL, Caldeira S, Skomedal H, Tu IP, Hernandez-Boussard T, Johnson SW, O'Dwyer PJ, Fero MJ, Kristensen GB, Borresen-Dale AL, Hastie T, Tibshirani R, van de Rijn M, Teng NN, Longacre TA, Botstein D, Brown PO, Sikic BI. Molecular Biology of the Cell. 2003;14:4376–4386. doi: 10.1091/mbc.E03-05-0279. [DOI] [PMC free article] [PubMed] [Google Scholar]
- 7.Schwartz DR, Kardia SLR, Shedden KA, Kuick R, Michailidis G, Taylor JMG, Misek DE, Wu R, Zhai YL, Darrah DM, Reed H, Ellenson LH, Giordano TJ, Fearon ER, Hanash SM, Cho KR. Cancer Research. 2002;62:4722–4729. [PubMed] [Google Scholar]
- 8.Alaiya AA, Franzen B, Hagman A, Dysvik B, Roblick UJ, Becker S, Moberger B, Auer G, Linder S. International Journal of Cancer. 2002;98:895–899. doi: 10.1002/ijc.10288. [DOI] [PubMed] [Google Scholar]
- 9.Hess V, A'Hern R, Nasiri N, King DM, Blake PR, Barton DPJ, Shepherd JH, Ind T, Bridges J, Harrington K, Kaye SB, Gore ME. Journal of Clinical Oncology. 2004;22:1040–1044. doi: 10.1200/JCO.2004.08.078. [DOI] [PubMed] [Google Scholar]
- 10.Singer G, Kurman RJ, Chang HW, Cho SKR, Shih IM. American Journal of Pathology. 2002;160:1223–1228. doi: 10.1016/s0002-9440(10)62549-7. [DOI] [PMC free article] [PubMed] [Google Scholar]
- 11.Seidman JD, Kurman RJ. American Journal of Surgical Pathology. 1996;20:1331–1345. doi: 10.1097/00000478-199611000-00004. [DOI] [PubMed] [Google Scholar]
- 12.Sehdev AES, Sehdev PS, Kurman RJ. American Journal of Surgical Pathology. 2003;27:725–736. doi: 10.1097/00000478-200306000-00003. [DOI] [PubMed] [Google Scholar]
- 13.Silva EG, Tornos CS, Malpica A, Gershenson DM. Modern Pathology. 1997;10:663–667. [PubMed] [Google Scholar]
- 14.Shih IM, Kurman RJ. American Journal of Pathology. 2004;164:1511–1518. doi: 10.1016/s0002-9440(10)63708-x. [DOI] [PMC free article] [PubMed] [Google Scholar]
- 15.Ahmed N, Oliva KT, Barker G, Hoffmann P, Reeve S, Smith IA, Quinn MA, Rice GE. Proteomics. 2005;5:4625–4636. doi: 10.1002/pmic.200401321. [DOI] [PubMed] [Google Scholar]
- 16.Jones MB, Krutzsch H, Shu HJ, Zhao YM, Liotta LA, Kohn EC, Petricoin EF. Proteomics. 2002;2:76–84. [PubMed] [Google Scholar]
- 17.Kachman MT, Wang HX, Schwartz DR, Cho KR, Lubman DM. Analytical Chemistry. 2002;74:1779–1791. doi: 10.1021/ac011159c. [DOI] [PubMed] [Google Scholar]
- 18.Wang HX, Kachman MT, Schwartz DR, Cho KR, Lubman DM. Proteomics. 2004;4:2476–2495. doi: 10.1002/pmic.200300763. [DOI] [PubMed] [Google Scholar]
- 19.Hamler RL, Zhu K, Buchanan NS, Kreunin P, Kachman MT, Miller FR, Lubman DM. Proteomics. 2004;4:562–577. doi: 10.1002/pmic.200300606. [DOI] [PubMed] [Google Scholar]
- 20.Russell P. Blausteins pathology of the femal genital tract. SpringerVerlag; New York: 1994. pp. 705–782. [Google Scholar]
- 21.Scully RE, Yound RH, Clement PB. Tumors of the Ovary, Maldeveloped Gonads, Fallopian Tube, and Broad Ligament. Armed Forces Institute of Pathology; Washington, D. C.: 1998. [Google Scholar]
- 22.Wang YF, Wu R, Cho KR, Shedden KA, Barder TJ, Lubman DM. Molecular & Cellular Proteomics. 2006;5:43–52. doi: 10.1074/mcp.T500023-MCP200. [DOI] [PubMed] [Google Scholar]
- 23.Keller A, Nesvizhskii AI, Kolker E, Aebersold R. Analytical Chemistry. 2002;74:5383–5392. doi: 10.1021/ac025747h. [DOI] [PubMed] [Google Scholar]
- 24.Kononen J, Bubendorf L, Kallioniemi A, Barlund M, Schraml P, Leighton S, Torhorst J, Mihatsch MJ, Sauter G, Kallioniemi OP. Nature Medicine. 1998;4:844–847. doi: 10.1038/nm0798-844. [DOI] [PubMed] [Google Scholar]
- 25.Liu HB, Sadygov RG, Yates JR. Analytical Chemistry. 2004;76:4193–4201. doi: 10.1021/ac0498563. [DOI] [PubMed] [Google Scholar]
- 26.Byrne JA, Tomasetto C, Garnier JM, Rouyer N, Mattei MG, Bellocq JP, Rio MC, Basset P. Cancer Research. 1995;55:2896–2903. [PubMed] [Google Scholar]
- 27.Byrne JA, Balleine RL, Fejzo MS, Mercieca J, Chiew YE, Livnat Y, St Heaps L, Peters GB, Byth K, Karlan BY, Slamon DJ, Harnett P, Defazio A. International Journal of Cancer. 2005;117:1049–1054. doi: 10.1002/ijc.21250. [DOI] [PubMed] [Google Scholar]
- 28.Rubin MA, Varambally S, Beroukhim R, Tomlins SA, Rhodes DR, Paris PL, Hofer MD, Storz-Schweizer M, Kuefer R, Fletcher JA, Hsi BL, Byrne JA, Pienta KJ, Collins C, Sellers WR, Chinnaiyan AM. Cancer Research. 2004;64:3814–3822. doi: 10.1158/0008-5472.CAN-03-3881. [DOI] [PubMed] [Google Scholar]
- 29.Wang RX, Xu JC, Saramaki O, Visakorpi T, Sutherland WM, Zhou JG, Sen B, Lim SD, Mabjeesh N, Amin M, Dong JT, Petros JA, Nelson PS, Marshall FF, Zhau HE, Chung LWK. Cancer Research. 2004;64:1589–1594. doi: 10.1158/0008-5472.can-03-3331. [DOI] [PubMed] [Google Scholar]
- 30.Balleine RL, Fejzo MS, Sathasivam P, Basset P, Clarke CL, Byrne JA. Genes Chromosomes & Cancer. 2000;29:48–57. doi: 10.1002/1098-2264(2000)9999:9999<::aid-gcc1005>3.0.co;2-o. [DOI] [PubMed] [Google Scholar]
- 31.Boutros R, Fanayan S, Shehata M, Byrne JA. Biochemical and Biophysical Research Communications. 2004;325:1115–1121. doi: 10.1016/j.bbrc.2004.10.112. [DOI] [PubMed] [Google Scholar]
- 32.Fraga CH, True LD, Kirk D. Journal of Urology. 1998;159:270–274. doi: 10.1016/s0022-5347(01)64080-1. [DOI] [PubMed] [Google Scholar]
- 33.Cuezva JM, Krajewska M, de Heredia ML, Krajewski S, Santamaria G, Kim H, Zapata JM, Marusawa H, Chamorro M, Reed JC. Cancer Research. 2002;62:6674–6681. [PubMed] [Google Scholar]
Associated Data
This section collects any data citations, data availability statements, or supplementary materials included in this article.