Abstract
We present an integrated top-down and bottom-up approach that is facilitated by concurrent liquid chromatography-mass spectrometry (LC-MS) analysis and fraction collection for comprehensive high-throughput intact protein profiling. The approach employs high resolution reversed phase (RP) LC separations coupled on-line with a 12T Fourier transform ion cyclotron resonance (FTICR) mass spectrometer to profile and tentatively identify modified proteins, using detected intact protein masses in conjunction with bare protein identifications from the bottom-up analysis of the corresponding LC fractions. Selected identifications are incorporated into a target ion list for subsequent offline gas-phase fragmentation that uses an aliquot of the original fraction used for bottom-up analysis. In a proof-of-principle demonstration, this comprehensive strategy was applied to identify protein isoforms arising from various amino acid modifications (e.g. acetylation, phosphorylation) and genetic variants (e.g. single nucleotide polymorphisms, SNPs isoforms). This strategy overcomes major limitations of traditional bottom-up (e.g., inability to characterize multiple unexpected protein isoforms and genetic variants) and top-down (e.g., low throughput) approaches.
Introduction
Bottom-up and top-down strategies for mass spectrometry (MS) based protein characterization are complementary; each with its own strengths and weaknesses. In bottom-up strategies, proteomic measurements at the peptide level offer a basis for comprehensive protein identification.1–5 However, important information may be ultimately unobtainable since only a portion of the entire protein is generally detected and different proteins can have tryptic peptides that are indistinguishable (e.g., families of highly related genes). The information on proteolytic processing is generally lost in peptide centric analyses. Similarly, information regarding the coordination of posttranslational modifications (PTMs) is generally lacking. Indeed, even for bottom-up approaches targeted at the identification of modifications, important information is inevitably lost, e.g., are two sites modified in concert or independently? From a data analysis standpoint, peptide-centric measurements significantly complicate protein quantitation due to the existence of multiple protein isoforms. For instance, PTMs can significantly affect protein activity without a change in overall protein abundance. As protein quantity is typically compiled using information obtained for multiple peptides in bottom up approaches, the assumption of “all peptides being equal” can potentially introduce significant errors since it is virtually impossible to know whether a peptide is specific to a single protein isoform or common to multiple isoforms. For these reasons, measurements at the intact protein level provide an important adjunct to peptide level measurements.
Top-down proteomic strategies that involve gas-phase dissociation of intact proteins6–18 have demonstrated 100% protein sequence coverage and allowed for the identification of protein isoforms, proteolytic processing events, and PTMs. 19–28 However, these strategies presently suffer from limited sensitivity and throughput.8, 29 The most recent and significant advancements in the context of top-down proteomics are electron capture dissociation (ECD)23, 25, 30–34 and electron transfer dissociation (ETD)35–37. These techniques typically provide more uniform dissociation than conventional collisionally induced dissociation (CID), while preserving the labile modifications. However, EC/TD based approaches have been demonstrated only occasionally for intact protein characterization and have not yet been effectively incorporated into a high-throughput comprehensive top-down proteomic analysis.
Top-down platforms have been applied to characterize limited subsets of proteins (~100) from microorganisms,26, 27 human proteins,20, 21, 24 and even proteins with molecular masses above 200 kDa.9 However, top-down approaches face a number of challenges in addition to limited throughput. For example, on-line liquid chromatography- tandem mass spectrometry (LC-MS/MS) platforms for intact protein characterization have met with only limited success; 29 most often, MS/MS is accomplished offline (e.g., using collected LC fractions) to allow for spectral averaging and to generate sufficient information on fragment ions. Another major challenge is MS/MS data interpretation. ProSightPTM,38–40 which uses accurate neutral masses inferred from tandem mass spectra, is virtually the only available tool for identifying intact proteins. When combined with known or predicted information, ProSightPTM facilitates PTM identification, but at present cannot address unknown or unexpected modifications and/or single nucleotide polymorphisms (SNPs). Additionally, major challenges associated with sensitivity, higher molecular mass proteins (>100 kDa), and highly hydrophobic proteins (e.g., integral membrane proteins) remain largely unsolved thus, limiting the applicability of top-down proteomics on a large scale. Similarly, effective separation of minute amounts of a complex mixture of proteins with a variety of physicochemical properties prior to MS analysis represents an overarching technical challenge.
For these reasons, various integrated approaches that combine complementary information from bottom-up and intact protein analyses have been adopted for analyzing intact proteins.41–45 Typically, intact protein separations are employed to differentiate between protein isoforms and fractionate proteins to a level such that the reduced complexity enables the identification of protein masses from peptide level characterization of the same fraction. Based on earlier studies,41, 46 precise intact protein mass is sufficient for identifying a limited number of proteins detected in an LC fraction. For example, application of this approach to the bacterium Shewanella oeidensis resulted in tentative identification of only ~10% of detected intact S. oeidensis proteins. However, ~60% of the tentatively identified intact proteins were modified, indicating a prevalence of modified proteins even at the microbial level.41 The failure to identify 90% of detected intact proteins illustrates the combinatorial challenge posed by the large number of possible modifications and too many bottom-up derived candidates, which must be considered as potentially being present. This suggests that mass measurement accuracy (MMA) is still inadequate and additional data (e.g. MS/MS) is still required to increase confidence and expand the set of identified proteins. Alternatively, fractions of limited complexity (several proteins) and known composition would provide identifications that are more confident.
In response to these obstacles, we have combined intact protein separations with on-line spectral acquisition and fraction collection. A key advantage offered by this approach in comparison to conventional top-down proteomics is that it eliminates the need for MS/MS analysis of the intact proteins that often cannot be effectively performed on the separation time scale, while still providing a protein fingerprint in the form of its corresponding peptides. Importantly, unlike the earlier strategy where complex intact protein mixtures (e.g., weak anion exchange fractions) were independently analyzed at the peptide and protein level,41 this current approach preserves a direct link between the protein (mass) and its corresponding tryptic peptides (MS/MS data) since all tryptic peptides are confined to the chromatographic peak (i.e., on-line collected RPLC fraction) of the protein. Protein identification greatly benefits from this preserved linkage and time-consuming off-line intact protein MS/MS can be performed in a targeted fashion. For example, to confirm and/or localize specific modifications or interesting proteins (e.g., proteins showing statistically significant change in abundance between two biological states), thereby increasing overall effectiveness and/or throughput of the analysis. This combination of intact protein mass and abundance information with bottom-up derived protein identity is similar to traditional gel-based proteomics, but this integrated approach has the advantage of allowing subsequent MS/MS (top-down) or Western blot characterization of biologically relevant targets.
The platform used to demonstrate the integrated approach employs high resolution reversed phase LC (RPLC) separations coupled to on-line fraction collection and a 12 Tesla Fourier transform ion cyclotron resonance (FTICR) spectrometer. Modified proteins are tentatively identified using detected intact protein masses in conjunction with “bare” protein identifications from bottom-up analysis of the collected RPLC fraction. The bottom-up data provide a means to estimate relative abundances for each identified protein across fractions, which allows us to match the LC elution pattern generated from peptide-level data to the intact protein LC-MS profile. Here, the protein abundance was estimated in each fraction using peptide counts, i.e. counting the number of identified peptides per protein. The additional constants from the aligned top-down and bottom-up datasets limit the protein search space, thereby improving the confidence for identifications based on accurate mass measurements and facilitating the discovery of unexpected modifications and/or amino acid substitutions. Additionally, this integrated approach holds great promise for profiling protein abundances at a level that incorporates the protein modification complement and affords high-throughput selection of biologically relevant targets for subsequent offline gas-phase fragmentation using an aliquot of the original fraction used for bottom-up analysis.
We have initially evaluated this strategy by identifying modifications and isoforms from a mixture of standard proteins. Despite the simplicity of our model system, we were able to identify a surprisingly rich set of proteins that included various isoforms stemming from SNPs and different PTMs (e.g., acetylation, phosphorylation, heme-containing proteins) in addition to contaminant proteins. We further applied the integrated approach to analyze the yeast proteasome and identified several classes of PTMs, including oxidation, phosphorylation, methylation, as well as proteolytic processing activity, demonstrating the feasibility of the integrated approach and its applicability for the analysis of larger proteins.
Experimental Section
Materials
The following standard proteins were purchased from Sigma: ubiquitin (U6253), cytochrome C (C2037), β-lactoglobulin A (L7880), β-lactoglobulin B (L8005), β-casein (C6905), carbonic anhydrase II (C3934), and myoglobin (M1882). Trypsin was obtained from Promega (Madison, WI). Calmodulin [accession number MCCH (PIR database) or P02593 (SWISS-PROT database)] was cloned, expressed, and purified under standard conditions, with polyhistidine tag (i.e. GHHHHHHGGGGGIL) on the C-terminus for nickel affinity purification.47 S. cerevisiae proteasome complex was purchased from BIOMOL (Plymouth Meeting, PA).
Intact protein LC-FTICR MS with on-line fractionation
LC-FTICR MS and simultaneous fractionation was accomplished using the Triversa NanoMate 100 (Advion BioSciences, Inc.; Ithaca, NY). The RPLC system used for on-line intact protein separations was similar to that previously reported.41 Briefly, the column (70 cm × 200 μm i.d.) was packed in-house with Phenomenex Jupiter particles (C5 stationary phase, 5 μm particle diameter, 300 Å pore size). Mobile phase A was composed of 0.05% trifluoroacetic acid (TFA), 0.2% acetic acid, 5% isopropanol, 25% acetonitrile (ACN), and 69.75% water. Mobile phase B consisted of 0.1% TFA, 9.9% water, 45% isopropanol, and 45% ACN. The operating pressure was 10,000 psi, and the estimated flow rate was ~5.5 μl/min. The LC separations were carried out at constant pressure (10,000 psi) as reported earlier.48 The RPLC system was equilibrated at 10,000 psi with 100% mobile phase A. Next, a mobile phase selection valve was switched to create a near-exponential gradient as mobile phase B displaced A in a 2.5 mL mixer. A split was used to provide an initial flow rate through the column of ~5.5 μl/min and most proteins eluted in less than 2 hours. The column eluant was split with ~300 nl/min of the flow directed to a modified Bruker 12 T APEX-Q FTICR mass spectrometer,41 and ~5.2 μl/min collected into a 96-well Eppendorf Twin-pac plate. The standard protein mixture was prepared in mobile phase A, using the protein concentrations specified in Table 1. Total sample injection volume was 20 μl (~20 μg total protein). A pressure of 0.25–0.35 psi and a voltage of 1.45-1.7 kV was used for the nanoESI employing NanoMate 100 system. A novel compensated trapped-ion cell with improved DC potential harmonicity was employed to enhance mass measurement accuracy and sensitivity.49 During the LC-MS analysis, a single mass spectrum was recorded using 512k data points, and the average of two mass spectra was used for data analysis.
Table 1.
Mixture of standard proteins used for proof-of-principle demonstration.
| Protein | Mr (Da) | Conc. (pmol/μl) |
|---|---|---|
| ubiquitin | 8564.6302 | 1.27 |
| carbonic anhydrase II | 29024.7312 | 4.51 |
| β-lactoglobulinA | 18363.4538 | 7.92 |
| β-lactoglobulinB | 18277.4169 | 7.96 |
| calmodulin | 18097.471 | 9.04 |
| β-casein | 23983.191 | 7.58 |
| cytochrome C | 12229.2193 | 11.89 |
| myoglobin | 16950.992 | 5.36 |
Offline protein MS/MS analysis
One-third of the collected fraction volume (~5 μl) was used for offline MS/MS analysis. ESI-MS/MS was carried out with a NanoMate 100, a combined autosampler (a rack of 96 disposable and conductive pipette tips and a 96-well microtiter plate that contained samples to be analyzed) and a nanoESI source (a chip-based nanoESI device with 400 nozzles). CID-MS/MS analyses were accomplished by reducing the DC offset on the accumulation hexapole from 0 V to −25 V. Ten to fifty mass spectra were averaged to obtain fragment ion information of desired quality (i.e., such that the S/N ratio is larger than 3 for more than 80% fragment peaks). ECD-MS/MS analyses were performed using a heated hallow cathode located outside the ICR cell (i.e., the standard Bruker ECD arrangement). The cathode was heated with a current through the filament of 1.6–1.8 A. A 1–3 ms electron injection time was used with the potential on the solid cathode dispenser set at −7.5 V to −15 V. Again, up to 50 mass spectra were averaged to obtain fragment ion information of sufficient quality.
On-plate fraction digestion
A 50 mM ammonium bicarbonate in 30% (v/v) aqueous ACN (pH 8.2) was used as the digestion buffer. An aliquot of each fraction (~5 μl) collected during RPLC was used for top-down analysis (described above). The remaining sample was digested on-plate overnight at 37°C by adding 10 μl trypsin in digestion buffer (10 μg/ml). Samples were evaporated on the plate to remove extra organic solvent (to ~5 μl remaining volume) using SpeedVac. The final volume was adjusted to 15 μl with mobile phase A.
RPLC-Ion Trap (IT) peptide MS/MS analysis
The capillary RPLC system used for peptide separations has been previously described.48 Briefly, the separation was performed under a constant pressure of 5000 psi, using two ISCO (Lincoln, NE) Model 100 DM high-pressure syringe pumps and a column (60 cm × 150 μm i.d.) packed in-house with Phenomenex (Torrance, CA) Jupiter particles (C18 stationary phase, 5 μm particles, 300 Å pore size). Mobile phase A consisted of 0.05% TFA, 0.2% acetic acid, and 99.75% water. Mobile phase B consisted of 0.1% TFA, 9.9% water, and 90% ACN. Approximately 5 μl of the digest from each fraction (about half of the total fraction volume) was loaded onto the column for 20 min. The gradient was produced by adding mobile phase B to a stirred mixing chamber (2.5 ml volume) that was initially filled with mobile phase A. A split was used to provide an initial flow rate through the column of ~2 μL/min. ESI using an etched fused-silica tip50 was employed to interface the RPLC separation to a Finnigan (San Jose, CA) LTQ linear ion trap. A maximum of five MS/MS spectra were recorded for the most intense peaks in each survey mass spectrum.
Data processing
Peptide RPLC-IT MS/MS data were processed using SEQUEST51 and a database that contained both genome derived possible S. oneidensis protein sequences52 and the standard protein sequences listed in Table 1. No enzyme rules were applied, and identified peptides were filtered according to the criteria suggested by Washburn et al.53 Provisional databases that contained proteins supported by at least two distinct peptide identifications and in the protein mass range of 5–40 kDa were created for each fraction.
Intact protein RPLC-FTICR mass spectra were processed using in-house developed software (ICR-2LS and Viper;54 available at http://ncrr.pnl.gov/software/) as described in Sharma et al.41 Time-domain signals were apodized (Hanning) and zero-filled (twice) prior to FT. All spectra were externally calibrated, using myoglobin and ubiquitin spectra acquired in a separate LC-MS analysis.
The resulting mono-isotopic masses were clustered into features based on neutral mass, charge state, abundance, isotopic fit, and spectrum number (relating to RPLC retention time). Spectra that corresponded to a particular feature were summed, and the resulting spectrum reprocessed as described above. Next, all charge states in the m/z range were collapsed into a zero charge state spectrum (i.e. neutral mass), which were then searched against the appropriate provisional protein database (assembled from bottom-up data) for tentative intact protein identifications. Mass measurements were manually inspected by matching the observed most abundant peak to the theoretical one. Discrepancies between the measured protein masses and the predicted masses for proteins in the provisional databases were used to search for a limited set of protein PTMs (discussed in following section).
Intact protein MS/MS spectra were analyzed using ICR-2LS and/or ProSightPTM (https://prosightptm.scs.uiuc.edu/) and protein sequences identified in bottom-up analyses.
Results and Discussion
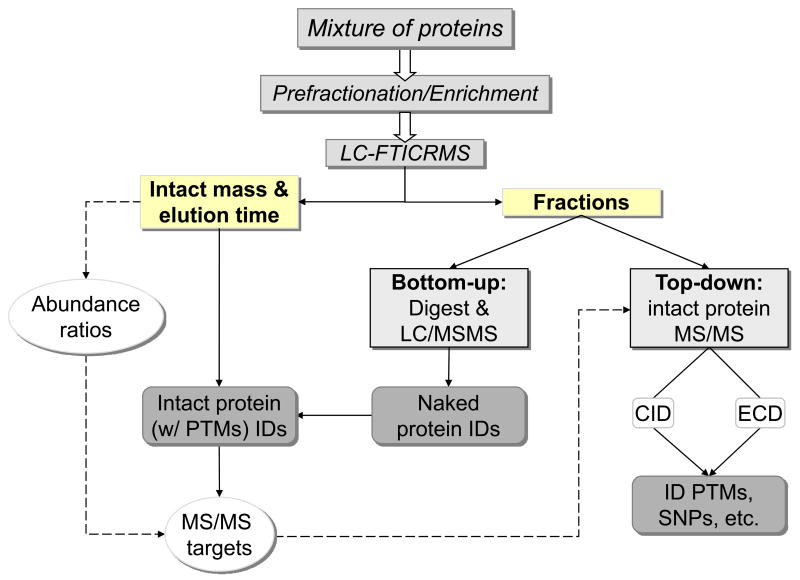
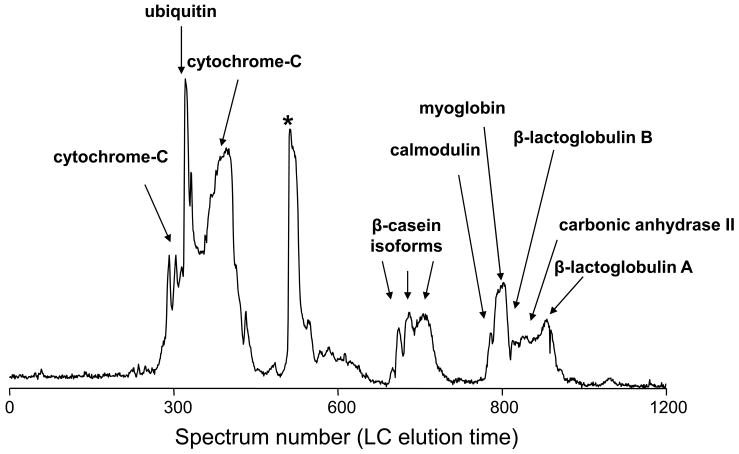
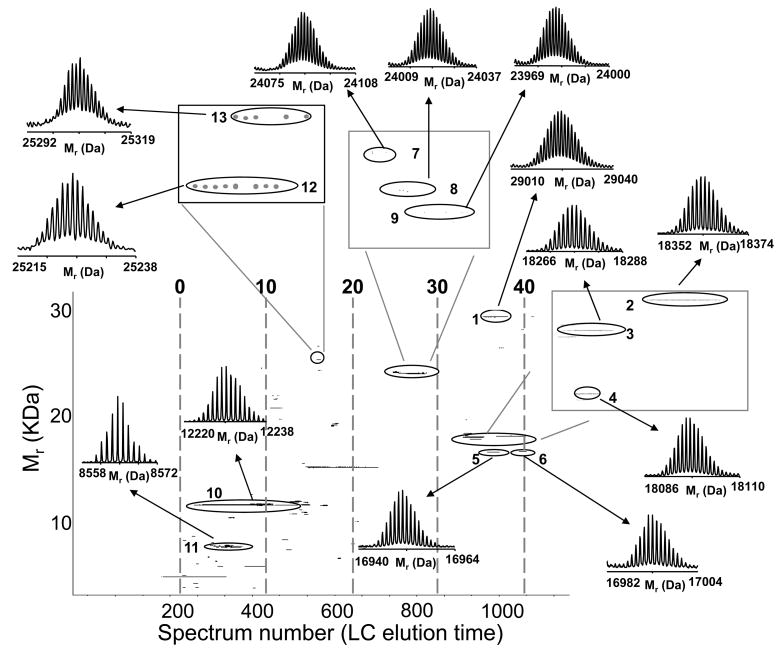
Figure 1 depicts the integrated bottom-up and top-down approach used to analyze a mixture of standard proteins (Table 1). The total ion chromatogram reconstructed from the FTICR spectra acquired during an RPLC separation of the standard proteins is shown in Figure 2A, and the corresponding 2D display (neutral mass vs. spectrum number, i.e. retention time), in Figure 2B. Each of the 42 fractions collected over the course of the LC-MS analysis were separated into two aliquots: one for bottom-up (~2/3 of the total fraction volume), and the other for follow-up top-down analysis (~1/3 of the total fraction volume). Tentative protein and modified protein identifications were assigned by matching bottom-up results to the measured intact protein masses, while allowing for a limited set of PTMs (i.e., methylation, acetylation, oxidation, phosphorylation, heme, and loss of the N-terminal Met). (Table 2) The MMA <10 ppm used for tentative protein identification was based on the data quality estimated as described by Sharma et al.41
Figure 1.
Schematic of the integrated top-down and bottom-up strategy. Protein mixtures are fractionated to a level at which their reduced complexity allows the inference of proteins from peptide-level characterization of the same fraction. Accurate intact protein mass and time measurements facilitate protein abundance profiling that incorporates protein modifications, as well as high-throughput selection of biologically relevant targets for subsequent offline gas-phase fragmentation using only an aliquot of the original fraction used for bottom-up analysis.
Figure 2.
Intact LC-MS analysis of a standard protein mixture: A) RPLC-FTICR MS total ion chromatogram and B) 2D display reconstructed from the LC-MS data. Proteins and modified proteins were tentatively identified (Table 2) by matching bottom-up data with the measured intact protein masses. Note that the peak labeled with * in A is assigned as a mixture of a putative myoglobin degradation fragments. The resolving power of the isotope distributions in this and Figures 5 and 9 is ~60,000. The acquired m/z data has a resolution of ~100,000. The major reduction in resolution occurs during the hyper-transform of m/z isotope isotopic distributions from multiple charge states into a single neutral charge isotope distribution.
Table 2.
Summary of results obtained for mixture of standard proteins using the integrated approach. Tentative identifications of proteins and modified proteins were accomplished by matching bottom-up data with the measured intact protein masses. Protein assignments (with exception of α-caseins) were subsequently confirmed by protein MS/MS analyses using collected fractions.
| Spot in Fig 2B | Measured Mr (Da) | Theoretical Mr (Da) | Protein | Modifications | Eluted in Fractions | MMA (ppm) |
|---|---|---|---|---|---|---|
| 1 | 29024.7313 | 29024.7312 | carbonic anhydrase II | Removal of N-term Met, N-acetylation | [33,36] | 0.00 |
| 2 | 18363.4561 | 18363.4538 | β-lactoglobulin A | 2 disulfide bonds | [35,37] | 0.13 |
| 3 | 18276.4323 | 18276.4169 | β-lactoglobulin B | 2 disulfide bonds | [32,34] | 0.84 |
| 4 | 18097.4866 | 18097.471 | Calmodulin | with His-tag | [31.33] | 0.86 |
| 5 | 16950.9857 | 16950.992 | myoglobin | Intact protein | [34,36] | −0.37 |
| 6 | 16993.0104 | 16993.0025 | myoglobin | Lys-acetylation | 42 | 0.46 |
| 7 | 24092.3436 | 24092.2661 | β-casein, variant B | 5 phosphorylations, P67H(SNP) and S122R (SNP) to variant A2 | 26 | 3.22 |
| 8 | 24023.2204 | 24023.1971 | β-casein, variant A1 | 5 phosphorylations, P67H(SNP) to variant A2 | 27 | 0.97 |
| 9 | 23983.2346 | 23983.191 | β-casein, variant A2 | 5 phosphorylations | [28,30] | 1.82 |
| 10 | 12229.2211 | 12229.2193 | cytochrome C | Removal of N-term Met, N-acetylation, with Heme | [3,12] | 0.15 |
| 11 | 8564.6471 | 8564.6302 | ubiquitin | Intact protein | [4,7] | 1.97 |
| 12 | 25226.9975 | 25227.0194 | α-casein2 | 11 phosphorylations | 14 | 0.87 |
| 13 | 25306.1167 | 25305.9875 | α-casein2 | 12 phosphorylations | 14 | −5.18 |
Protein LC-MS profiles were then generated, using unique peptides identified in bottom-up analyses (as illustrated in Figure 3) for the later portion of the LC-MS analysis. Proteins typically displayed distinctive elution patterns. For instance, carbonic anhydrase mainly eluted in fractions 33–36, while calmodulin eluted in fractions 31–33. As a result, the elution patterns generated using bottom-up data could be used to restrict the identity of intact protein masses (observed in LC-MS analysis) to a particular combination of PTM, SNPs, N-/C- terminal cleavage(s), etc. Tentative identifications were subsequently confirmed by MS/MS analyses of the collected intact protein fractions. In the present implementation of the integrated approach, intact protein MS/MS limits the overall throughput and is therefore performed in a targeted fashion. For instance, in a comparative proteomics experiment, only species showing statistically significant change in abundance between two states as determined by comparison of their LC-MS profiles would be selected for MS/MS identity confirmation. To increase overall sensitivity, this type of comparative analysis is currently accomplished using a 75μm i.d. column with <1 μg of total protein load compared with 200 μm i.d. column and >10 μg of total protein load typically employed for on-line fractionation.
Figure 3.
Heat map representation of protein elution patterns generated for the later portion of the LC-MS analysis using tryptic peptides identified in each fraction. Observation counts of the peptides for each protein are used to derive relative protein abundances. The observation counts were normalized by dividing the value obtained for each protein with the sum of the values for the protein (row), with the scale ranging from 0 (i.e. least abundant, green) to 1 (i.e. most abundant, red). The columns in the heat map represent the RPLC fraction number.
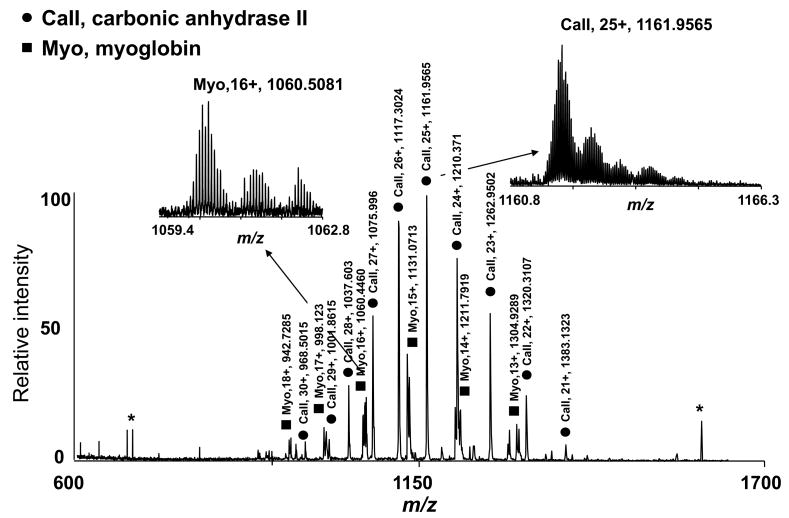
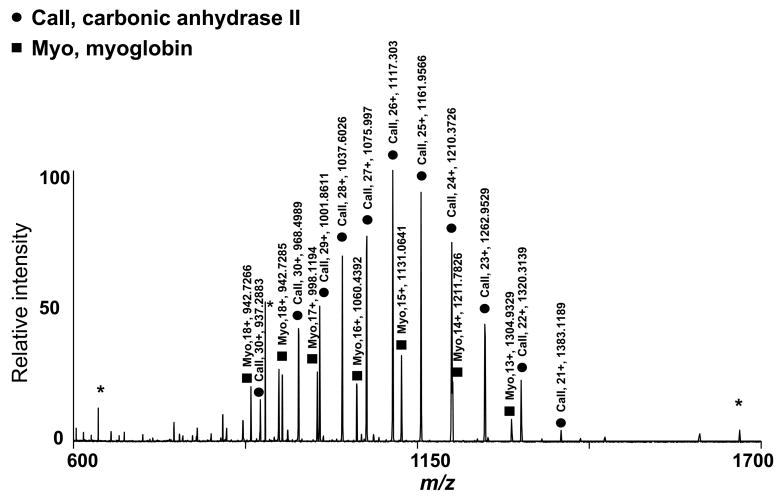
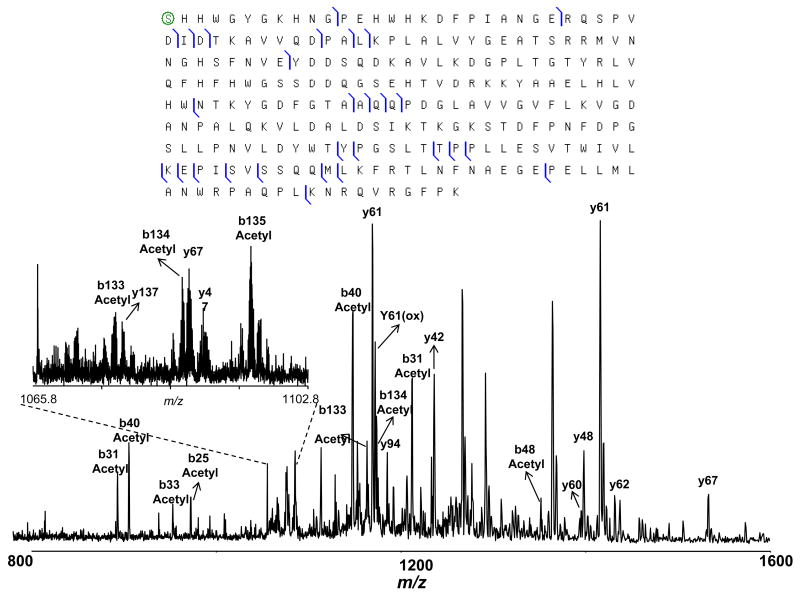
The correlation between on-line LC-MS data and MS data obtained for a reconstructed fraction is exemplified in Figure 4. The intact protein mass spectrum acquired for reconstituted fraction 35 (Figure 4A) is virtually identical to the mass spectrum reconstructed from the LC-MS data by summing all of the spectra acquired on-line during collection of fraction 35 (Figure 4B). The shift in the charge state distribution was attributed to different solvent compositions, while the observed increase in the degree of oxidation for the reconstituted fraction likely resulted from storage and/or chip-based nanoESI.55 The most abundant species that eluted in fraction 35 were tentatively assigned as acetylated carbonic anhydrase II by matching the intact protein mass and bottom-up data acquired for fraction 35 (MMA ~0.01 ppm). MS/MS analysis of reconstituted fraction 35 confirmed this protein to be carbonic anhydrase II acetylated at the N-terminus (Figure 4C).
Figure 4.
Identification of carbonic anhydrase II in fraction 35. A) Mass spectrum obtained for reconstituted fraction 35; B) mass spectrum obtained by summing all of the spectra acquired online during the collection of the fraction 35; C) CID MS/MS data acquired for m/z=1161. (Note that the peaks labeled with * are noise peaks.)
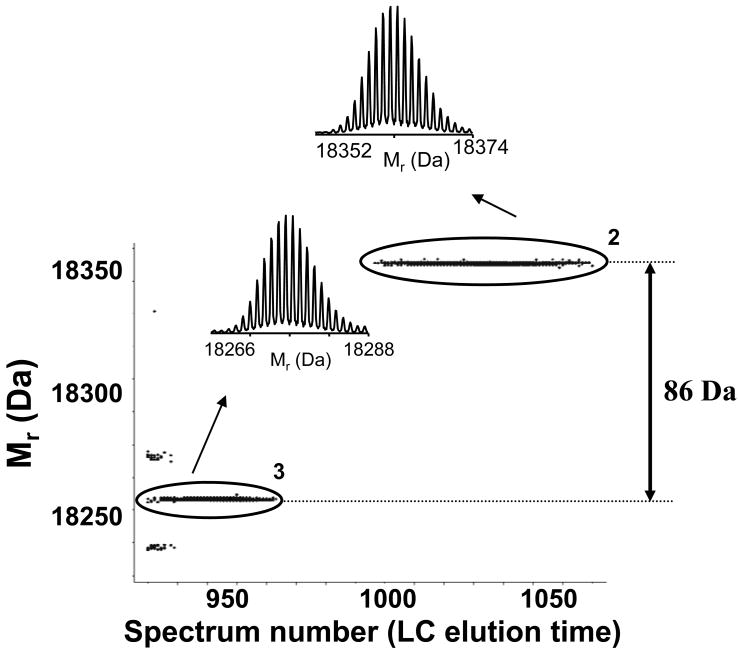
Bottom-up data indicated the presence of β-lactoglobulin B in a broad range of fractions (i.e., 31 – 38). The elution profile (Figure 5A), which was generated using relative protein abundances derived from the bottom-up data, revealed two elution peaks (i.e., fractions 32–33 and fraction 36), in contrast to the majority of analyzed proteins that typically displayed a single peak. In addition, only early eluting peaks (e.g., cluster 3 in Figure 5A) could be identified using accurate intact protein masses as a β-lactoglobulin B with two disulfide bonds (MMA=0.8 ppm56). Hence, while the intact protein data indicated that β-lactoglobulin B protein eluted before fraction 34 was collected, the bottom-up data suggested that fraction 36 should also contain this protein. Intact protein data acquired for fractions 35–38 revealed the presence of a highly abundant protein with the molecular mass of 18363.45 Da, which was apparently incorrectly identified in the bottom-up analysis (i.e., measured intact protein mass was 86.03 Da higher than theoretical mass of β-lactoglobulin B). However, measured mass agreed well with β-lactoglobulin A theoretical mass (MMA = 0.1 ppm). A comparison of the two sequences (β-lactoglobulin A and B) revealed that they differ in only two amino acids (Figure 5B). Top-down analysis (CID), performed using reconstituted fractions confirmed the presence of β-lactoglobulin B (Mr =18277.42 Da) in fraction 32 and β-lactoglobulin A (Mr =18363.45 Da) in fraction 36 (data not shown). Thus, by combining intact protein information (mass and elution time) with bottom-up derived protein identity, this integrated approach provides information that would be challenging at present by either approach alone, particularly for a complex protein mixture.
Figure 5.
A) 2D display reconstructed from the intact LC-MS data over β-lactoglobulin B containing fractions according to its profile pattern from the bottom-up results. Insets show representative neutral mass spectra. B) Sequence alignment for β-lactoglobulin B and β–lactoglobulin A.
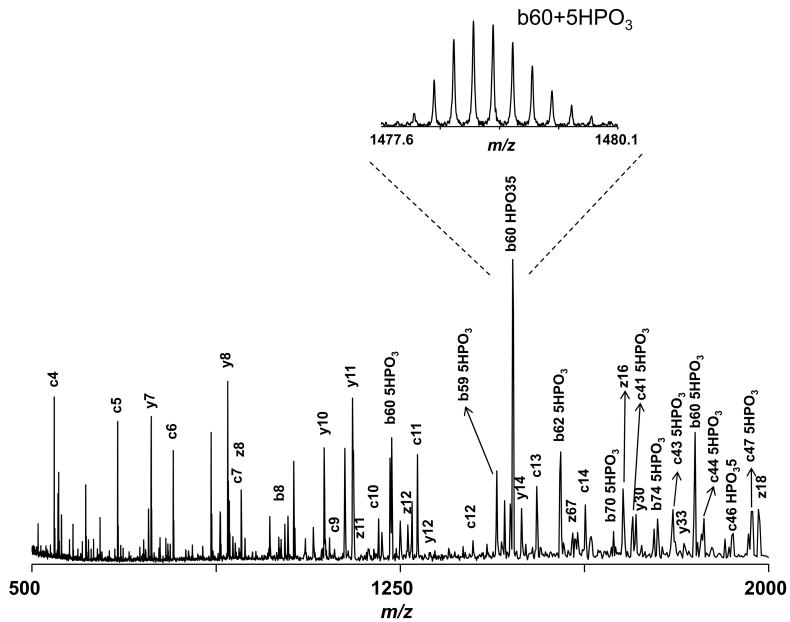
Similarly, the bottom-up results (Figure 3) revealed a majority of β-casein eluted in fractions 26–30. However, the intact protein LC-MS data indicated that three distinct proteins with Mr =24092.34, 24023.22, and 23983.23 Da, eluted sequentially in this region (Figure 6). A protein with Mr =23983.23 Da was matched to β-casein isoform A2 with 5 phosphorylation sites (MMA =1.8 ppm). Intact protein CID (Figure 6) and ECD (Figure 7) data, obtained using reconstituted intact protein fractions, confirmed this assignment. For example, in the ECD spectrum of isoform 1, the fragment masses that generated the sequence tag ELNVNPG that matched β-casein residues 5–11 were assigned as unmodified c ions, indicating the absence of phosphorylation in this region (Figure 7). Similarly, the sequence tag TEDELQD matched β-casein residues 41–47, but all of the associated fragments were identified as c ions bearing five phosphate groups. Finally, five phosphorylation sites were located in the region between residues 15 and 41, which contains a total of seven Thr and Ser residues. Our data indicate that the loss of phosphate moiety is much less pronounced when CID is performed at the intact protein level, as reported earlier.8 Preferential loss of the phosphate moiety relative to the peptide backbone cleavage in the CID spectra of phosphopeptides represents a major challenge for pinpointing phosphorylation sites. Therefore, intact phosphoprotein CID appears promising for mapping phosphoproteins, determining the degree of phosphorylation, and studying phosphorylation dynamics in the context of signaling networks.
Figure 6.
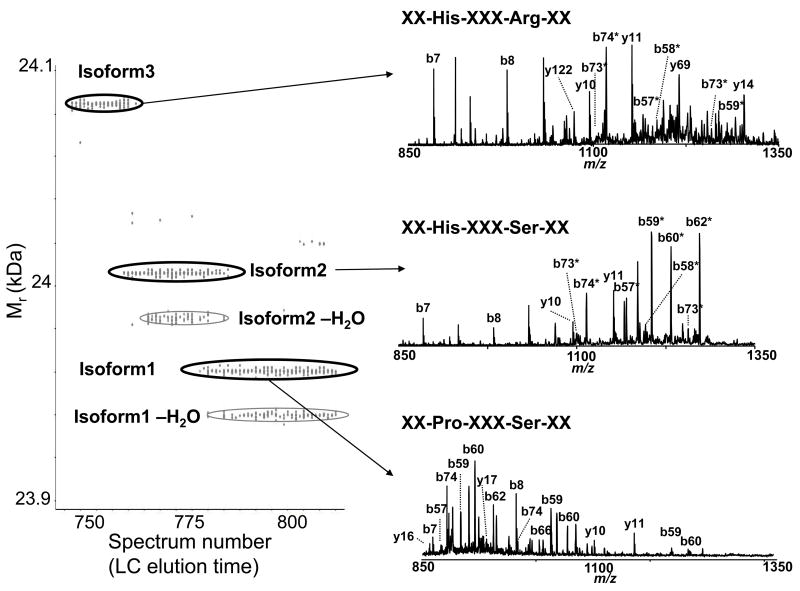
Multiple SNPs for bovine β-casein were identified using the integrated approach. A) β-casein sequence with the annotations of the identified SNPs position. B) Three phosphorylated isoforms of β-casein, differing in mass by +40 Da and +109 Da, were assigned as β-casein genetic variant A2, A1, and B respectively. (Note that the annotations marked with * indicate a mass shift was observed for the identified peaks.)
Figure 7.
ECD spectrum obtained for β-casein isoform 1 isolated in fraction 30 confirmed the identification as variant A2.
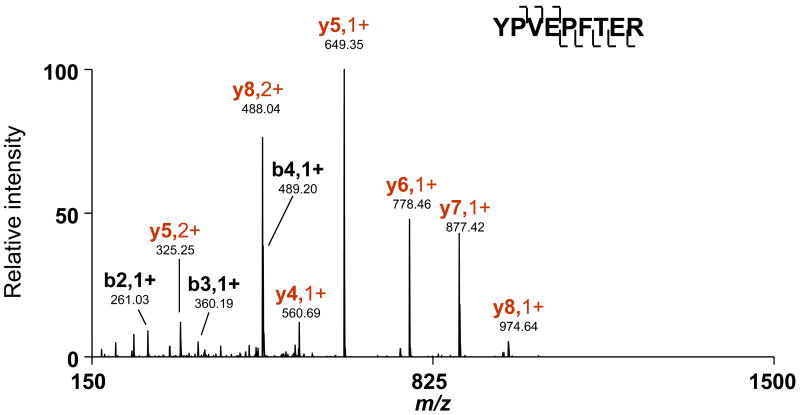
Species with molecular masses of 24092.34 Da and 24023.22 Da could not be identified as modified β-casein species using any combinations of PTMs allowed in the search, and were therefore examined by offline MS/MS. A majority of the species with Mr =24023.22 Da eluted in fraction 26, while a majority of the species with Mr =24092.34 Da were detected in the following fraction (i.e., fraction 27). As shown in Figure 6, the mass differences between the observed intact protein masses, Mr =24023.22 Da (isoform 2) and Mr =24092.34 Da (isoform 3), and the previously identified phosphorylated β-casein (isoform 1) are 39.99 Da and 109.11 Da, respectively. By comparing the CID spectra obtained for isoforms 1 and 2, we identified b62 as the last unmodified b ion, and b74 as the first modified b ion (i.e., a difference in mass of 40 Da from identified isoform 1). Therefore, the modification or amino acid substitution(s) must reside between residues 62 and 74. Considering single amino acid substitutions only, both Pro-to-His and Gly-to-Pro switches will result in a 40 Da mass shift. However, Pro-to-His substitution represents an SNP and is therefore more likely to occur. In fact, β-casein variant A1, in which Pro67 is substituted for His has been reported.57 Similarly, MS/MS data confirmed Pro67-to-His substitution for isoform 3; however, a mass shift of 109.11 Da relative to isoform 1 (phosphorylated β-casein) suggested the presence of additional SNP(s), which resulted in a mass shift of 69.12 Da. Considering all possible amino acid substitutions, this mass shift can only be associated with a Ser-to-Arg switch (an SNP). Using combined CID and ECD data obtained for isoform 3, we were able to associate this delta mass with a substitution of one of the four Ser residues in region 74–160 to Arg. The Ser122-to-Arg mutation was confirmed by the identification of the fully tryptic peptide YPVEPFTER (XCorr =3.0539) in the same fraction (Figure 8), which is in agreement with the previously reported sequence of β-casein variant B.57, 58 Hence, three β-casein isoforms were identified as β-casein genetic variants A2, A1, and B, respectively. The identity of all three β-casein isoforms was additionally confirmed by searching the bottom-up data against these mutant sequences. This example demonstrates the ability of the integrated approach to characterize co-existing protein isoforms that originate from SNPs. Even more importantly, this example highlights a significant pitfall of the conventional bottom-up approaches that cannot validate the presence of multiple distinctive isoforms (i.e., distinguish between one isoform with two SNPs and two isoforms each with a single SNP), even given 100% sequence coverage. As SNPs can have a major impact on how humans respond to disease, environmental insults, and therapy, a characterization strategy such as the one described here can be invaluable for biomedical research.
Figure 8.
Fully tryptic peptide YPVEFTER, identified in fraction 26, further confirmed the assignment of this species as β-casein variant B.
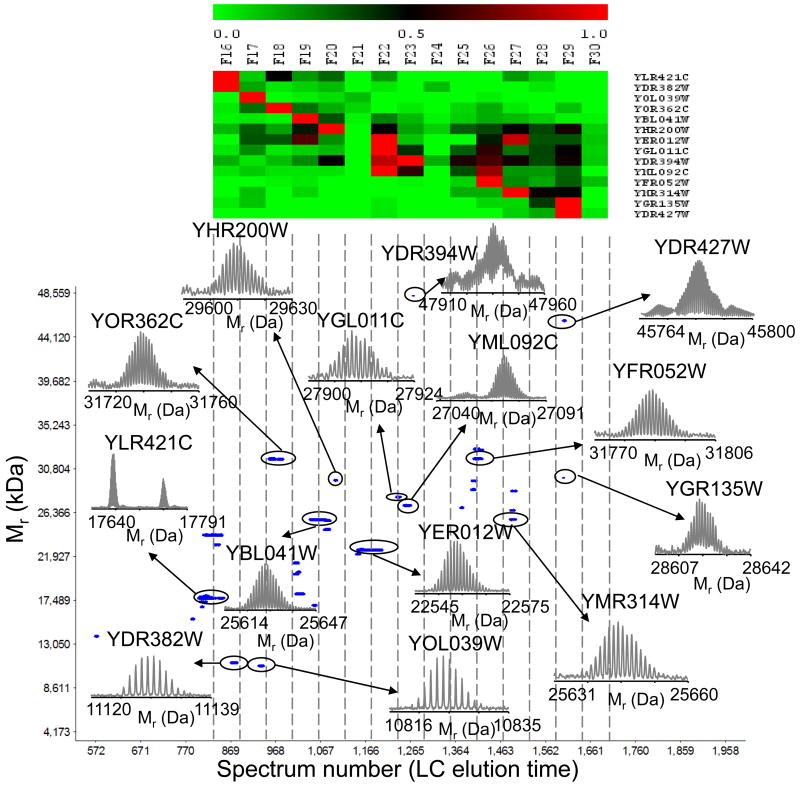
We further applied the integrated approach to characterize the yeast proteasome. A small sample, about 15 μg, was analyzed by LC-MS analysis with concurrent fraction collection revealing the presence of several putative proteins with mass >10 kDa. A subset of these proteins has been tentatively identified (Table 3) by matching bottom-up derived protein identifications and elution profiles with the intact protein accurate masses and elution profiles, as illustrated in Figure 9. This hybrid analysis identified various classes of PTMs including oxidation, phosphorylation, methylation, as well as proteolytic processing events (Table 3).
Table 3.
Summary of results obtained for yeast proteasome using the integrated approach. Tentative identifications of proteins and modified proteins were accomplished by matching bottom-up data with the measured intact protein masses.
| ID | UniProt # | DESCRIPTION | Notes | Mtheo | Mexp | MMA (ppm) |
|---|---|---|---|---|---|---|
| 1 | YLR421C | 26S proteasome regulatory subunit RPN13 | 1 acetylation, 1 phsophorylation, loss of N-term 3 residues | 17674.62 | 17674.58 | −2.26 |
| YLR421C | 26S proteasome regulatory subunit RPN13 | 1 acetylation, 2 phsophorylation, loss of N-term 3 residues | 17754.58 | 17754.55 | −1.69 | |
| 2 | YDR382W | 60S acidic ribosomal protein P2β | 1 phsophorylation | 11129.36 | 11129.34 | −1.80 |
| 3 | YOL039W | 60S acidic ribosomal protein P2α | 1 phsophorylation | 10825.22 | 10825.19 | −2.77 |
| 4 | YOR362C | Proteasome component C1 | loss of N-term Met, Blocking of N-term Thr | N/A | 31740.47 | N/A |
| 5 | YBL041W | Proteasome component C5 | loss of N-term 12 residues | 25628.92 | 25628.91 | −0.39 |
| 6 | YHR200W | 26S proteasome regulatory subunit RPN10 | loss of N-term Met | 29615.84 | 29615.77 | −2.36 |
| 7 | YER012W | Proteasome component C11 | 1 acetylation | 22558.62 | 22558.60 | −0.89 |
| 8 | YGL011C | Proteasome component C7α | loss of N-term Met, 1 acetylation | 27911.20 | 27911.16 | −1.43 |
| 9 | YDR394W | 26S protease regulatory subunit 6B homolog | 1 acetylation | 47935.21 | 47935.19 | −0.42 |
| 10 | YML092C | Proteasome component Y7 | loss of N-term Met, 1 acetylation | 27072.08 | 27072.06 | −0.74 |
| 11 | YFR052W | 26S proteasome regulatory subunit RPN12 | loss of N-term Met | 31787.19 | 31787.16 | −0.94 |
| 12 | YMR314W | Proteasome component PRE5 | 1 acetylation | 25645.24 | 25645.24 | 0.00 |
| 13 | YGR135W | Proteasome component Y13 | loss of N-term Met, 1 acetylation | 28624.59 | 28624.57 | −0.70 |
| 14 | YDR427W | 26S proteasome regulatory subunit RPN9 | No Modification | 45782.85 | 45782.87 | 0.44 |
Figure 9.
Top: Heat map representation of protein elution patterns generated for the portion of the LC-MS analysis of yeast proteasome using tryptic peptides identified in each fraction. Relative protein abundances across fractions are based on normalized peptide observation counts (spectrum counting) and range from 0 (i.e. least abundant, green) to 1 (i.e. most abundant, red). The columns in the heat map represent the RPLC fraction number. Bottom: 2D display (mass vs. spectrum number or RPLC elution time) reconstructed from the intact protein LC-MS data. Insets show examples of proteins tentatively identified by matching bottom-up data with the accurate intact protein masses.
Our results agreed well with previous reports in regards to the N-terminal methionine truncation of several proteasomal components. For instance, initiator Met was cleaved from 26S proteasome regulatory subunits RPN10 and RPN12, while RPN9 showed neither removal of Met residue nor N-acetylation. 59 An intact mass of 11129.34 Da was identified as 60S acidic ribosomal protein P2β with 1 phosphorylation and with no N-terminal modification, in agreement with previously reported results.60 Similar results were found for 60S acidic ribosomal protein P2α. These acidic stalk proteins are the only ribosomal components for which there is a cytoplasmatic pool and which are present in multiple copies in each ribosome. 61 While these highly abundant cell proteins are likely to be nonspecific contaminants, a physiologically relevant interaction between proteasomes and ribosomes has been previously suggested. 62 Additionally, we were able to identify proteins with Mr >40 kDa. For instance, acetylated 26S protease regulatory subunit 6B homolog (Mr =47935.21 Da) was identified with MMA <1 ppm. These initial results support the feasibility of the integrated approach and its applicability for the characterization of larger proteins.
Conclusions
In response to the limited abilities of bottom-up approaches for identifying protein modifications and top-down approaches in terms of throughput, we developed an integrated top-down and bottom-up approach for comprehensive protein identification and profiling. This approach combines bottom-up analyses with accurate intact protein mass measurements to derive protein identity, and uses targeted top-down analyses to validate interesting protein targets. Bottom-up data are used to limit the search space, thus facilitating the discovery of unexpected modifications and/or amino acid substitutions. In an initial application with a mixture of standard proteins and yeast proteasome, the integrated approach enabled characterization of PTMs (e.g., acetylation, phosphorylation, heme-containing proteins) and genetic variants (e.g., SNP isoforms). Importantly, the unique ability of this approach for identifying (and potentially quantifying) distinctive protein isoforms (e.g., distinguish between one isoform with two SNPs and two isoforms each with a single SNP in the case of β-casein) was validated. The ability to characterize (i.e. identify and quantify) various protein variants could have a high impact in biomedical studies. For example, bioactive peptide β-casomorphin 7 (BCM-7), which is generated by successive gastrointestinal proteolytic digestion of bovine β-casein variants A1 and B, potentially plays a role in the etiology of a number of human diseases (e.g., cardiovascular diseases, type1 diabetes, sudden infant death syndrome, autism, and schizophrenia).63 The new integrated strategy can be readily applied to measure differential protein abundances, and provides a platform for high-throughput selection of biologically relevant targets for further characterization.
Acknowledgments
The authors thank Drs. Robert A Maxwell, Keqi Tang, Anil Shukla, and Rui Zhang for contributing to the improvement of instrumental capabilities and performance. Penny Colton is gratefully acknowledged for her helpful manuscript review. Portions of this work were supported by the National Center for Research Resources (RR 018522), the National Institute of Allergy and Infectious Diseases (NIH/DHHS through interagency agreement Y1-AI-4894-01), the National Institute of General Medical Sciences (NIGMS, R01 GM063883), and the U. S. Department of Energy (DOE) Office of Biological and Environmental Research. Work was performed in the Environmental Molecular Science Laboratory, a DOE national scientific user facility located on the campus of Pacific Northwest National Laboratory (PNNL) in Richland, Washington. PNNL is a multi-program national laboratory operated by Battelle for the DOE under Contract DE-AC05-76RLO 1830.
References
- 1.Domon B, Aebersold R. Mass Spectrometry and Protein Analysis. Science. 2006;312:212–217. doi: 10.1126/science.1124619. [DOI] [PubMed] [Google Scholar]
- 2.Yates JR. Mass spectral analysis in proteomics. Annu Rev Biophys Biomol Struct. 2004;33:297–316. doi: 10.1146/annurev.biophys.33.111502.082538. [DOI] [PubMed] [Google Scholar]
- 3.Aebersold R, Mann M. Mass spectrometry-based proteomics. Nature. 2003;422:198–207. doi: 10.1038/nature01511. [DOI] [PubMed] [Google Scholar]
- 4.Mann M, Hendrickson RC, Pandey A. Analysis of proteins and proteomes by mass spectrometry. Annu Rev Biochem. 2001;70:437–473. doi: 10.1146/annurev.biochem.70.1.437. [DOI] [PubMed] [Google Scholar]
- 5.Smith RD, Anderson GA, Lipton MS, Paša-Tolić L, Shen YF, Conrads TP, Veenstra TD, Udseth HR. An accurate mass tag strategy for quantitative and high-throughput proteome measurements. Proteomics. 2002;2:513–523. doi: 10.1002/1615-9861(200205)2:5<513::AID-PROT513>3.0.CO;2-W. [DOI] [PubMed] [Google Scholar]
- 6.Breuker K, Jin M, Han X, Jiang H, McLafferty FW. Top-down identification and characterization of biomolecules by mass spectrometry. J Am Soc Mass Spectrom. 2008;19:1045–53. doi: 10.1016/j.jasms.2008.05.013. [DOI] [PMC free article] [PubMed] [Google Scholar]
- 7.McLafferty FW, Breuker K, Jin M, Han XM, Infusini G, Jiang H, Kong XL, Begley TP. Top-down MS, a powerful complement to the high capabilities of proteolysis proteomics. FEBS Journal. 2007;274:6256–6268. doi: 10.1111/j.1742-4658.2007.06147.x. [DOI] [PubMed] [Google Scholar]
- 8.Siuti N, Kelleher NL. Decoding protein modifications using top-down mass spectrometry. Nat Methods. 2007;4:817–821. doi: 10.1038/nmeth1097. [DOI] [PMC free article] [PubMed] [Google Scholar]
- 9.Han XM, Jin M, Breuker K, McLafferty FW. Extending top-down mass spectrometry to proteins with masses greater than 200 kilodaltons. Science. 2006;314:109–112. doi: 10.1126/science.1128868. [DOI] [PubMed] [Google Scholar]
- 10.Du Y, Parks BA, Sohn S, Kwast KE, Kelleher NL. Top-down approaches for measuring expression ratios of intact yeast proteins using Fourier transform mass spectrometry. Anal Chem. 2006;78:686–694. doi: 10.1021/ac050993p. [DOI] [PubMed] [Google Scholar]
- 11.Bogdanov B, Smith RD. Proteomics by FTICR mass spectrometry: top down and bottom up. Mass Spectrom Rev. 2005;24:168–200. doi: 10.1002/mas.20015. [DOI] [PubMed] [Google Scholar]
- 12.Kelleher NL. Top-down proteomics. Anal Chem. 2004;76(11):196A–203A. [PubMed] [Google Scholar]
- 13.Reid GE, McLuckey SA. ‘Top down’ protein characterization via tandem mass spectrometry. J Mass Spectrom. 37:663–675. doi: 10.1002/jms.346. [DOI] [PubMed] [Google Scholar]
- 14.Ge Y, Lawhorn BG, ElNaggar M, Strauss E, Park JH, Begley TP, McLafferty FW. Top down characterization of larger proteins (45 kDa) by electron capture dissociation mass spectrometry. J Am Chem Soc. 2002;124:672–678. doi: 10.1021/ja011335z. [DOI] [PubMed] [Google Scholar]
- 15.Kelleher NL, Lin HY, Valaskovic GA, Aaserud DJ, Fridriksson EK, McLafferty FW. Top Down versus Bottom Up Protein Characterization by Tandem High-Resolution Mass Spectrometry. J Am Chem Soc. 1999;121:806–812. [Google Scholar]
- 16.Loo JA, Quinn JP, Ryu SI, Henry KD, Senko MW, McLafferty FW. High-Resolution Tandem Mass Spectrometry of Large Biomolecules. Proc Natl Acad Sci US A. 1992;89:286–289. doi: 10.1073/pnas.89.1.286. [DOI] [PMC free article] [PubMed] [Google Scholar]
- 17.Loo JA, Edmonds CG, Smith RD. Primary Sequence Information form Intact Proteins by Electrospray Ionization Tandem Mass Spectrometry. Science. 1990;248:201–204. doi: 10.1126/science.2326633. [DOI] [PubMed] [Google Scholar]
- 18.Henry KD, Williams ER, Wang B-H, McLafferty FW, Shabanowitz J, Hunt DF. Fourier-Transform Mass Spectrometry of Large Molecules by Electrospray Ionization. Proc Natl Acad Sci USA. 1989;86:9075–9078. doi: 10.1073/pnas.86.23.9075. [DOI] [PMC free article] [PubMed] [Google Scholar]
- 19.Garcia BA, Thomas CE, Kelleher NL, Mizzen CA. Tissue-specific expression and post-translational modification of histone H3 variants. J Proteome Res. 2008;7:4225–4236. doi: 10.1021/pr800044q. [DOI] [PMC free article] [PubMed] [Google Scholar]
- 20.Roth MJ, Parks BA, Ferguson JT, Boyne MT, Kelleher NL. Proteotyping”: population proteomics of human leukocytes using top down mass spectrometry. Anal Chem. 2008;80:2857–2866. doi: 10.1021/ac800141g. [DOI] [PMC free article] [PubMed] [Google Scholar]
- 21.Whitelegge JP, Zabrouskov V, Halgand F, Souda P, Bassilian S, Yan W, Wolinsky L, Loo JA, Wong DT, Faull KF. Protein-Sequence Polymorphisms and Post-translational Modifications in Proteins from Human Saliva using Top-Down Fourier-transform Ion Cyclotron Resonance Mass Spectrometry. Int J Mass Spectrom. 2007;268:190–197. doi: 10.1016/j.ijms.2007.08.008. [DOI] [PMC free article] [PubMed] [Google Scholar]
- 22.Zabrouskov V, Han XM, Welker E, Zhai HL, Lin C, van Wijk KJ, Scheraga HA, McLafferty FW. Stepwise deamidation of ribonuclease A at five sites determined by top down mass spectrometry. Biochemistry. 2006;45:987–992. doi: 10.1021/bi0517584. [DOI] [PMC free article] [PubMed] [Google Scholar]
- 23.Thomas CE, Kelleher NL, Mizzen CA. Mass spectrometric characterization of human histone H3: A bird’s eye view. J Proteome Res. 2006;5:240–247. doi: 10.1021/pr050266a. [DOI] [PubMed] [Google Scholar]
- 24.Roth MJ, Forbes AJ, Boyne MT, Kim YB, Robinson DE, Kelleher NL. Precise and parallel characterization of coding polymorphisms, alternative splicing, and modifications in human proteins by mass spectrometry. Mol Cell Proteomics. 2005;4:1002–1008. doi: 10.1074/mcp.M500064-MCP200. [DOI] [PMC free article] [PubMed] [Google Scholar]
- 25.Meng FY, Forbes AJ, Miller LM, Kelleher NL. Detection and localization of protein modifications by high resolution tandem mass spectrometry. Mass Spectrom Rev. 2005;24:126–134. doi: 10.1002/mas.20009. [DOI] [PubMed] [Google Scholar]
- 26.Forbes AJ, Patrie SM, Taylor GK, Kim YB, Jiang LH, Kelleher NL. Targeted analysis and discovery of posttranslational modifications in proteins from methanogenic archaea by top-down MS. Proc Natl Acad Sci US A. 2004;101:2678–2683. doi: 10.1073/pnas.0306575101. [DOI] [PMC free article] [PubMed] [Google Scholar]
- 27.Ge Y, El-Naggar M, Sze SK, Oh HB, Begley TP, McLafferty FW, Boshoff H, Barry CE. Top down characterization of secreted proteins from Mycobacterium tuberculosis by electron capture dissociation mass spectrometry. J Am Soc Mass Spectrom. 2003;14:253–261. doi: 10.1016/s1044-0305(02)00913-3. [DOI] [PubMed] [Google Scholar]
- 28.Fridriksson EK, Beavil A, Holowka D, Gould HJ, Baird B, McLafferty FW. Heterogeneous glycosylation of immunoglobulin E constructs characterized by top-down high-resolution 2-D mass spectrometry. Biochemistry. 2000;39:3369–3376. doi: 10.1021/bi9919091. [DOI] [PubMed] [Google Scholar]
- 29.Parks BA, Jiang L, Thomas PM, Wenger CD, Roth MJ, Boyne MT, Burke PV, Kwast KE, Kelleher NL. Top-down proteomics on a chromatographic time scale using linear ion trap Fourier transform hybrid mass spectrometers. Anal Chem. 2007;79:7984–7991. doi: 10.1021/ac070553t. [DOI] [PMC free article] [PubMed] [Google Scholar]
- 30.Zubarev RA, Kelleher NL, McLafferty FW. Electron capture dissociation of multiply charged protein cations. A nonergodic process. J Am Chem Soc. 1998;120:3265–3266. [Google Scholar]
- 31.Zubarev RA, Horn DM, Fridriksson EK, Kelleher NL, Kruger NA, Lewis MA, Carpenter BK, McLafferty FW. Electron capture dissociation for structural characterization of multiply charged protein cations. Anal Chem. 2000;72:563–573. doi: 10.1021/ac990811p. [DOI] [PubMed] [Google Scholar]
- 32.Cooper HJ, Håkansson K, Marshall AG. The role of electron capture dissociation in biomolecular analysis. Mass Spectrom Rev. 2005;24:201–222. doi: 10.1002/mas.20014. [DOI] [PubMed] [Google Scholar]
- 33.Xie YM, Zhang J, Yin S, Loo JA. Top-down ESI-ECD-FT-ICR mass spectrometry localizes noncovalent protein-ligand binding sites. J Am Chem Soc. 2006;128:14432–14433. doi: 10.1021/ja063197p. [DOI] [PubMed] [Google Scholar]
- 34.Zabrouskov V, Whitelegge JP. Increased coverage in the transmembrane domain with activated-ion electron capture dissociation for top-down Fourier-transform mass spectrometry of integral membrane proteins. J Proteome Res. 2007;6:2205–2210. doi: 10.1021/pr0607031. [DOI] [PubMed] [Google Scholar]
- 35.Syka JE, Coon JJ, Schroeder MJ, Shabanowitz J, Hunt DF. Peptide and protein sequence analysis by electron transfer dissociation mass spectrometry. Proc Natl Acad Sci US A. 2004;101:9528–9533. doi: 10.1073/pnas.0402700101. [DOI] [PMC free article] [PubMed] [Google Scholar]
- 36.Coon JJ, Ueberheide B, Syka JEP, Dryhurst DD, Ausio J, Shabanowitz J, Hunt DF. Protein identification using sequential ion/ion reactions and tandem mass spectrometry. Proc Natl Acad Sci US A. 2005;102:9463–9468. doi: 10.1073/pnas.0503189102. [DOI] [PMC free article] [PubMed] [Google Scholar]
- 37.McAlister GC, Berggren WT, Griep-Raming J, Horning S, Makarov A, Phanstiel D, Stafford G, Swaney DL, Syka JE, Zabrouskov V, Coon JJ. A proteomics grade electron transfer dissociation-enabled hybrid linear ion trap-orbitrap mass spectrometer. J Proteome Res. 2008;7:3127–3136. doi: 10.1021/pr800264t. [DOI] [PMC free article] [PubMed] [Google Scholar]
- 38.Taylor GK, Kim YB, Forbes AJ, Meng FY, McCarthy R, Kelleher NL. Web and database software for identification of intact proteins using “top down” mass spectrometry. Anal Chem. 2003;75:4081–4086. doi: 10.1021/ac0341721. [DOI] [PubMed] [Google Scholar]
- 39.LeDuc RD, Taylor GK, Kim YB, Januszyk TE, Bynum LH, Sola JV, Garavelli JS, Kelleher NL. ProSight PTM: an integrated environment for protein identification and characterization by top-down mass spectrometry. Nucleic Acids Res. 2004;32:W340–W345. doi: 10.1093/nar/gkh447. [DOI] [PMC free article] [PubMed] [Google Scholar]
- 40.Zamdborg L, LeDuc RD, Glowacz KJ, Kim YB, Viswanathan V, Spaulding IT, Early BP, Bluhm EJ, Babai S, Kelleher NL. ProSight PTM 2.0: improved protein identification and characterization for top down mass spectrometry. Nucleic Acids Res. 2007;35:W701–W706. doi: 10.1093/nar/gkm371. [DOI] [PMC free article] [PubMed] [Google Scholar]
- 41.Sharma S, Simpson DC, Tolić N, Jaitly N, Mayampurath AM, Smith RD, Paša-Tolić L. Proteomic profiling of intact proteins using WAX-RPLC 2-D separations and FTICR mass spectrometry. J Proteome Res. 2007;6:602–610. doi: 10.1021/pr060354a. [DOI] [PubMed] [Google Scholar]
- 42.Millea KM, Krull IS, Cohen SA, Gebler JC, Berger SJ. Integration of multidimensional chromatographic protein separations with a combined “Top-Down” and “Bottom-Up” proteomic strategy. J Proteome Res. 2006;5:135–146. doi: 10.1021/pr050278w. [DOI] [PubMed] [Google Scholar]
- 43.Simpson DC, Ahn S, Paša-Tolić L, Bogdanov B, Mottaz HM, Vilkov AN, Anderson GA, Lipton MS, Smith RD. Using size exclusion chromatography-RPLC and RPLC-CIEF as two-dimensional separation strategies for protein profiling. Electrophoresis. 2006;27:2722–2733. doi: 10.1002/elps.200600037. [DOI] [PMC free article] [PubMed] [Google Scholar]
- 44.VerBerkmoes NC, Bundy JL, Hauser L, Asano KG, Razumovskaya J, Larimer F, Hettich RL, Stephenson JL. Integrating “top-down” and “bottom-up” mass spectrometric approaches for proteomic analysis of Shewanella oneidensis. J Proteome Res. 2002;1:239–252. doi: 10.1021/pr025508a. [DOI] [PubMed] [Google Scholar]
- 45.Strader MB, VerBerkmoes NC, Tabb DL, Connelly HM, Barton JW, Bruce BD, Pelletier DA, Davison BH, Hettich RL, Larimer FW, Hurst GB. Characterization of the 70S ribosome from Rhodopseudomonas palustris using an integrated “top-down” and “bottom-up” mass spectrometric approach. J Proteome Res. 2004;3:965–978. doi: 10.1021/pr049940z. [DOI] [PubMed] [Google Scholar]
- 46.Lee SW, Berger SJ, Martinovic S, Paša-Tolić L, Anderson GA, Shen YF, Zhao R, Smith RD. Direct mass spectrometric analysis of intact proteins of the yeast large ribosomal subunit using capillary LC/FTICR. Proc Natl Acad Sci US A. 2002;99:5942–5947. doi: 10.1073/pnas.082119899. [DOI] [PMC free article] [PubMed] [Google Scholar]
- 47.Smallwood HS, Lourette NM, Boschek CB, Bigelow DJ, Smith RD, Paša-Tolić L, Squier TC. Identification of a denitrase activity against calmodulin in activated macrophages using high-field liquid chromatography - FTICR mass spectrometry. Biochemistry. 2007;46:10498–10505. doi: 10.1021/bi7009713. [DOI] [PubMed] [Google Scholar]
- 48.Shen Y, Tolic N, Masselon C, Paša-Tolić L, Camp DG, Hixson KK, Zhao R, Anderson GA, Smith RD. Ultrasensitive proteomics using high-efficiency on-line micro-SPE-NanoLC-NanoESI MS and MS/MS. Anal Chem. 2004;76:144–154. doi: 10.1021/ac030096q. [DOI] [PubMed] [Google Scholar]
- 49.Tolmachev AV, Robinson EW, Wu S, Kang H, Lourette NM, Paša-Tolić L, Smith RD. Trapped-ion cell with improved DC potential harmonicity for FT-ICR MS. J Am Soc Mass Spectrom. 2008;19:586–597. doi: 10.1016/j.jasms.2008.01.006. [DOI] [PMC free article] [PubMed] [Google Scholar]
- 50.Kelly RT, Page JS, Luo QZ, Moore RJ, Orton DJ, Tang KQ, Smith RD. Chemically etched open tubular and monolithic emitters for nanoelectrospray ionization mass spectrometry. Anal Chem. 2006;78:7796–7801. doi: 10.1021/ac061133r. [DOI] [PMC free article] [PubMed] [Google Scholar]
- 51.Eng JK, McCormack AL, Yates JR. An approach to correlate tandem mass-spectral data of peptides with amino-acid-sequences in a protein database. J Am Soc Mass Spectrom. 1994;5:976–989. doi: 10.1016/1044-0305(94)80016-2. [DOI] [PubMed] [Google Scholar]
- 52.Romine MF, Elias DA, Monroe ME, Auberry K, Fang RH, Fredrickson JK, Anderson GA, Smith RD, Lipton MS. Validation of Shewanella oneidensis MR-1 small proteins by AMT tag-based proteome analysis. OMICS: A Journal of Integrative Biology. 2004;8:239–254. doi: 10.1089/omi.2004.8.239. [DOI] [PubMed] [Google Scholar]
- 53.Washburn MP, Wolters D, Yates JR. Large-scale analysis of the yeast proteome by multidimensional protein identification technology. Nature Biotechnol. 2001;19:242–247. doi: 10.1038/85686. [DOI] [PubMed] [Google Scholar]
- 54.Monroe ME, Tolic N, Jaitly N, Shaw JL, Adkins JN, Smith RD. VIPER: an advanced software package to support high-throughput LC-MS peptide identification. Bioinformatics. 2007;23:2021–2023. doi: 10.1093/bioinformatics/btm281. [DOI] [PubMed] [Google Scholar]
- 55.Pesavento JJ, Garcia BA, Streeky JA, Kelleher NL, Mizzen CA. Mild performic acid oxidation enhances chromatographic and top down mass spectrometric analyses of histones. Mol Cell Proteomics. 2007;6:1510–1526. doi: 10.1074/mcp.M600404-MCP200. [DOI] [PubMed] [Google Scholar]
- 56.Brownlow S, Cabral JHM, Cooper R, Flower DR, Yewdall SJ, Polikarpov I, North ACT, Sawyer L. Bovine beta-lactoglobulin at 1.8 angstrom resolution - Still an enigmatic lipocalin. Structure. 1997;5:481–495. doi: 10.1016/s0969-2126(97)00205-0. [DOI] [PubMed] [Google Scholar]
- 57.Groves ML. Some minor components of casein and other phosphoproteins in milk. A review. Journal of Dairy Science. 1969;52:1155–1165. [Google Scholar]
- 58.Farrell HM, Jimenez-Flores R, Bleck GT, Brown EM, Butler JE, Creamer LK, Hicks CL, Hollar CM, Ng-Kwai-Hang KF, Swaisgood HE. Nomenclature of the proteins of cows’ milk - Sixth revision. Journal of Dairy Science. 2004;87:1641–1674. doi: 10.3168/jds.S0022-0302(04)73319-6. [DOI] [PubMed] [Google Scholar]
- 59.Kimura Y, Saeki Y, Yokosawa H, Polevoda B, Sherman F. N-terminal modifications of the 19S regulatory particle subunits of the yeast proteasome. Arch Biochem Biophys. 2003;409:341–348. doi: 10.1016/s0003-9861(02)00639-2. [DOI] [PubMed] [Google Scholar]
- 60.Arnold RJ, Polevoda B, Reilly JP, Sherman F. The action of N-terminal acetyltransferases on yeast ribosomal proteins. J Biol Chem. 1999;274:37035–37040. doi: 10.1074/jbc.274.52.37035. [DOI] [PubMed] [Google Scholar]
- 61.Nusspaumer G, Remacha M, Ballesta JP. Phosphorylation and N-terminal region of yeast ribosomal protein P1 mediate its degradation, which is prevented by protein P2. EMBO J. 2000;19:6075–6084. doi: 10.1093/emboj/19.22.6075. [DOI] [PMC free article] [PubMed] [Google Scholar]
- 62.Verma R, Chen S, Feldman R, Schieltz D, Yates J, Dohmen J, Deshaies RJ. Proteasomal proteomics: identification of nucleotide-sensitive proteasome-interacting proteins by mass spectrometric analysis of affinity-purified proteasomes. Mol Biol Cell. 2000;11:3425–3439. doi: 10.1091/mbc.11.10.3425. [DOI] [PMC free article] [PubMed] [Google Scholar]
- 63.Kaminski S, Cieslinska A, Kostyra E. Polymorphism of bovine beta-casein and its potential effect on human health. Journal of Applied Genetics. 2007;48(3):189–198. doi: 10.1007/BF03195213. [DOI] [PubMed] [Google Scholar]


