Abstract
Real-time three-dimensional ultrasound enables new intra-cardiac surgical procedures, but the distorted appearance of instruments in ultrasound poses a challenge to surgeons. This paper presents a detection technique that identifies the position of the instrument within the ultrasound volume. The algorithm uses a form of the generalized Radon transform to search for long straight objects in the ultrasound image, a feature characteristic of instruments and not found in cardiac tissue. When combined with passive markers placed on the instrument shaft, the full position and orientation of the instrument is found in 3D space. This detection technique is amenable to rapid execution on the current generation of personal computer graphics processor units (GPU). Our GPU implementation detected a surgical instrument in 31 ms, sufficient for real-time tracking at the 25 volumes per second rate of the ultrasound machine. A water tank experiment found instrument orientation errors of 1.1 degrees and tip position errors of less than 1.8 mm. Finally, an in vivo study demonstrated successful instrument tracking inside a beating porcine heart.
1 Introduction
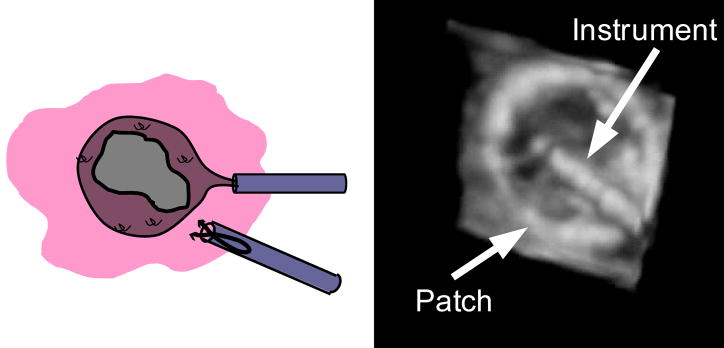
Real-time three-dimensional ultrasound has been demonstrated as a viable tool for guiding minimally invasive surgery [1]. For example, beating heart intracardiac surgery is now possible with the use of three-dimensional ultrasound and minimally invasive instruments [2]. These techniques eliminate the need for cardio-pulmonary bypass and its well documented adverse effects, including delay of neural development in children, mechanical damage produced by inserting tubing into the major vessels, stroke risk, and significant decline in cognitive performance [3–5]. Cannon et al. [1] showed that complex surgical tasks, such as navigation, approximation, and grasping are possible with 3D ultrasound. However, initial animal trials revealed many challenges to the goal of ultrasound guided intracardiac surgery [2]. In a prototypical intracardiac procedure, Atrial Septal Defect Closure, an anchor driver was inserted through the cardiac wall to secure a patch covering the defect (Figure 1). Surgeons found it difficult to navigate instruments with 3D ultrasound in the dynamic, confined intracardiac space. Tools look incomplete and distorted (Figure 1), making it difficult to distinguish and orient instruments.
Figure 1.
Schematic (A) and ultrasound image (B) of an atrial septal defect repair. In this procedure a patch is inserted into the heart to cover the atrial septal defect. An anchor driver is also inserted to attach the patch to the septum.
To address this issue, researchers are developing techniques to localize instruments in ultrasound. Enhancing the displayed position of the instrument can allow surgeons to more accurately control the instruments as they perform surgical tasks. In addition, real-time tracking of instruments in conjunction with a surgical robot opens the door for a range of enhancements, such as surgical macros, virtual fixtures, and other visual servoing techniques [6; 7].
Previous work in instrument detection can be broadly separated into two categories: external tracking systems such as electromagnetic and optical tracking [8; 9] and image-based detection algorithms [10–13]. External tracking systems have suffered from the limitations of the surgical environment. Electromagnetic tracking has limited accuracy and is problematic to implement due to the abundance of ferro-magnetic objects in the operating room. Optical tracking of instruments is complicated by line-of-sight requirements. Both of these systems suffer from errors introduced by improper registration of the ultrasound image coordinates to the tracking coordinate frame. To eliminate such errors, image based algorithms are used to track instruments within the ultrasound image. Most of this work focused on tracking needles [10–12] and more recently surgical graspers [13] in 2D ultrasound images. As 3D ultrasound systems have become widely available, these 2D techniques have been adapted for implementation in 3D. An appealing approach to instrument localization is the Radon or Hough transforms. These techniques have wide spread use in 2D image analysis for detection of a variety of shapes. Applications of these techniques have focused on detecting 2D objects in 2D images, however, Hough and Radon based techniques have shown promise in 3D medical image analysis. Most relevant is a needle tracking technique for prostate biopsy [14] that projects the ultrasound volume onto two orthogonal planes. A Hough transform is then performed on the two 2D images to identify the needle.
Beating heart intracardiac procedures pose different challenges and requirements than the 2D breast and prostate biopsy procedures in previous work. For example, the high data rates of 3D ultrasound machines, 30–40 MB/s, require very efficient algorithms for real-time implementation. Previous 2D ultrasound techniques are too computationally costly, or inappropriate for three dimensions. These methods are only appropriate for finding bright objects such as needles in ultrasound images that standout amongst relatively homogeneous tissue. In cardiac procedures, larger instruments such as anchor drivers and graspers are used that do not stand out amongst the surrounding dynamic, heterogeneous environment. To work in this environment, the algorithm must be efficient for handling the large data rates, and capable of distinguishing instruments from fast moving cardiac structures of similar intensity.
In this work we present a technique capable of detecting instruments used in minimally invasive procedures, such as endoscopic graspers, staplers, and cutting devices. Instruments used in these procedures are fundamentally cylindrical in shape and typically 3–10 mm in diameter, a feature that is not found in cardiac tissue. We use a form of the Radon transform to identify these instruments within the ultrasound volumes. In the following sections we describe a generalization of the Radon transform that is appropriate for identifying instrument shafts in 3D ultrasound volumes. Furthermore, we show that this technique can be implemented on a parallel architecture such as inexpensive PC graphics hardware, enabling the detection of instruments in real-time. The proposed method is examined in both tank studies and an in vivo animal trial.
2 Methods and Materials
2.1 The Radon Transform
The Radon and Hough Transforms are widely used for detecting lines in two dimensional images. In its original formulation [15], the Radon transform maps an image, I, into the Radon space R {I}
| (1) |
d and φ define a line in two dimensions by its perpendicular distance to the origin and slope, respectively. This method transforms a difficult image processing problem into simply identifying maximums in the Radon space. In its original formulation, the Radon transform is unsuitable for instrument tracking in 3D, but has been extended for identification of arbitrary shapes [16]. Using the notation introduced by Luengo Hendriks et al. [17], points on a parametric shape are defined by the function c (s, p) where p defines the parameters of the shape, and s is a free parameter that corresponds to a specific point on the shape. In this framework, the Radon transform is rewritten as
| (2) |
A line segment in 3D is parameterized with 6 variables. (x0, y0, z0) defines the center of the line segment in 3D. Two angular parameters (θ, φ) describe its orientation, and L defines its length. More compactly, these 6 parameters are written as
| (3) |
Points lying on a line segment are now defined for p and s as
| (4) |
Combining Equation 4 and Equation 2 yields a form of the generalized Radon transform for line segments in 3D volumes
| (5) |
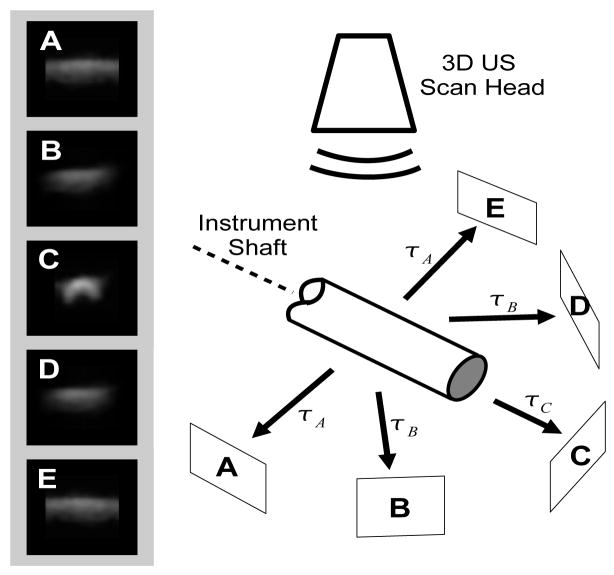
Identifying lines in the 3D volume now becomes a problem of finding local maximums of Rc (s, p){I} (p), from Equation 5, where p denotes a local maximum or likely instrument position. In other words, we integrate the image volume, I, along a direction defined by (θ, φ), through the point (x0, y0, z0) and identify maximums. This scheme is illustrated in Figure 2 where integrations are illustrated for multiple directions. Figure 2c contains points with a high integral, or simply, the image is brighter than the other four images (Figure 2a, 2b, 2d, and 2e). This is a result of the correspondence of the integration direction and the object’s axis. As a result, by finding the maximum value of Rc (s, p){I} (p), the axis of the instrument in 3D space is implicitly defined by the parameters p.
Figure 2.
Example of the Radon transform detection of the instrument axis. Each image (A–E) is a projection of the ultrasound image along the corresponding direction shown in the schematic. The projection is along the axis of the instrument (C) is the brightest. Note that this diagram omits out-of-plane projections that are part of the implementation.
2.1.1 Graphics Card Implementation
One of the most promising features of the Radon transform approach described above is the potential for real-time computation. Equation 5 can be independently calculated for each [x0, y0, z0, θ, φ, L] and is ideally suited for computation on parallel architectures; current personal computer graphics cards are built with features well-suited for this application. Many researchers have shown that highly parallel calculations, when implemented on these graphics processor unit (GPU) cards, show significant performance advantages over CPU based implementations [18–20]. Using a similar approach, we programed a PC graphics card (7800GTX, nVidia Corp., Santa Clara, CA) to calculate the necessary integrations, Rc (s, p){I} (p).
Before the algorithm is executed, data is transferred to the GPU: the sequential values of p to be searched are preloaded into five textures in the GPU memory, where each texture corresponds to each parameter [x0, y0, z0, θ, φ]. The three-dimensional ultrasound data is loaded onto the graphics card into a three-dimensional texture. Once the data is loaded, the algorithm runs by ‘rendering’ to a output texture. Sixteen parallel pipelines on the graphics card (programmable pixel shaders) calculate the integral defined in Equation 5 by stepping through the volume for sixteen integrations simultaneously. The pixel shaders perform the integrations for each input parameter set defined in the input textures, and output the results to the corresponding position in the output texture. Tri-linear interpolation, implemented in hardware, is used as each pixel shader integrates the image intensity in the volume along the direction defined by (θ, φ) through the point (x0, y0, z0). The output texture is then transferred back to main memory for post-processing by the CPU. On the CPU, the maximum intensity in the output texture is identified as the instrument axis position.
2.1.2 Passive Markers
Once the axis of the instruments is found, it is necessary to detect the final two degrees of freedom of the instrument (tip position and roll angle) to fully define its position and orientation. To this end, we build on work first introduced by Stoll et al. [21]. Here we use a new marker design, shown in Figure 3. To produce distinct elements, 800 μm polyurethane foam was wrapped around the instrument shaft as shown in Figure 3. Uncoated metals such as the stainless steel used for surgical instruments are highly reflective in ultrasound. Huang et al. [22] showed that uncoated metal instruments that were more than 20 degrees from perpendicular to the ultrasound probe reflected almost no ultrasound energy back to the ultrasound probe. To ensure that the instrument is visible in ultrasound, a more diffusive interaction with the ultrasound pulse is desired. As a result, an 80 μm fiberglass embedded PTFE coating was applied to the instrument in order to improve the appearance.
Figure 3.
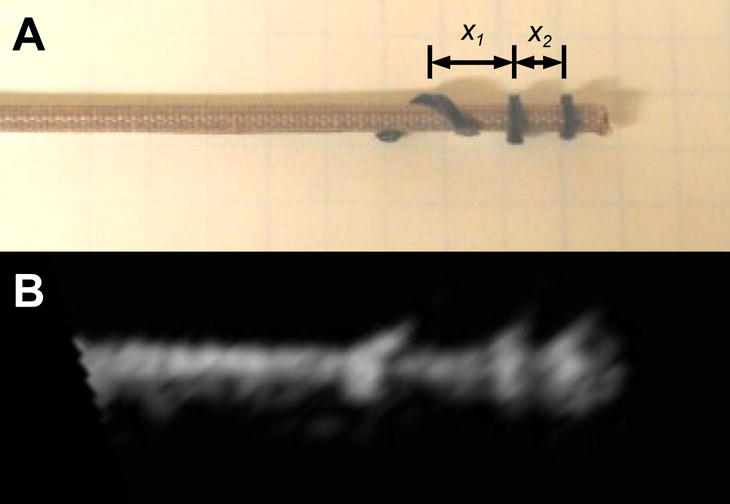
Picture (A) and ultrasound image (B) of a minimally invasive anchor driver with passive markers. The instrument tip and roll angle is calculated using the distances x1 and x2.
Finding the markers begins with the image volume already loaded into texture memory from the Radon transform algorithm, then the built-in tri-linear interpolation is used to quickly render a slice through the instrument axis, orientated so that the instrument axis is horizontal. To identify the position of the bumps, a template matching algorithm is used on the ultrasound slice. The algorithm uses the sum of the absolute differences between a candidate region of the slice and a template, shown in Figure 4.
Figure 4.
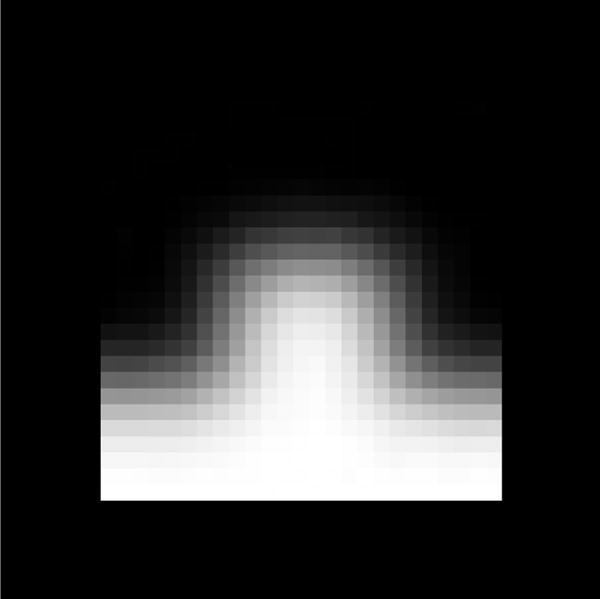
Passive marker template used to identify the location of the three markers on the instrument.
The positions of the three best matches found in the slice are used to determine the tip position of the instrument and the roll angle (Figure 5). The tip position is found with a known offset of 3 mm between the two closest markers and the instrument tip. To find the roll angle, the ratio of the distances x1 and x2 is used (Figure 3). Since the third marker is wrapped in a helical pattern around the instrument shaft, the roll angle is a linear function of this ratio.
Figure 5.
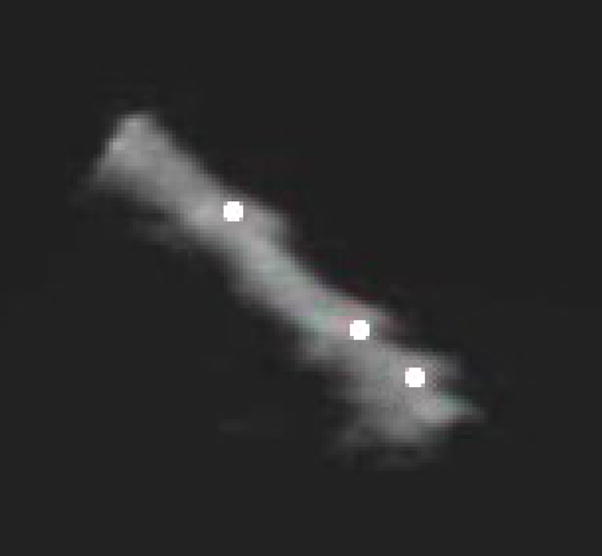
3D Ultrasound image of an instrument with white dots indicating tracked passive markers.
2.1.3 System Architecture
For instrument tracking, the ultrasound data is produced by a Sonos 7500 ultrasound system (Philips Medical, Andover, MA). The ultrasound volumes are streamed from the ultrasound machine to a personal computer over a gigibit LAN using TCP/IP. The data stream is captured on the target PC and passed to the instrument tracking algorithm running in a separate asynchronous thread. The tracking algorithm calculates the modified Radon transform on the graphics processing unit (7800GTX, nVidia Corp, Santa Clara, CA) using DirectX 9.0c. The entire system runs on a Pentium 4 3 GHz personal computer with 2 GB of RAM.
For the first ultrasound volume, Equation 5 is calculated for evenly spaced points throughout the volume space I. Spatially, the volume is sampled at 5 voxel increments in x, y, and z. For angles θ and φ, Equation 5 is sampled in 10 degree increments. Due to symmetry, the angles are only sampled from 0 to 180 degrees. This search constitutes the initialization of the instrument tracking, as the entire volume is searched for the instrument. For 148×48×208 voxel volumes, this results in 408,000 iterations of Equation 5.
For subsequent frames, the tracking algorithm confines its search space to an area centered on the location found in the previous frame. Since the ultrasound volumes are updated at 25–28 Hz, this search space can be fairly small. In our trials, we empirically found that limiting the search space to ±5 voxels spatially in the x, y, and z directions and ±10 degrees around the angles θ and φ found in the previous frame was sufficient to capture typical surgical movements.
2.2 Experimental Validation
To validate the proposed methodology, two sets of experiments were conducted. The first trial measured the accuracy of the algorithm by imaging instruments in a controlled tank environment. While this study carefully characterized the accuracy of the method, it does not reflect the target conditions for the algorithm, detecting instruments within a beating heart. As a result, a second study was necessary to validate the effectiveness of the technique in a surgical setting.
2.2.1 Tank Study
The accuracy of the proposed method was measured with a system that precisely positioned and oriented the instruments within the ultrasound field. The instruments were connected to a three-axis translational stage with 1 μm resolution, and 2 rotational stages with a resolution of 5 minutes. Registration to the ultrasound coordinates was done by using a flat-plate phantom and two-wire phantom [23]. Registration accuracy was 0.4 mm for positions and 0.6 degrees for angular measurements.
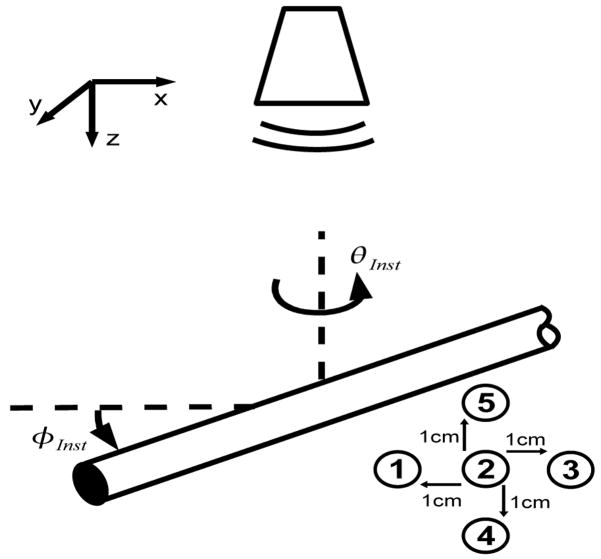
A series of ultrasound images were taken by varying the orientation angles of the instrument (φInst). As shown in Figure 6, this angle refers to rotations about the x axis of the ultrasound image, identical to φ defined in the modified Radon transform (Equation 5). φInst ranged from 0 to 60 degrees in 5 degree increments. It was physically not possible to image the instrument beyond 60 degrees because of the size of the field of view and dimensions of the ultrasound probe. This constraint exists in surgical situations also and therefore orientations beyond 60 degrees were not considered in this study. At each angular orientation, the instrument was imaged in five different positions within the ultrasound field. The first position had the instrument tip in the center of the image, and the other four positions were each 1 cm from this initial center position in the axial direction lateral directions (Figure 6). As a result, 5 images were taken for each φinst.
Figure 6.
In the tank study instruments were imaged at different φInst. Images were taken of the instrument at five positions for each orientation.
2.2.2 In Vivo Animal Study
Second, in vivo validation was performed by tracking an instrument within a beating porcine heart. The instruments were imaged inside a porcine heart during an open chest beating heart procedure. The instruments were inserted through ports in the right atrial wall and secured by purse-string sutures. The ultrasound probe was positioned epicardially on the right atrium to give a view of the right and left atrium. The surgeon was instructed to move the instrument toward the atrial septum. During this movement, the instrument tip position calculated by the algorithm and recorded to a data file. Electromagnetic tracking (miniBIRD 800, Ascension Technology, Burlington, VT) was used to simultaneously track the instrument tip position.
3 Results
The results of the tank studies demonstrate the accuracy of the method. In Figure 7, the angular accuracy of the method is shown for different orientations of the instrument with respect to the ultrasound probe. Figure 7 shows that for angles from 0 to 60 degrees of φ, the instrument tracking algorithm accurately determined its orientation. Across all trials, the RMS difference of the angle calculated by the tracking algorithm and the angle measured by the testing setup was 1.07 degrees. There was no dependence on the accuracy of the algorithm and the orientation of the instrument.
Figure 7.
The plot shows the mean angle φinst calculated by the tracking algorithm for all 5 position. Errors bar indicate standard deviation, and dashed line shows equality.
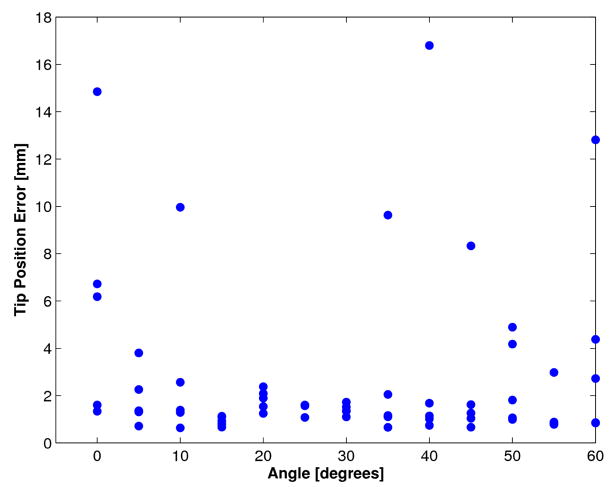
The tip position was also tracked with the algorithm in the tank study. The tip position was compared to the actual tip position recorded by the 5-axis positioning stage. The results are shown in Figure 8 for each orientation angle. Each data point corresponds to one of the five positions of the instrument and orientation angle. It was found that the tip position accuracy was extremely dependent on the accuracy of the passive marker identification algorithm. When the algorithm correctly identified the positions of the three passive markers, the tip position had an RMS error of 1.8 mm. However for eight of the trials, the algorithm mis-identified the marker location. As a result, the tip position error was greater than 5 mm.
Figure 8.
Tip position accuracy from tank trials. The distance from the tip position calculated by tracking algorithm to actual tip position is shown for each angle φinst.
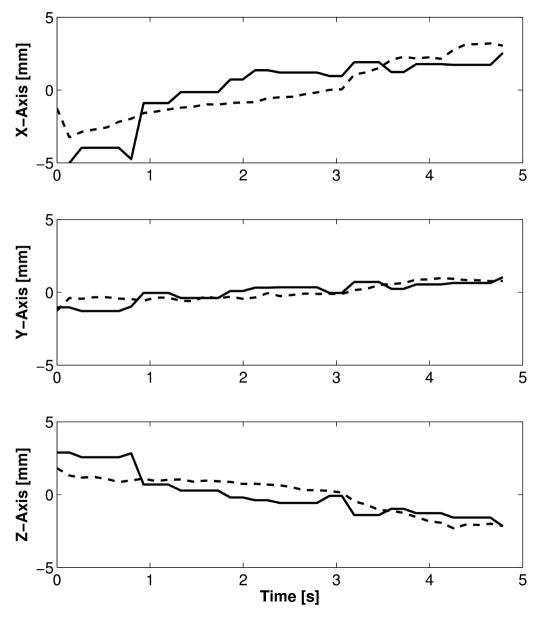
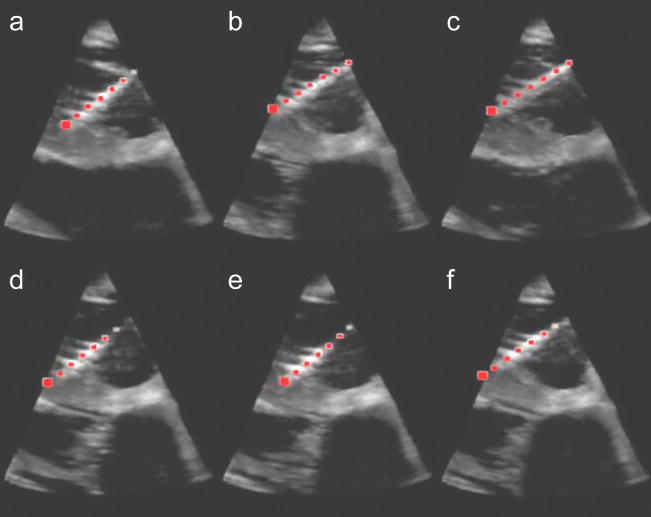
Figure 9 shows the results of the in vivo trials. The figure plots the x, y, and z trajectories of the instrument tip versus time. Both the instrument tip position reported by the instrument tracking algorithm and the electromagnetic trackers is shown. The tracking method correctly tracked the instrument tip as the surgeon moved it for 5 s. The RMS difference between the tip position reported by the electromagnetic tracker and tracking algorithm was 1.4 mm, 0.5 mm, and 0.9 mm in x, y, and z directions. Figure 10 graphically shows the results of the instrument tracking in a beating porcine heart. The figure shows an overlay of the tracked instrument position on the 3D ultrasound volume over 5 seconds. For each of the images, the overlay correctly matches the position of the instrument as the heart beats around it.
Figure 9.
In vivo x, y, and z position of the instrument tip as reported by an electromagnetic tracker (dashed line) and the tracking algorithm (solid line).
Figure 10.
Ultrasound images of the instrument inside a beating porcine heart. The red dots indicate the instrument position calculated by the tracking algorithm. Each image (A–F) are images taken each second for 6 seconds.
In our experimental setup, the instrument tracking technique required 1.7 s to initially detect the instrument in the entire ultrasound volume. For subsequent tracking, the algorithm required 32 ms per volume. This speed is well within the 38 ms required for the algorithm to keep pace with the 25 volumes per second generated by the ultrasound machine. This performance is a significant improvement over implemention on a CPU. When running the same algorithm on a CPU (Pentium 4, 3 Ghz), the algorithm took 11.7 s for the initial detection and 0.54 s for subsequent tracking of the instrument. As a result, the GPU based tracking approach is 14 times faster than a CPU based approach.
4 Discussion
This paper demonstrates for the first time real-time tracking of surgical instruments in intra cardiac procedures with 3DUS. The algorithm was both capable of distinguishing instruments from fast-moving cardiac structures and efficient enough to work in real-time. The generalized Radon transform is effective here because it integrates over the length of the instrument shaft to minimize the effects of noise and spatial distortion in ultrasound images. By taking advantage of the unique shape of surgical instruments, we were able to correctly distinguish instruments from cardiac structures of similar intensity. The Radon transform was also selected because of its amenability to parallel implementation, which was exploited by using GPUs to achieve real-time performance. As a result, it was possible to detect an instrument in the ultrasound volume in 32 ms, which is sufficient to handle the 25 volumes per second produced by the ultrasound machine.
The approach demonstrated good performance in both tank trials and an in vivo study. These studies accomplished two separate and complimentary goals. The tank trials permitted rigorous exploration of the accuracy of the technique in a controlled environment with precision that is not possible in a surgical setting. The in vivo trials, on the other hand, tested the technique’s ability to correctly distinguish an instrument from tissue in the presence of highly dynamic aberrations and clutter typical of cardiac ultrasound imaging. Rigorously characterizing accuracy is difficult in this setting, due to the limited range of instrument motion and access to the intracardiac space.
The tank experiments showed that the Radon transform algorithm is very accurate. Across all the trials, it correctly identified the orientation of the instrument to within 1 degree. By adding passive markers, the full 6 degree of freedom tracking was possible. This is of importance to surgical applications because it enables instrument tip tracking. For most cases, the accuracy of the technique was within 1.8 mm. However, as seen in Figure 8, the marker detection algorithm sometimes incorrectly identifies the position of the passive markers. As a result, the tip position is incorrectly calculated along the shaft axis. While not the focus of this work, the passive marker detection and tracking is being studied by parrallel efforts by Stoll et al. [21]. Integration of improved passive marker tracking with the Radon based shaft tracking presented here, will be addressed in future work. In vivo trials provided verification of the effectiveness of the algorithm when instruments are surrounded by blood and highly inhomogeneous and rapidly moving tissue. The electromagnetic tracking used for verification is by no means a “gold standard”; however, the data showed the tracking technique presented here is in fact following the surgical instrument with reasonable accuracy (Figure 10).
With real-time instrument tracking techniques, it is now possible to introduce guidance enhancements to aid in our target procedures, intracardiac surgery. Real-time tracking can now be used for instrument overlays and navigational aids to help the surgeon deal with the distorted appearance of tissue and instruments in 3DUS images. In addition, tracking of instruments opens a wide range of possibilities for implementing robot control under 3DUS guidance.
Footnotes
Publisher's Disclaimer: This is a PDF file of an unedited manuscript that has been accepted for publication. As a service to our customers we are providing this early version of the manuscript. The manuscript will undergo copyediting, typesetting, and review of the resulting proof before it is published in its final citable form. Please note that during the production process errors may be discovered which could affect the content, and all legal disclaimers that apply to the journal pertain.
Bibliography
- 1.Cannon JW, Stoll JA, Salgo IS, Knowles HB, Howe RD, Dupont PE, Marx GR, del Nido PJ. Real-time three-dimensional ultrasound for guiding surgical tasks. Computer Aided Surgery. 2003;8:82–90. doi: 10.3109/10929080309146042. [DOI] [PubMed] [Google Scholar]
- 2.Suematsu Y, Marx GR, Stoll JA, DuPont PE, Cleveland RO, Howe RD, Triedman JK, Mihaljevic T, Mora BN, Savord BJ, Salgo IS, del Nido PJ. Three-dimensional echocardiography-guided beating-heart surgery without cardiopulmonary bypass: a feasibility study. The Journal of Thoracic and Cardiovascular Surgery. 2004;128:579–587. doi: 10.1016/j.jtcvs.2004.06.011. [DOI] [PubMed] [Google Scholar]
- 3.Murkin JM, Boyd WD, Ganapathy S, Adams SJ, Peterson RC. Beating heart surgery: why expect less central nervous system morbidity? The Annals of Thoracic Surgery. 1999;68:1498–1501. doi: 10.1016/s0003-4975(99)00953-4. [DOI] [PubMed] [Google Scholar]
- 4.Zeitlhofer J, Asenbaum S, Spiss C, Wimmer A, Mayr N, Wolner E, Deecke L. Central nervous system function after cardiopulmonary bypass. European Heart Journal. 1993;14:885–890. doi: 10.1093/eurheartj/14.7.885. [DOI] [PubMed] [Google Scholar]
- 5.Bellinger DC, Wypij D, Kuban KC, Rappaport LA, Hickey PR, Wernovsky G, Jonas RA, Newburger JW. Developmental and neurological status of children at 4 years of age after heart surgery with hypothermic circulatory arrest or low-flow cardiopulmonary bypass. Circulation. 1999;100:526–532. doi: 10.1161/01.cir.100.5.526. [DOI] [PubMed] [Google Scholar]
- 6.Kragic D, Marayong P, Li M, Okamura A, Hager G. Human-machine collaborative systems for microsurgical applications. International Journal of Robotics Research. 2005;24:731–741. [Google Scholar]
- 7.Park Shinsuk, Howe Robert D, Torchiana David F. Virtual fixtures for robotic cardiac surgery; Proceedings of the 4th International Conference on Medical Image Computing and Computer-Assisted Intervention, Lecture Notes In Computer Science; 2001. pp. 1419–1420. [Google Scholar]
- 8.Leotta DF. An efficient calibration method for freehand 3-d ultrasound imaging systems. Ultrasound in Medicine and Biology. 2004;30:999–1008. doi: 10.1016/j.ultrasmedbio.2004.05.007. [DOI] [PubMed] [Google Scholar]
- 9.Lindseth F, Tangen GA, Lango T, Bang J. Probe calibration for freehand 3-d ultrasound. Ultrasound in Medicine and Biology. 2003;29:1607–1623. doi: 10.1016/s0301-5629(03)01012-3. [DOI] [PubMed] [Google Scholar]
- 10.Draper K, Blake C, Gowman L, Downey D, Fenster A. An algorithm for automatic needle localization in ultrasound-guided breast biopsies. Medical Physics. 2000;27:1971–1979. doi: 10.1118/1.1287437. [DOI] [PubMed] [Google Scholar]
- 11.Novotny P, Cannon J, Howe R. Tool localization in 3d ultrasound images. Proceedings of the 6th International Conference on Medical Image Computing and Computer-Assisted Intervention, Lecture Notes In Computer Science. 2003;2879:969–970. [Google Scholar]
- 12.Zhouping W, Gardi L, Downey D, Fenster A. Oblique needle segmentation for 3d trus-guided robot-aided transperineal prostate brachytherapy; 2nd IEEE International Symposium on Biomedical Imaging: Macro to Nano; 2004. p. 960. [Google Scholar]
- 13.Ortmaier T, Vitrani M, Morel G, Pinault S. Robust real-time instrument tracking in ultrasound images for visual servoing; Proceedings of the 2005 IEEE International Conference on Robotics and Automation; 2005. pp. 2167–2172. [Google Scholar]
- 14.Ding M, Fenster A. A real-time biopsy needle segmentation technique using hough transform. Medical Physics. 2003;30:2222–2233. doi: 10.1118/1.1591192. [DOI] [PubMed] [Google Scholar]
- 15.Radon J. Berichte Sachsische Akademie der Wissenschaften. Vol. 69. Leipzig: Mathematisch-Physikalische Klasse; 1917. Uber die bestimmung von funktionen durch ihre integralwerte langs gewisser mannigfaltigkeiten ; pp. 262–277. [Google Scholar]
- 16.Gel’fand IM, Shilov GE. Generalized functions. volume 5, integral geometry and representation theory. Academic Press; 1966. [Google Scholar]
- 17.Luengo Hendriks CL, Van Ginkel M, Verbeek PW, Van Vliet LJ. The generalized radon transform: sampling, accuracy and memory considerations. Pattern Recognition. 2005;38:2494–2505. [Google Scholar]
- 18.Enhua Wu, Youquan Liu, Xuehui Liu. An improved study of real-time fluid simulation on gpu. Computer Animation & Virtual Worlds. 2004;15:139–146. [Google Scholar]
- 19.Oh Kyoung-Su, Jung Keechul. Gpu implementation of neural networks. Pattern Recognition. 2004;37:1311–1314. [Google Scholar]
- 20.Kruger J, Westermann R. Acceleration techniques for gpu-based volume rendering. IEEE Visualization 2003. 2003:287–292. [Google Scholar]
- 21.Stoll J, Dupont P. Passive markers for ultrasound tracking of surgical instruments. Proceedings of the 8th International Conference on Medical Image Computing and Computer-Assisted Intervention, Lecture Notes In Computer Science. 2005;3750:41–48. doi: 10.1007/11566489_6. [DOI] [PubMed] [Google Scholar]
- 22.Huang J, Dupont PE, Undurti A, Triedman JK, Cleveland RO. Producing diffuse ultrasound reflections from medical instruments using a quadratic residue diffuser. Ultrasound in Medicine and Biology. 2006;32:721–727. doi: 10.1016/j.ultrasmedbio.2006.03.001. [DOI] [PubMed] [Google Scholar]
- 23.Prager RW, Rohling RN, Gee AH, Berman L. Rapid calibration for 3-d freehand ultrasound. Ultrasound in Medicine and Biology. 1998;24:855–869. doi: 10.1016/s0301-5629(98)00044-1. [DOI] [PubMed] [Google Scholar]


