

Abstract
The barn owl's central auditory system creates a map of auditory space in the external nucleus of the inferior colliculus (ICX). Although the crucial role visual experience plays in the formation and maintenance of this auditory space map is well established, the mechanism by which vision influences ICX responses remains unclear. Surprisingly, previous experiments have found that in the absence of extensive pharmacological manipulation, visual stimuli do not drive neural responses in the ICX. Here we investigated the influence of dynamic visual stimuli on auditory responses in the ICX. We show that a salient visual stimulus, when coincident with an auditory stimulus, can modulate auditory responses in the ICX even though the same visual stimulus may elicit no neural responses when presented alone. For each ICX neuron, the most effective auditory and visual stimuli were located in the same region of space. In addition, the magnitude of the visual modulation of auditory responses was dependent on the context of the stimulus presentation with novel visual stimuli eliciting consistently larger response modulations than frequently presented visual stimuli. Thus the visual modulation of ICX responses is dependent on the characteristics of the visual stimulus as well as on the spatial and temporal correspondence of the auditory and visual stimuli. These results demonstrate moment-to-moment visual enhancements of auditory responsiveness that, in the short-term, increase auditory responses to salient bimodal stimuli and in the long-term could serve to instruct the adaptive auditory plasticity necessary to maintain accurate auditory orienting behavior.
INTRODUCTION
Throughout the CNS, neural circuits typically receive input from multiple, independent sources of information. For example, inputs may converge from different sensory modalities or from circuits both higher and lower in processing hierarchies. In many cases, each source of input is able to drive spike activity independently, and therefore the output of the circuit represents the combination of information from each source (Kohler et al. 2002; Meredith and Stein 1986). In other cases, sources of input modulate neural responsiveness even though they cannot drive neural activity effectively on their own (King and Palmer 1985; Reynolds and Chelazzi 2004). Modulating inputs have been observed, for example, in association with attention, expectation, and changes in behavioral state (Driver and Noesselt 2008). The full range of functions that these inputs serve remains unknown. The barn owl's inferior colliculus (ICX) contains an auditory circuit for which a functional role of visual input is known: visual input instructs the tuning of ICX neurons to auditory localization cues, (Brainard and Knudsen 1993) even though visual stimuli alone are ineffective in driving action potentials (Gutfreund et al. 2002).
The ICX is a critical node in the midbrain pathway that translates information about auditory spatial cues into signals for controlling orienting behavior (Knudsen 2002). In barn owls, this pathway combines auditory spatial information that is contained in frequency-specific channels in the central nucleus of the inferior colliculus (ICC) to create a single topographic representation of auditory space. This auditory space map is transmitted to the optic tectum (OT; the avian equivalent of the mammalian superior colliculus), where it merges with a visual map of space to form a mulitmodal map of space. Output from the OT directs an animal's gaze and attention toward salient stimuli (du Lac and Knudsen 1990; Muller et al. 2005).
An owl must interpret several distinct auditory spatial cues correctly to direct its gaze accurately toward an auditory stimulus. The relationships between encoded values of auditory spatial cues, such as interaural time differences (ITDs) and interaural level differences (ILDs), and the locations in space that produce them change with growth during development and as a result of normal ageing processes. Owls, which depend on precise sound localization for hunting, maintain an accurate auditory space map by continuously calibrating representations of ITD and ILD based on experience with bimodal stimuli (Bergan et al. 2005; Knudsen 1998; Linkenhoker and Knudsen 2002). For example, when owls wear prismatic spectacles that displace the visual field horizontally, ITD and ILD values are reinterpreted in a manner that accounts for the displaced visual field and restores alignment between auditory and visual space maps in the OT (Knudsen and Brainard 1991). The underlying neural plasticity occurs largely in the ICX and involves growth of new axonal projections as well as changes in the pharmacology of excitation and the pattern of inhibition (DeBello et al. 2001; Feldman et al. 1996; Zheng and Knudsen 1999).
The visual template that instructs auditory plasticity in the ICX originates in the OT. Depriving the ICX of this template, by placing an electrolytic lesion in the deep layers of the OT, results in a loss of visually guided plasticity in the ICX specifically for the location represented at the site of the OT lesion (Hyde and Knudsen 2002). Visual input from the OT to the ICX has been previously revealed by blocking inhibition in the OT with bicuculline, a GABAA receptor antagonist (Gutfreund et al. 2002). This pharmacological manipulation induces strong responses to visual stimuli in corresponding regions of the ICX space map—responses that are not seen without blocking inhibition. These data suggest that visual instructive signals to the ICX are gated by inhibition at the level of the OT, and, normally, these visual signals do not have access to the ICX (Gutfreund et al. 2002).
Consistent with the interpretation in the preceding text, we found that visual stimuli, when presented alone, elicited little or no response in the ICX. However, we also found that specific categories of visual stimuli, when presented synchronously with an auditory stimulus, dramatically enhance ICX responses to an auditory stimulus. The enhanced representation of bimodal stimuli was particularly strong when the visual stimulus was rare, moved, or loomed. When viewed in the context of the data described above, the visual enhancement of auditory responses may serve the dual purposes of selecting particular auditory responses for attention and for guiding adaptive auditory plasticity.
METHODS
Animals
Sixteen adult barn owls were housed in large flight aviaries containing four or five individuals. Birds were cared for in accordance with the National Institutes of Health Guide for the Care and Use of Laboratory Animals as well as the Stanford University Institutional Animal Care and Use Committee.
Prior to electrophysiological recordings, owls were anesthetized with 1% halothane mixed with nitrous oxide and oxygen (45:55). A stainless steel fastener was attached to the rear of the skull with dental acrylic, and a craniotomy was opened dorsal to the ICX, based on stereotaxic coordinates. Owls were allowed to recover for ≥1 wk before electrophysiological recordings began.
Stimuli
Auditory responses were measured by presenting broadband noise bursts (flat amplitude spectrum: ±1 dB; 2–10 kHz; 20–30 dB above threshold; 500-ms duration) dichotically through speakers placed ∼5 mm from the tympanic membrane. A frozen auditory stimulus was calculated at the beginning of each set of measurements, and the same auditory stimulus was used for all auditory and bimodal stimulus presentations within a given set. ITDs were generated using the “ShortDynDel” function running on TDT hardware (RP2) with stimulus waveforms digitized at 25 kHz. ILD values were generated by differentially attenuating the left and right auditory waveforms with TDT programmable attenuators (PA5). Visually driven responses were measured by projecting computer controlled visual stimuli (1–2° radius; positive contrast; 500-ms duration) on a tangent screen either 53 or 125 cm from the owl's eyes. Visual stimuli were generated in Matlab, using the Psychophysics Toolbox extensions (Brainard 1997; Pelli 1997). Auditory stimuli and neural recordings were synchronized with visual stimuli using a photodiode trigger placed adjacent to the visual screen. All visual, bimodal, and auditory stimuli necessary for making each reported comparison, excluding data presented in Fig. 4, were presented in randomly interleaved fashion. The presentation order was randomized within each set of possible stimulus combinations, and this process was repeated for each repetition of the stimuli.
Electrophysiological recording
During recording sessions, owls were suspended in a prone position with the head stabilized using the mounted fastener. Miniature speakers were inserted into the ears for auditory stimulus presentation, and the eyelids were held open with clips. Nitrous oxide and oxygen (45:55) were administered during the time required to isolate a site within the ICX. Once an ICX site was isolated and initial auditory measurements were made, the nitrous oxide and oxygen mixture was turned off. Auditory and visual measurements resumed ≥5 min after the termination of nitrous oxide. For the remainder of the experiment, owls were physically restrained but not anesthetized. If an owl became restless, nitrous oxide and oxygen (45:55) were briefly administered. If the owl remained restless, the experiment was terminated.
Units in the ICX were distinguished from units in neighboring auditory nuclei on the basis of stereotaxic position, response latency, tuning for frequency, tuning for ITD, and tuning for ILD. The classification of ICX sites based on these properties has been verified repeatedly by reconstructions of electrolytic lesions in several major studies (Brainard and Knudsen 1993; DeBello et al. 2001; Feldman and Knudsen 1994). The locations of four recording sites, in four different owls, were marked with electrolytic lesions (cathodal current, 5 μA, 10 s). Owls were killed 1 wk after electrolytic lesions were made. Brain tissue was fixed in 10% formaldehyde, sliced in 40-μm sections, and the locations of the lesions were visualized with a Nissl stain. All lesions were in the central to lateral ICX.
Multi- and single-unit responses were isolated in the ICX with insulated tungsten microelectrodes (FHC; 6–13 MΩ at 1 kHz). Spike times were stored using TDT hardware (RA-16) controlled by customized MATLAB (Mathworks) software. Spike waveforms, centered on the threshold crossings, were saved. Single- versus multiunit classification was performed on-line based on the spike waveform and was subsequently confirmed by off-line analysis of the saved waveforms. A total of 64 sites (19 single units; 45 multiunits) was collected and analyzed, and no differences were observed between these two populations.
Selection of recording sites
An initial bimodal screen was used to identify candidate ICX sites to be included in this study. In this initial screen, the position of a moving dot was varied across the visual field and presented synchronously with an optimized auditory stimulus. Sites that exhibited >5% change in response, compared with the response to the auditory stimulus alone, were tested further. The proportion of modulated sites increased as our technique for testing for cross-modal interactions improved with experience. Overall we estimate that ∼30% of ICX sites passed this screen. This screening method allowed us to more frequently target our recordings to the subset of sites that were modulated by visual stimuli. To ensure the statistical validity of our results, all reported data were collected in a randomized fashion following, and independently from, this initial screen. Therefore no data from the initial screen were included in the reported analyses.
Characterization of recording sites
The best values for ITD, ILD, visual azimuth, and visual elevation were calculated as the center of the normal curve that minimized the least-squares estimate to the observed responses. Presentations of all visual, auditory, and bimodal stimuli were randomly interleaved and presented one at a time with an interstimulus interval ranging from 2 to 3 s. Unless otherwise noted, the onsets of auditory and visual stimuli were synchronized with a jitter of <2 μs. All selected recording sites were characterized in the following manner. First, the best ITD and best ILD were identified by systematically varying ITD and ILD in 10-μs and 5-dB steps, respectively. The auditory stimulus that elicited the strongest responses was identified, and all subsequent auditory stimuli were presented with these best ITD and best ILD values unless otherwise noted. Second, the best auditory stimulus was presented synchronously with visual stimuli centered at the predicted auditory azimuth based on ITD and ILD tuning. The visual stimulus was a dot that moved horizontally (1–2° radius; velocity: right 10°/s; 500-ms duration) during each stimulus presentation and was presented at a range of elevations to determine the optimal elevation for the visual stimulus. The elevation that elicited the strongest bimodal response was identified, and this elevation was used in subsequent tests. Third, the best auditory stimulus was presented synchronously with visual stimuli centered at the best elevation. The visual stimulus was a dot that moved vertically (1–2° radius dot; velocity: upward 10°/s; best elevation; 500-ms duration) during each stimulus presentation and was presented at a range of azimuths to determine the optimal azimuth for the visual stimulus. The azimuth of the visual stimulus that drove the bimodal responses most strongly was determined. The visual modulation field (VMF) was defined as the region of a Gaussian fit to the bimodal data that exhibited ≥50% of the maximum modulation (Figs. 1 and 2). A small number of measurements (n = 5) were made in which the VMF was measured with the ITD displaced by 40 μs from the best ITD. No obvious effect was observed on the shape or location of the VMF. However, during these tests, we found that the modulations observed with suboptimal auditory stimuli were too weak to plot a reliable VMF. Fourth, ITD values of the auditory stimulus (best ILD; 20 dB above threshold; 500-ms duration) were systematically varied and presented synchronously with an upward moving visual stimulus (10°/s) located at the best azimuth and the trajectory centered on the best elevation. In all cases, motion of the visual stimulus was orthogonal to the parameter of space that was being tested.
FIG. 1.

Visual enhancement of auditory responses of a single inferior colliculus (ICX) unit. A: raster plots of responses to optimized visual-alone, bimodal, and auditory-alone stimuli. Each point represents the time of a spike to 20 repetitions of each stimulus. Auditory, visual, and bimodal stimuli were presented in a randomly interleaved fashion. Shaded regions indicate the period of stimulus presentation. B: responses, from A, were binned at 1 ms and smoothed with a 15-ms running average (visual, blue; auditory, black-dashed; bimodal, red). C: an electrolytic lesion (arrow) indicates the recording site centered in the ICX (OT, optic tectum; IC, inferior colliculus). Scale bar = 500 μm; d, dorsal; l, lateral. D and E: average responses to interaural time difference (ITD, D) or interaural level difference (ILD, E) during a 500-ms broadband auditory stimulus. Dashed black lines indicate the normal curve that minimized the least squares estimate of the measured data. Error bars represent bootstrap SE. Responses at this site were maximum to an ITD value of -7.5 μs [left ear leading; 95% confidence interval (CI): -10.5 to -4.5; arrow] and an ILD value of 12.2 (right ear greater; 95% CI: 11.5 to 12.9; arrow). F and G: response profiles to visual-alone stimuli (blue), auditory-alone stimuli (black), and bimodal stimuli (red; filled circles) were measured for a range of visual stimulus azimuths (F) and elevations (G). The response to the auditory-alone stimulus is plotted as a horizontal black line (dashed horizontal lines indicate the mean and bootstrap SE) extended across the plot as a reference for bimodal responses. Error bars represent the bootstrap SE. The response enhancements were significant for both azimuth and elevation (F, Paz < 0.0001; G, Pel = 0.035; bootstrap test with Bonferroni correction). Downward arrows: visual modulation field (VMF) center.
FIG. 2.

Summary of VMF sizes, strengths, and alignments with auditory receptive fields. VMFs were measured by varying the location of a visual stimulus while keeping an optimized auditory stimulus constant. A: VMF widths in azimuth, measured at 50% of the maximum enhancement over auditory-alone responses (downward arrow: median width). B: VMF strengths, measured relative to the maximum auditory-alone responses (downward arrow: median magnitude). C: average VMF (red; filled circles) and visual-alone (blue; asterisks) profiles, calculated by aligning data on the measured VMF center at each site. Response magnitudes were normalized to the auditory-alone response (dashed black). Error bars represent the bootstrap SE. D: the predicted auditory receptive field center, based on tuning to ITD and ILD (see methods), plotted as a function of the observed azimuth of the VMF center (R2 = 0.79; P < 0.00001).
After the spatial properties of the VMF were characterized, several tests were performed to characterize the effect of visual stimuli on auditory responses. Each of these tests was performed on a subset of recording sites. For each of these tests, the auditory stimulus was centered in the auditory receptive field (best ITD and best ILD; ∼20 dB above threshold; 500-ms duration), and the visual stimulus was centered in the VMF (best elevation and best azimuth; positive contrast; 500-ms duration). First, the effects of different kinds of visual stimuli on auditory responses were assessed. Auditory-alone, visual-alone, and bimodal responses were measured with interleaved stimulus presentations. For this experiment, three types of visual stimuli were tested: stationary (1° radius throughout presentation), moving (1° radius throughout presentation; velocity: upwards 10°/s), or looming (0° radius at onset; 2° radius at 500 ms; linear increase of radius).
Second, the ratio at which two stimuli were presented was varied to determine the effect on the magnitude of the corresponding response (Fig. 4C). Briefly, two sets of bimodal stimuli, differing only in the direction of motion of the visual stimulus, were presented in four separate blocks. Each block differed in the relative probability of stimulus 1 versus stimulus 2 presentations. Visual stimuli (velocity: 10°/s) were designed such that the starting point of stimulus 1 was the endpoint for stimulus 2 and vice versa. An optimized auditory stimulus was always presented synchronously with either visual stimulus. Within each block, the ratio of stimulus 1 presentations to stimulus 2 presentations was 20/80, 40/60, 60/40, or 80/20. Presentations of each stimulus were randomly interleaved within each block, and the order of the blocks was randomized for each recording site.
In all cases, “percent enhancement” was calculated using the following equation: (bimodal response –auditory response)/auditory response * 100.
Similarly, unless otherwise noted, response normalizations were calculated by dividing the visual, auditory, and bimodal responses by the maximum auditory response.
Data analyses
Spikes were summed, for each stimulus condition, either for the entire stimulus duration (Figs. 1–5) or with responses during the first 50 ms omitted (Fig. 6). The baseline firing rate, averaged across 100 ms prior to stimulus onset, was subtracted from the responses measured following stimulus onset. At each ICX site, the best ITD, ILD, VMF azimuth, and VMF elevation were determined by fitting a bell curve to the distribution of responses. Bimodal response enhancement was calculated as the difference between bimodal and auditory-alone responses with all stimuli at their best values. All error bounds were calculated as the bootstrap SE (10,000 bootstrap samples).
The predicted auditory receptive field center was calculated based on the best ITD and best ILD values for each site. Briefly, an average head-related transfer function (HRTF), measured by recording the waveforms of free field sounds reaching an owl's left and right ears (Keller et al. 1998), was used to determine the ITD and ILD values (broadband 4–9 kHz) at each azimuth and elevation in frontal space (±50° azimuth, ±40° elevation). The expected VMF azimuth was then identified as the azimuth that minimized the difference between the HRTF ITD and ILD values and the measured best ITD and best ILD for each site. This analysis is similar to previous analyses in which the expected visual azimuth was based on the equation (Brainard and Knudsen 1993): best azimuth = best ITD/2.5, but is more accurate because it accounts for changes in ITD with elevation. All population spatial analyses were performed for azimuth only because the relationship between ITD and azimuth is monotonic, largely frequency independent, and similar across individuals (Keller et al. 1998; Knudsen et al. 1991); these properties do not hold for ILD and elevation.
At each site, responses to visual-alone and bimodal stimuli were normalized to the peak auditory-alone response. Accordingly, a normalized response value of 1.0 (Figs. 2C and 6) indicates no change from the auditory-alone response. The auditory-alone, visual-alone, and bimodal responses in Fig. 3A were normalized to the maximum auditory-alone response. Visual-alone and bimodal response profiles were aligned based on the predicted best auditory azimuth to create the population average VMF (Fig. 3A).
FIG. 3.

Auditory-alone, visual-alone, and bimodal responses measured by varying the location of the auditory stimulus while keeping the visual stimulus constant at the VMF center. A: average auditory-alone (black; dashed line; open circles) and bimodal (red; solid line; filled circles) response profiles plotted with the corresponding best-fit normal curves. For each site, responses were aligned on the best ITD value and normalized to the peak auditory-alone response. The visual-alone response is extended across the plot for comparison (blue; dashed lines indicate the bootstrap s.e.m.). Bimodal stimuli, with the visual stimulus centered in the VMF, enhanced responses to an auditory stimulus for a wide range of auditory stimulus locations. The difference between bimodal and auditory-alone responses was highly significant (P < 0.00001; bootstrap test with Holm-Bonferroni correction), with significant differences in individual ITD values as far out as 70 μs (P < 0.05; bootstrap test with Holm-Bonferroni correction). Error bars represent the bootstrap SE. B: the percent enhancement of responses as a function of auditory response, all values normalized to the maximum auditory response. Percent enhancement was calculated as: (bimodal response − auditory response)/auditory response. As indicated by the best-fit line (dashed red), response enhancement increased slightly as the strength of the auditory response increased (slope: 0.10 CI = 0.05–0.15; R2 = 0.09; P = 0.0002).
The time course of the visual modulation was analyzed for the visual azimuth nearest the predicted auditory azimuth center for each site. Bimodal, auditory-alone, and visual-alone PSTHs were created for each site by binning spikes at 1-ms intervals for the entire stimulus duration. The resulting PSTHs were adjusted for baseline activity and normalized by the total auditory-alone response. This normalization equalized the area under the auditory PSTHs for each recorded site. The bimodal, auditory, and visual PSTHs were averaged across all sites, filtered with a 15-ms flat filter and scaled such that the maximal auditory-alone response equaled one.
Statistics
The data presented in this paper were found to be nonnormally distributed. Accordingly, all statistics were based on nonparametric resampling methods. A bootstrap test (Efron and Tibshirani 1993) (10,000 iterations) was used in all cases in which a distribution was compared against an expected value. All comparisons between groups with paired data sets utilized a bootstrap test performed on the difference between the two groups. All comparisons between two groups with unpaired data sets utilized a Permutation test (Efron and Tibshirani 1993) (10,000 iterations). In all cases where multiple comparisons were made, the observed P values were adjusted using a Holm-Bonferroni correction. Briefly, the measured P values were ordered from smallest to largest. Adjusted P values were calculated by multiplying the smallest P value by N, the number of statistical comparisons. The second smallest P value was then multiplied by (N − 1), and the largest P value by 1. The smallest adjusted P value was reported for the overall significance of the test. Individually significant comparisons were determined based on the value of adjusted P value. Regressions were performed using the “regress” function in Matlab.
RESULTS
Visual modulation of auditory responses at a single site
Auditory responses were modulated by the presence of a synchronous, visual stimulus centered in the auditory spatial receptive field at ∼30% of all ICX sites (methods). The effects of auditory and visual stimulation on the responses of an isolated ICX unit are summarized in Fig. 1. The responses of this unit were tuned to an ITD of −8 μs (left ear leading) and an ILD of +12 dB (right ear greater), which defined this site's best ITD and best ILD, respectively (Fig. 1, D and E, arrows). Responses to auditory-alone and bimodal stimuli began as soon as 6 ms after the onset of the stimuli (Fig. 1A). Responses to auditory-alone and to bimodal stimuli were indistinguishable during the initial burst of activity (Fig. 1, A and B), but responses to bimodal stimuli were maintained at a significantly higher rate during the sustained portion of the response that persisted throughout the remainder of the 500-ms duration of the stimulus (Fig. 1B, red line). In contrast, this unit did not respond to visual stimuli presented alone (Fig. 1A, F, and G, blue lines). The location of this recording site (Fig. 1C, arrow) was centered within the ICX.
The timing of the visual modulation of auditory responses can be inferred from the difference in the poststimulus time histograms (PSTHs) for the bimodal and auditory-alone stimulus conditions (Fig. 1B; red vs. black lines). The visual stimulus began to modulate auditory responses at a latency of ∼50 ms after stimulus onset. This latency is consistent with visual response latencies in midbrain nuclei (Gutfreund et al. 2002; Maczko et al. 2006).
A visual stimulus was effective in modulating responses to an auditory stimulus only when the visual stimulus was located within a specific region of space, the VMF (Fig. 1, F and G). VMFs were measured by presenting moving visual stimuli at different azimuths and at different elevations, while the position of an auditory stimulus remained constant at the best ITD and best ILD for the site. All combinations of auditory, visual, and bimodal stimuli were randomly interleaved. The VMF for this unit, measured at half the maximum response enhancement (bimodal response –auditory-alone response), extended from left 4° to right 4° in azimuth (Fig. 1F). In elevation, the VMF extended from +16° to above the range of the visual projection screen (Fig. 1G). Maximum response enhancements for this unit were observed at 0° azimuth (8.3 ± 1.7 spike/s; 50 ± 10% bootstrap SE; P < 0.0001, bootstrap test) and at +20° elevation (9.8 ± 3.2 spike/s; 42 ± 13%; bootstrap SE; P < 0.035, bootstrap test).
Characteristics of VMFs
We used a standard set of bimodal stimuli to measure VMFs in the ICX (methods). VMFs varied in size (width at half-max) from 2 to 35° in azimuth (median = 12.4°; Fig. 2A). The magnitude of visual enhancements, relative to auditory-alone responses, ranged from −34 to 533% (median = 20%; Fig. 2B). The visual enhancements of individual sites included in Fig. 2B were significant for 21 of 64 sites (P < 0.05; bootstrap test with Holm-Bonferroni correction) as well as for the entire population (P < 0.0001; bootstrap test). The shape of the average VMF (Fig. 2C, red curve) was approximated well by a Gaussian curve with a width at half-max of 9.8° and a magnitude of 39.4 ± 10.2%. In contrast, the magnitude of the average peak response to visual-alone stimuli was only 4.8 ± 2.1% (Fig. 2C, blue curve; P < 0.0001). As discussed in the following text, the exact size and magnitude of VMFs were highly dependent on the stimulus set and the context within which the stimuli were presented. Visually induced reductions in auditory responses (e.g., Fig. 1G) were observed at a below-chance rate (2 of 64 sites; P < 0.05; bootstrap test with Holm-Bonferroni correction). Thus there was no evidence for VMF inhibitory surrounds.
The center of a neuron's VMF predicted its auditory spatial tuning. VMF centers were derived from Gaussian best fits of visual modulation tuning curves (e.g., Fig. 1, F and G). Auditory spatial tuning was predicted by translating measured best ITD and best ILD for each site (e.g., Fig. 1, D and E) into spatial coordinates, using a standard transfer function (methods). The predicted auditory receptive field centers correlated strongly with measured VMF centers (Fig. 2D; R2 = 0.79; P < 0.00001; least-squares regression of predicted auditory center on observed VMF center). This correlation indicates that for each ICX neuron, visual and auditory inputs were, on average, tuned to the same region of space.
Visual enhancement of auditory responses
Visual enhancement scaled proportionally with increasing auditory drive (Fig. 3A). when the auditory stimulus was centered in a neuron's auditory receptive field, the maximum response enhancement, for the population average, was 16.3 ± 1.2% (Fig. 3A; n = 20; bootstrap SE). Even though auditory-alone responses were small near the edges of auditory receptive fields, spatially optimized visual stimuli continued to enhance auditory responses to stimuli that were as much as 70 μs (≈28°) away from best ITDs (Fig. 3A). Although the magnitude of response enhancement increased slightly as the auditory-alone response became stronger, visual stimuli located in the VMF enhanced all auditory responses of a neuron (Fig. 3B; 15 measurements from each of 20 recording sites).
The average bimodal enhancements observed in the two data sets described in the preceding text were different. The larger enhancement (39.4 ± 10.2% enhancement; Fig. 2C) was observed in trials in which the location of the visual stimulus varied randomly across a range of azimuthal locations. The smaller enhancement (16.3 ± 1.2% enhancement; Fig. 3A) was observed in trials in which the location of the visual stimulus remained constant across all trials. The substantial decrease (>50%) in the enhancement effect in the second data set implied that the enhancing effect of a visual stimulus declined when the visual stimulus appeared repeatedly at the same location.
This implication was tested directly by presenting interleaved auditory-alone and bimodal stimuli repeatedly from the same location. Over the course of 15 successive stimulus presentations, the responses to both auditory-alone and bimodal stimuli decreased, however, the decrease to bimodal stimuli exceeded the decrease to auditory-alone stimuli (Fig. 4A; n = 19). The differential effect of stimulus repetition on bimodal enhancement was assessed by analyzing percent visual enhancement, calculated as: (bimodal response –auditory response)/auditory response, as a function of the order of the stimulus trial for the same data (Fig. 4B). A progressive decline in visual enhancement with repeated presentations of the same stimulus was observed (R2 = 0.38; P = 0.01; F = 7.93). Adaptation to repeated visual stimulation suggested that the magnitude of the visual enhancement was dependent on the “novelty” of the visual stimulus.
FIG. 4.
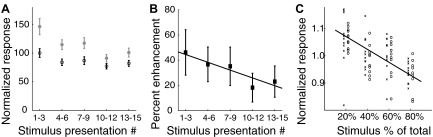
Rare visual stimuli enhanced auditory responses more than frequently presented visual stimuli. A: average responses to repeated presentation of auditory-alone (black; open circles) and looming bimodal (grey; filled circles) stimuli. Responses represent averages across three successive stimulus presentations. Responses to both auditory-alone (R2 = 0.21; P = 0.01; F = 6.64; regression of auditory response on stimulus presentation number) and bimodal stimuli (R2 = 0.39; P = 0.0001; F = 16.61; regression of bimodal response on stimulus presentation number) declined with successive stimulus presentations. Error bars represent the bootstrap SE. B: the average bimodal response enhancement [(bimodal response − auditory response)/auditory response] induced by looming visual stimuli plotted as a function of the order of stimulus presentation. The percent enhancement of auditory responses decreased with repeated presentations of the looming stimulus [slope = −2.2; 95% CI = −4.0 to −0.5; R2 = 0.38; P = 0.01; F = 7.93; regression of response enhancement on stimulus presentation number]. Error bars represent the bootstrap SE. C: rare stimuli within a stimulus block evoked stronger responses. Two identical visual stimuli moved across identical portions of the visual field but in opposite directions (1 to the left and the other to the right). Both of these visual stimuli were synchronized with an auditory stimulus at the best ITD and best ILD for the site. These 2 bimodal stimuli were randomly interleaved in 4 blocks of trials in which the ratios of leftward to rightward visual stimuli were: 20/80, 40/60, 60/40, or 80/20. Responses to leftward (×) and rightward (open circles) stimuli are plotted side by side for each case in which the stimulus was presented with a specific ratio. Stronger responses were observed with less frequently presented stimuli (R2 = 0.26; F = 29.5; P < 0.00001; regression of response on stimulus probability). Error bars represent the bootstrap SE.
The relationship between stimulus novelty and the magnitude of visual enhancement was investigated by interleaving bimodal stimuli for which only the direction of visual motion differed (methods). For this test, the ratio of bimodal stimuli consisting of either a leftward or a rightward moving visual component was varied from 20:80 to 80:20 across different stimulus blocks. Responses decreased by an average of 12 ± 2% (bootstrap SE) as the proportion of either the left- or the rightward visual stimuli increased from 20 to 80% (Fig. 4C). Roughly 25% of the overall response variance was due to changes in the probability with which each kind of stimulus was presented in a block of stimuli (R2 = 0.26; F = 29.5; P < 0.00001; regression of response on stimulus probability; n = 20).
Time course of visual enhancement
The time course of visual enhancement was analyzed by comparing the average PSTHs to optimized auditory-alone, visual-alone, and bimodal stimuli (Fig. 5A, n = 64). Visual enhancement of auditory responses began, on average, 50 ms after stimulus onset and continued unabated until the end of the 500-ms stimulus (Fig. 5B). The absence of an effect of the visual stimulus on auditory responses during the first 50 ms after bimodal stimulus onset was due, in part, to the long latency for visual activity to reach the OT. It is possible, however, that auditory-alone stimuli drive ICX responses maximally during this period, thereby, not allowing further enhancement by the visual stimuli.
FIG. 5.

Time course of response enhancement. At each ICX site, responses to auditory-alone, visual-alone, and bimodal stimuli were binned at 1 ms and smoothed with a 15-ms running average. A: visual-alone (blue) and bimodal (red) data represent responses to stimuli presented at the azimuth that most closely matched the predicted auditory receptive field center for each site. Data were averaged across sites and normalized to the peak auditory (dashed black) response. B: time course of response enhancement: (bimodal response − auditory-alone response)/auditory-alone response. In each panel, the stimulus duration is indicated by the grey rectangle; the vertical dotted line is at 50-ms post-stimulus onset. Shaded grey region indicates the bootstrap SE. C: effect of varying the relative onset time of visual vs. auditory stimuli on response enhancement. In this experiment, 200-ms auditory and visual stimuli were presented (in contrast to the 500-ms stimuli used in other tests), and the response during the auditory stimulus is plotted. Error bars indicate the bootstrap SE.
To determine the importance of stimulus timing on the visual enhancement of auditory responses, the relative onset of visual and auditory stimuli (200-ms duration) was varied (Fig. 5C; n = 11). The effect of relative timing was distinctly asymmetric with large effects occurring only when the visual stimulus either coincided with, or preceded, the auditory stimulus. Response enhancement was maximal when the visual stimulus preceded the auditory stimulus by 200 ms and was absent when the auditory stimulus preceded the visual stimulus by 100 ms. This asymmetry corresponds with the asymmetry in the arrival times of visual and auditory stimuli that occurs naturally due to the slow propagation of sound through air.
Effective visual stimuli for modulating auditory responses
Some visual stimuli were far more effective than others in enhancing auditory responses (Fig. 6). Three different kinds of visual stimuli were tested: a moving dot (the same stimulus as was used in the first part of this study), a stationary flashed dot, and a looming dot. The presentations of these three stimuli were centered in the VMF and synchronized with a noise burst that was centered in the site's auditory receptive field. The analyses excluded the first 50 ms because, as is shown in Fig. 5, there is no visual modulation during this time window. Across all ICX sites (n = 19), when stationary, moving, or looming visual stimuli were presented alone, only looming stimuli elicited activity that was significantly above-baseline activity (Fig. 6; average increase = 9.2 ± 4.4% of the response to the auditory-alone stimulus; Ploom = 0.006; bootstrap test with Holm-Bonferroni correction). When synchronized with an auditory stimulus from the same location in space, looming visual stimuli elicited an average response enhancement of 40.5 ± 10.3%, moving visual stimuli an enhancement of 39.7 ± 6.5%, and stationary flashed stimuli an enhancement of 13.9 ± 5.1% over responses to auditory-alone stimuli. The responses to each type of bimodal stimulus were significantly greater than responses to the auditory stimulus presented alone (PloomAV < 0.00001; PmoveAV < 0.00001; PstatAV = 0.0025; bootstrap test with Holm-Bonferroni correction).
FIG. 6.

Comparison of ICX responses to bimodal and visual-alone stimulation. Three kinds of visual stimuli (looming, moving, and stationary; see methods) were presented with or without a synchronous auditory stimulus. The 1st 50 ms of the stimulus presentation were excluded from analysis because no visual modulation occurred during this time window. Response profiles were normalized to the auditory-alone response (dashed black line) at each site. Each boxplot indicates the smallest value, lower quartile, median, upper quartile, and largest value (outliers are indicated ×). Average bimodal responses were 140.5 ± 10.3% with a looming visual stimulus, 139.7 ± 6.5% with a moving visual stimulus, and 113.9 ± 5.1% with a stationary visual stimuli as compared to the auditory-alone response (Ploom < 0.0001, Pmove < 0.0001, Pstat = 0.0025; bootstrap test with Bonferroni correction). Across all sites, only looming visual-alone stimuli induced a detectable response above baseline (9.2 ± 4.4%) relative to auditory-alone responses (P = 0.006; bootstrap test with Bonferroni correction). Error bars indicate the bootstrap SE.
DISCUSSION
This study demonstrates that the auditory responses of a subset of neurons in the owl's ICX, a nucleus that carries out a critical transformation of auditory spatial information, are modulated by visual stimuli. The enhancement of auditory responses occurred only when the visual stimulus was located within the VMF of the ICX unit. VMF centers correlated strongly with auditory RF centers, indicating a mutual alignment of auditory and visual spatial tuning in the ICX (Figs. 1, F and G, and 2D). Auditory-visual interactions in the ICX differ from those in the OT, homologue of the mammalian superior colliculus, in an important way: while both auditory and visual stimuli are capable of driving responses of most bimodal OT neurons, only auditory stimuli drive responses of ICX neurons effectively. Thus although they can be modulated by visual stimuli, ICX responses are fundamentally auditory.
The OT is the only known source of visual input to the ICX. Neurons in the OT have been shown to project topographically to the ICX (Hyde and Knudsen 2000), and visual responses appear in the ICX when inhibition is blocked pharmacologically in the OT (Gutfreund et al. 2002). Moreover, the visual stimulus characteristics that were effective in modulating auditory responses in the ICX, such as moving, looming, or low-probability stimuli, are also effective in driving visual responses in the OT (Luksch et al. 1998; Stein and Meredith 1993). For these reasons, we believe that the OT is the most likely source of the visual modulation signal to the ICX. However, neurons in many areas of the brain respond preferentially to such behaviorally important visual stimuli (Maier and Ghazanfar 2007; Sun and Frost 1998), and it is possible that the visual modulations observed in this study represent contributions from these as yet unidentified areas.
The magnitude of auditory response modulation observed in this study was dependent on the context in which visual stimuli were presented. While dynamic and low-probability visual stimuli modulated auditory responses strongly, stationary and frequently repeated visual stimuli modulated responses only weakly. Although it is complicated to compare the strengths of responses to different kinds of dynamic stimuli, such as looming versus moving stimuli, our results clearly indicate that dynamic visual stimuli are far more effective in enhancing auditory responses than are stationary visual stimuli.
We hypothesize that visually driven modulatory signals in the ICX perform two important functions: 1) they act as a spatial template that instructs plasticity to maintain the accuracy of the representations of auditory cues in the ICX (Brainard and Knudsen 1993) and 2) they enhance auditory responses to stimuli that are likely to be of biological importance. In the discussion that follows, we consider the suitability of the visual modulation signals as instructive inputs for guiding plasticity in the ICX. We then consider how the observed visual modulation of auditory responses is likely to bias behaviors toward salient stimuli. Finally, we propose that analogous modulatory signals may play similar roles in other regions of the brain.
Visual template for auditory plasticity
Experimental manipulations that change the relationships between auditory cue values and locations in the visual field (for example, chronic exposure to displacing prism spectacles) cause gradual changes in the representations of ITD and ILD in the owl's ICX (Knudsen 1999). These changes tend to realign the representations of auditory cue values with the locations in the visual field that produce them. Much of the underlying plasticity has been shown to take place in the ICX (DeBello et al. 2001; Feldman et al. 1996; Zheng and Knudsen 1999).
Understanding how visual input guides auditory plasticity in the ICX remains a primary question for understanding the formation and maintenance of the auditory space map. The visual enhancement of the auditory responses, reported in this study, exhibits the necessary properties to act as an instructive template for guiding this plasticity. First, accurate visual calibration of auditory localization cues requires that visual and auditory stimuli originate reliably from the same source. The visual inputs responsible for VMFs are spatially tuned and are topographically organized in the ICX as demonstrated by the mutual correlations of VMF centers with predicted auditory receptive field centers (Fig. 2D). Second, our experiments show that visual enhancement of auditory responses was most pronounced when the visual stimulus preceded the auditory stimulus (Fig. 5C). This indicates that bimodal interactions in the ICX accommodate differences in the travel velocity of sound versus light. For example, the visual component of a bimodal stimulus located 15 m away arrives at the eye ∼45 ms before the auditory component arrives at the ear. Third, the visual modulatory signals enhance auditory responses across a wide range of auditory cue values (Fig. 3A), allowing visual signals to selectively strengthen coincident auditory responses even when auditory and visual receptive fields are substantially misaligned.
The visual input that underlies the enhancement effect could act as an instructive signal by adjusting the strength of plastic auditory inputs according to a Hebbian rule (Hebb 1949; Knudsen 1994). According to the Hebbian rule, auditory synapses that are most effective in driving postsynaptic responses should strengthen, whereas those that are not effective should weaken. Visual input to the ICX influences the pattern of the neurons in the space map that are most excitable. During periods of bimodal stimulation, auditory synapses that are consistently co-active with a visual input would have a greater effect on postsynaptic firing and therefore would differentially strengthen over time. When the auditory and visual maps are already aligned, such a Hebbian rule would act to maintain the alignment between the two maps. However, when the visual and auditory maps become misaligned, as in the case of prismatic glasses, the offset visual input would provide a slight bias to auditory responses in the ICX. This effect would cause the auditory tuning of an ICX neuron to conform gradually to the spatial tuning of its visual input (Witten et al. 2008).
There are at least two considerations that have important implications for instructive signaling in this context. First, we cannot rule out the possibility that VMF locations are affected by the locations of auditory stimuli. Nevertheless, as long as the visual modulations described in this study maintain partial information about the location of the visual stimulus, the model of instructive signaling we have proposed remains valid. We found that visual stimuli located in the center of the VMF are capable of modulating peripheral auditory responses (see Fig. 3), indicating that VMF locations are unlikely to be entirely dependent on the location of the auditory stimulus. Second, while visually guided auditory plasticity is known to occur at most ICX sites, we observed visual modulations only at a subset of ICX sites. Our experiments were restricted to studying only those sites that were modulated by the specific visual stimuli that we employed, and therefore our results place a lower limit on the proportion of ICX sites that are modulated by visual input.
The observed effect of visual input acting on only a subset of sites is consistent with previous reports demonstrating that the ICX comprises a heterogeneous population of molecularly distinct classes of neurons (Rodriguez-Contreras et al. 2005) and that anatomical projections from the OT to the ICX are sparse (Hyde and Knudsen 2000). Therefore we believe that the restricted influence of visual input to a subset of ICX units observed in this study represents an important insight into the mechanisms guiding auditory plasticity in the ICX. One possibility is that these neurons act as a mediator of visually guided plasticity in the ICX and, in turn, instruct the auditory tuning of neighboring ICX neurons of other types. Another possibility is that a larger portion of ICX neurons is modulated by visual input during the sensitive period for visual calibration of auditory responses.
Visual signals in the ICX have been observed previously after blocking GABAergic inhibition in the OT (Gutfreund et al. 2002). This result suggests that GABAergic inhibition gates visual input from the OT to the ICX. Our results demonstrate that rare and dynamic visual stimuli that are located within the VMF effectively modulate ICX responses without pharmacological manipulation. The active gating of visual input to the ICX, documented previously (Gutfreund et al. 2002), and the effect of dynamic visual stimuli that are spatially and temporally coincident with auditory stimuli, observed in this study, may both serve to ensure that visual influences on auditory responses in the ICX are restricted to appropriate situations.
Visual modulation acts as a salience filter
The CNS enhances neural responses to stimuli that are likely to be of biological importance or that occur infrequently in space or time (Bichot and Schall 1999; Egeth and Yantis 1997; Itti and Koch 2001; Ulanovsky et al. 2003).The enhanced responses to specific classes of stimuli can be either learned or built into sensory pathways. In either case, such biased responses give the representations of salient stimuli an advantage when competing for attention and for the control of gaze direction (Knudsen 2007).
The visual input to ICX neurons acts as a salience filter, differentially enhancing auditory responses associated with visual stimuli that move, loom, or occur infrequently. Each of these classes of visual stimuli is known to be salient in the context of attention (Egeth and Yantis 1997; Franconeri and Simons 2003). The selectivity of the visual modulation signal for rare and dynamic visual stimuli is not expected if the purpose of the visual input to the ICX is solely to guide auditory plasticity. For guiding plasticity, visual stimuli that are synchronized with spatially aligned auditory stimuli should modulate auditory responses each time they occur. Instead the increased effectiveness of visual inputs that are associated with rare and dynamic visual stimuli suggests a role for this input in regulating the access of auditory information to the circuitry that mediates gaze control and attention. Indeed while these experiments clearly demonstrate the capacity for visual stimuli to modulate auditory responses in the ICX, it is possible that this modulation reflects an attention mechanism. In either case, the advantages of regulating neuronal responsiveness at the level of the ICX, rather than in the OT, include the capacities to modulate specifically auditory information at a site where spatial information is converging across frequency channels and to modulate all structures that receive input from the ICX.
Functional roles of cross-modal interactions
Visual modulations of auditory responses in the ICX add to the growing body of literature demonstrating the capacity of circuits at higher levels in processing hierarchies to selectively modulate sensory representations in lower level circuits. Top-down modulations of sensory responses have become a hallmark of attention and have been observed in a wide range of sensory areas (Reynolds and Chelazzi 2004; Knudsen 2007; Moore et al. 2003; Winkowski and Knudsen 2008). There is also a growing body of literature demonstrating cross-modal interactions in brain regions that were once thought to be involved exclusively in processing information from a single sensory modality (like the ICX). For example, visual and somatosensory influences have been reported in the auditory cortex (Bizley et al. 2007; Ghazanfar et al. 2005; Maier et al. 2004), auditory and vestibular influences in the visual cortex (Gu et al. 2007; Morrell 1972), and visual and eye-position influences in the auditory midbrain (Porter et al. 2006). As we propose for the ICX, the functions of cross-modal influences in these cases may include the selective enhancement of responses that represent salient stimuli as well as the experience-dependent calibration of converging representations.
GRANTS
J. F. Bergan received support from National Science Foundation Graduate Research Fellowship and from a National Research Service Award. Support for the experiments came from the National Institutes of Health.
Acknowledgments
We thank Y. Gutfreund, S. Baccus, T. Warren, I. Witten, S. Mysore, and the Knudsen lab members for helpful comments on this paper as well as P. Knudsen for technical assistance. J. F. Bergan and E. I. Knudsen conceived the experiments and wrote the paper. J. F. Bergan performed the experiments, data analysis, and statistics.
REFERENCES
- Bergan 2005.Bergan JF, Ro P, Ro D, Knudsen EI. Hunting increases adaptive auditory map plasticity in adult barn owls. J Neurosci 25: 9816–9820, 2005. [DOI] [PMC free article] [PubMed] [Google Scholar]
- Bichot 1999.Bichot NP, Schall JD. Effects of similarity and history on neural mechanisms of visual selection. Nat Neurosci 2: 549–554, 1999. [DOI] [PubMed] [Google Scholar]
- Bizley 2007.Bizley JK, Nodal FR, Bajo VM, Nelken I, King AJ. Physiological and anatomical evidence for multisensory interactions in auditory cortex. Cereb Cortex 17: 2172–2189, 2007. [DOI] [PMC free article] [PubMed] [Google Scholar]
- Brainard 1997.Brainard DH The Psychophysics Toolbox. Spat Vis 10: 433–436, 1997. [PubMed] [Google Scholar]
- Brainard 1993.Brainard MS, Knudsen EI. Experience-dependent plasticity in the inferior colliculus: a site for visual calibration of the neural representation of auditory space in the barn owl. J Neurosci 13: 4589–4608, 1993. [DOI] [PMC free article] [PubMed] [Google Scholar]
- DeBello 1993.DeBello WM, Feldman DE, Knudsen EI. Adaptive axonal remodeling in the midbrain auditory space map. J Neurosci 21: 3161–3174, 1993. [DOI] [PMC free article] [PubMed] [Google Scholar]
- Driver 2008.Driver J, Noesselt T. Multisensory interplay reveals crossmodal influences on “sensory-specific” brain regions, neural responses, and judgments. Neuron 57: 11–23, 2008. [DOI] [PMC free article] [PubMed] [Google Scholar]
- du Lac 1990.du Lac S, Knudsen EI. Neural maps of head movement vector and speed in the optic tectum of the barn owl. J Neurophysiol 63: 131–149, 1990. [DOI] [PubMed] [Google Scholar]
- Efron 1993.Efron B, Tibshirani RJ. An Introduction to the Bootstrap. New York: Chapman and Hall, 1993.
- Egeth 1997.Egeth HE, Yantis S. Visual attention: control, representation, and time course. Annu Rev Psychol 48: 269–297, 1997. [DOI] [PubMed] [Google Scholar]
- Feldman 1996.Feldman DE, Brainard MS, Knudsen EI. Newly learned auditory responses mediated by NMDA receptors in the owl inferior colliculus. Science 271: 525–528, 1996. [DOI] [PubMed] [Google Scholar]
- Feldman 1994.Feldman DE, Knudsen EI. NMDA and non-NMDA glutamate receptors in auditory transmission in the barn owl inferior colliculus. J Neurosci 14: 5939–5958, 1994. [DOI] [PMC free article] [PubMed] [Google Scholar]
- Foxe 2000.Foxe JJ, Wylie GR, Martinez A, Schroeder CE, Javitt DC, Guilfoyle D, Ritter W, Murray MM. Multisensory auditory-somatosensory interactions in early cortical processing revealed by high-density electrical mapping. Brain Res Cogn Brain Res 10: 77–83, 2000. [DOI] [PubMed] [Google Scholar]
- Franconeri 2003.Franconeri SL, Simons DJ. Moving and looming stimuli capture attention. Percept Psychophys 65: 999–1010, 2003. [DOI] [PubMed] [Google Scholar]
- Ghazanfar 2005.Ghazanfar AA, Maier JX, Hoffman KL, Logothetis NK. Multisensory integration of dynamic faces and voices in rhesus monkey auditory cortex. J Neurosci 25: 5004–5012, 2005. [DOI] [PMC free article] [PubMed] [Google Scholar]
- Gu 2007.Gu Y, Deangelis GC, Angelaki DE. A functional link between area MSTd and heading perception based on vestibular signals. Nat Neurosci 10: 1038–1047, 2007. [DOI] [PMC free article] [PubMed] [Google Scholar]
- Gutfreund 2006.Gutfreund Y, Knudsen EI. Adaptation in the auditory space map of the barn owl. J Neurophysiol 96: 813–825, 2006. [DOI] [PubMed] [Google Scholar]
- Gutfreund 2002.Gutfreund Y, Zheng W, Knudsen EI. Gated visual input to the central auditory system. Science 297: 1556–1558, 2002. [DOI] [PubMed] [Google Scholar]
- Hebb 1949.Hebb DO The Organization of Behavior. New York: Wiley, 1949.
- Hyde 2000.Hyde PS, Knudsen EI. Topographic projection from the optic tectum to the auditory space map in the inferior colliculus of the barn owl. J Comp Neurol 421: 146–160, 2000. [DOI] [PubMed] [Google Scholar]
- Hyde 2002.Hyde PS, Knudsen EI. The optic tectum controls visually guided adaptive plasticity in the owl's auditory space map. Nature 415: 73–76, 2002. [DOI] [PubMed] [Google Scholar]
- Itti 2001.Itti L, Koch C. Computational modeling of visual attention. Nat Rev Neurosci 2: 194–203, 2001. [DOI] [PubMed] [Google Scholar]
- Keller 1998.Keller CH, Hartung K, Takahashi TT. Head-related transfer functions of the barn owl: measurement and neural responses. Hear Res 118: 13–34, 1998. [DOI] [PubMed] [Google Scholar]
- King 1985.King AJ, Palmer AR. Integration of visual and auditory information in bimodal neurons in the guinea-pig superior colliculus. Exp Brain Res 60: 492–500, 1985. [DOI] [PubMed] [Google Scholar]
- Knudsen 1994.Knudsen EI Supervised learning in the brain. J Neurosci 14: 3985–3997, 1994. [DOI] [PMC free article] [PubMed] [Google Scholar]
- Knudsen 1998.Knudsen EI Capacity for plasticity in the adult owl auditory system expanded by juvenile experience. Science 279: 1531–1533, 1998. [DOI] [PubMed] [Google Scholar]
- Knudsen 1999.Knudsen EI Mechanisms of experience-dependent plasticity in the auditory localization pathway of the barn owl. J Comp Physiol 185: 305–321, 1999. [DOI] [PubMed] [Google Scholar]
- Knudsen 2002.Knudsen EI Instructed learning in the auditory localization pathway of the barn owl. Nature 417: 322–328, 2002. [DOI] [PubMed] [Google Scholar]
- Knudsen 2007.Knudsen EI Fundamental components of attention. Annu Rev Neurosci 30: 57–78, 2007. [DOI] [PubMed] [Google Scholar]
- Knudsen 1991.Knudsen EI, Brainard MS. Visual instruction of the neural map of auditory space in the developing optic tectum. Science 253: 85–87, 1991. [DOI] [PubMed] [Google Scholar]
- Knudsen 1991.Knudsen EI, Esterly SD, du Lac S. Stretched and upside-down maps of auditory space in the optic tectum of blind-reared owls: acoustic basis and behavioral correlates. J Neurosci 11: 1727–1747, 1991. [DOI] [PMC free article] [PubMed] [Google Scholar]
- Kohler 2002.Kohler E, Keysers C, Umilta MA, Fogassi L, Gallese V, Rizzolatti G. Hearing sounds, understanding actions: action representation in mirror neurons. Science 297: 846–848, 2002. [DOI] [PubMed] [Google Scholar]
- Linkenhoker 2002.Linkenhoker BA, Knudsen EI. Incremental training increases the plasticity of the auditory space map in adult barn owls. Nature 419: 293–295, 2002. [DOI] [PubMed] [Google Scholar]
- Luksch 1998.Luksch H, Cox K, Karten HJ. Bottlebrush dendritic endings and large dendritic fields: motion-detecting neurons in the tectofugal pathway. J Comp Neurol 396: 399–414, 1998. [PubMed] [Google Scholar]
- Maczko 2006.Maczko KA, Knudsen PF, Knudsen EI. Auditory and visual space maps in the cholinergic nucleus isthmi pars parvocellularis of the barn owl. J Neurosci 26: 12799–12806, 2006. [DOI] [PMC free article] [PubMed] [Google Scholar]
- Maier 2007.Maier JX, Ghazanfar AA. Looming biases in monkey auditory cortex. J Neurosci 27: 4093–4100, 2007. [DOI] [PMC free article] [PubMed] [Google Scholar]
- Maier 2004.Maier JX, Neuhoff JG, Logothetis NK, Ghazanfar AA. Multisensory integration of looming signals by rhesus monkeys. Neuron 43: 177–181, 2004. [DOI] [PubMed] [Google Scholar]
- Meredith 1986.Meredith MA, Stein BE. Visual, auditory and somatosensory convergence on cells in the superior colliculus results in cross-sensory integration. J Neurophysiol 56: 640–662, 1986. [DOI] [PubMed] [Google Scholar]
- Moore 2003.Moore T, Armstrong KM, Fallah M. Visuomotor origins of covert spatial attention. Neuron 40: 671–683, 2003. [DOI] [PubMed] [Google Scholar]
- Morrell 1972.Morrell F Visual system's view of acoustic space. Nature 238: 44–46, 1972. [DOI] [PubMed] [Google Scholar]
- Muller 2005.Muller JR, Philiastides MG, Newsome WT. Microstimulation of the superior colliculus focuses attention without moving the eyes. Proc Natl Acad Sci USA 102: 524–529, 2005. [DOI] [PMC free article] [PubMed] [Google Scholar]
- Pelli 1997.Pelli DG The VideoToolbox software for visual psychophysics: transforming numbers into movies. Spat Vis 10: 437–442, 1997. [PubMed] [Google Scholar]
- Porter 2006.Porter KK, Metzger RR, Groh JM. Representation of eye position in primate inferior colliculus. J Neurophysiol 95: 1826–1842, 2006. [DOI] [PubMed] [Google Scholar]
- Reynolds 2004.Reynolds JH, Chelazzi L. Attentional modulation of visual processing. Annu Rev Neurosci 27: 611–647, 2004. [DOI] [PubMed] [Google Scholar]
- Rodriguez-Contreras 2005.Rodriguez-Contreras A, Liu XB, DeBello WM. Axodendritic contacts onto calcium/calmodulin-dependent protein kinase type II-expressing neurons in the barn owl auditory space map. J Neurosci 25: 5611–5622, 2005. [DOI] [PMC free article] [PubMed] [Google Scholar]
- Stein 1993.Stein BE, Meredith MA. The Merging of the Senses. Cambridge, MA: MIT Press, 1993.
- Sun 1998.Sun H, Frost BJ. Computation of different optical variables of looming objects in pigeon nucleus rotundus neurons. Nat Neurosci 1: 296–303, 1998. [DOI] [PubMed] [Google Scholar]
- Ulanovsky 2003.Ulanovsky N, Las L, Nelken I. Processing of low-probability sounds by cortical neurons. Nat Neurosci 6: 391–398, 2003. [DOI] [PubMed] [Google Scholar]
- Wallace 1996.Wallace MT, Wilkinson LK, Stein BE. Representation and integration of multiple sensory inputs in primate superior colliculus. J Neurophysiol 76: 1246–1266, 1996. [DOI] [PubMed] [Google Scholar]
- Winkowski 2008.Winkowski DE, Knudsen EI. Distinct mechanisms for top-down control of neural gain and sensitivity in the owl optic tectum. Neuron 60: 698–708, 2008. [DOI] [PMC free article] [PubMed] [Google Scholar]
- Witten 2008.Witten IB, Knudsen EI, Sompolinsky H. A Hebbian learning rule mediates asymmetric plasticity in aligning sensory representations. J Neurophysiol 100: 1067–1079, 2008. [DOI] [PMC free article] [PubMed] [Google Scholar]
- Zheng 1999.Zheng GL, Knudsen EI. Functional selection of adaptive auditory space map by GABA-mediated inhibition. Science 284: 962–965, 1999. [DOI] [PubMed] [Google Scholar]