

Abstract
Inhibitors of differentiation (Id) proteins are helix-loop-helix (HLH) transcription factors lacking a DNA binding domain. Id proteins modulate cell proliferation, apoptosis, and differentiation in embryonic/fetal tissue. Perturbation of any of these processes in cells of the developing orofacial region results in orofacial anomalies. Chondrogenesis, a process integral to normal orofacial ontogenesis, is known to be modulated, in part, by Id proteins. In the present study, the mRNA and protein expression patterns of Id1, Id2, Id3 and Id4 were examined in developing murine orofacial tissue in vivo, as well as in murine embryonic maxillary mesenchymal cells in vitro. The functional role of Ids during chondrogenesis was also explored in vitro. Results reveal that cells derived from developing murine orofacial tissue: (1) express Id1, Id2, Id3 and Id4 mRNAs and proteins on each of gestational days 12-14, (2) express all four Id proteins in a developmentally regulated manner, (3) undergo chondrogenesis and express genes encoding various chondrogenic marker proteins (e.g. Runx2, Type X collagen, Sox9) when cultured under micromass conditions, and (4) can have their chondrogenic potential regulated via alteration of Id protein function through overexpression of a basic HLH factor. In summary, results from the current report reveal for the first time, the expression of all four Id proteins in cells derived from developing murine orofacial tissue, and demonstrate a functional role for the Ids in regulating the ability of these cells to undergo chondrogenesis.
Keywords: Id, chondrogenesis, orofacial, fetal, development
Introduction
Inhibitors of differentiation (Id) belong to the family of helix-loop-helix (HLH) transcription factors (Perk e al., 2005). Transcriptional regulators with a basic-helix-loop-helix (bHLH) domain regulate a range of cellular differentiation processes including myogenesis, neurogenesis and hematopoiesis (for a review see Norton JD, 2000). These bHLH proteins form homo- and/or heterodimers, and regulate transcription of various target genes involved in cell differentiation (Sun et al., 1991). Id1, Id2, Id3 and Id4 (also known as dominant negative HLH proteins), lack a DNA-binding domain, but heterodimerize with other bHLH proteins, inhibiting their DNA-binding activity and thus preventing transcription of genes operative in diverse differentiation processes (Benezra et al., 1990; Garrell and Modolell, 1990). In embryonic and adult tissues, Id proteins function as regulators of cell proliferation, differentiation, tumorigenesis, and neoplastic transformation (Iavarone et al., 1994; Desprez et al., 1995; Atherton et al., 1996; Desprez et al., 1998; Lyden et al., 1999; Zebedee and Hara, 2001; Ghil et al., 2002; Chaudhary et al., 2005). Id expression is regulated, in part, by BMP-Smad signaling (Ying et al., 2003; Abe, 2006). Indeed, recent studies have shown that treatment of embryonic maxillary mesenchymal cells with BMP2 or BMP4 resulted in a significant upregulation of Id1, Id2 and Id3 mRNA (Mukhopadhyay et al., 2006) as well as modulation of Id1, Id2, Id3, and Id4 protein levels (Mukhopadhyay et al. unpublished results; Mukhopadhyay et al. 2007). These findings suggest potential functional roles for the Ids in orofacial development.
Chondrogenesis is a critical process contributing to normal orofacial ontogenesis (Ralphs, 1992; Yu and Xing, 2006). Formation of cartilage is a multi-step differentiative process by which mesenchymal cells condense, forming chondroblasts which are then converted into chondrocytes (Kawakami et al., 2006; Goldring et al., 2006). This process is precisely controlled by a range of extracellular and intracellular signals including highly coordinated cross-talk between morphogens and signaling molecules such as the bone morphogenetic proteins (BMPs), members of the Hedgehog and Wnt families, and fibroblast growth factors (Shimizu et al., 2007; Gotting et al., 2007). Cartilage formation is accompanied by expression of components of cartilage extracellular matrix, such as type II collagen (Col II), aggrecan and other sulfated proteoglycans, and is under the control of several transcription factors of the Sox and Runx families (Yamashiro et al., 2004; Zhou et al., 2006). Between gestational days 12 and 14, murine embryonic orofacial tissue exhibits a significant increase in the expression of chondrogenic and osteogenic marker genes (Mukhopadhyay et al. 2004). Since chondrogenesis is known to be modulated, in part, by Id proteins, we examined the expression of the Id transcription factors in developing murine orofacial tissue. In addition, the functionality of Ids in the regulation of chondrogenesis in cells derived from the embryonic maxillary mesenchyme was investigated in vitro.
Methods
Establishment of primary, low- and high-density micromass cultures of murine embryonic maxillary mesenchymal (MEMM) cells
ICR mice (Harlan Laboratories, Indianapolis, IN) were housed in a climate-controlled room at a temperature of 22°C with an alternating 12-h dark-light cycle and were provided access to food and water ad libitum. Mature male and female mice were mated overnight and the presence of a vaginal plug the following morning (day 0 of gestation) was considered as evidence of mating. Pregnant mice were euthanized either on gestational day (GD) 12 or 13 or 14, embryos removed from pregnant dams and embryonic maxillary tissue including secondary palates microdissected in sterile, cold phosphate-buffered saline (PBS). Tissue was dissociated with 0.25% Trypsin/ 0.05% EDTA for 10 min at 37°C, and digested samples briefly triturated, and filtered through a 70-μm mesh. For low density (LD), monolayer cultures, MEMM cells (derived from either GD 12 or 13 or 14 embryos) were plated at an initial density of 6×10⁴ cells per well in six-well tissue culture plates in DMEM F-12 medium (Invitrogen Life Technologies, Inc., Carlsbad, CA) supplemented with 10% FBS, 2 mM glutamine and antibiotics (100 units/ml Penicillin G, 100 μg/ml Streptomycin sulfate and 0.25 μg/ml Amphotericin B), (Invitrogen Life Technologies, Inc.), maintained at 37°C in an atmosphere of 95% air/5% CO2 for 3 days, and then harvested for Alcian blue or immunocytochemical staining, RNA analysis and western blotting as described below. To set up high density micromass cultures of MEMM cells a well-established procedure (Delise and Tuan, 2002; Liu et al., 2004; Yu and Xing, 2006) was followed and formation of well-defined high density micromass spots of MEMM cells was observed consistently. For high-density “micromass” (HDM) cultures of MEMM cells, ten microliter (10 μl) droplets of cell suspension (2 × 10⁵ cells) were plated in six-well tissue culture plates (BD Falcon™; BD Biosciences, San Jose, CA). Droplets were pre-incubated at 37°C in an atmosphere of 95% air/5% CO2 for 90 min to permit cell attachment and then wells were flooded with 1 ml of fresh DMEM F-12 medium. High density micromass cultures were then further incubated at 37°C in an atmosphere of 95% air/5% CO2 for 5 days, and harvested for various endpoint analyses as noted above. This study has been approved by the Institutional Animal Care and Use Committee (IACUC) of University of Louisville.
Alcian blue staining of low- and high-density micromass cultures of murine embryonic maxillary mesenchymal cells
Alcian blue staining of LD or HDM cultures of MEMM cells from either GD 12 or 13 or 14 embryos, was performed as described by Wang et al. (Wang et al., 2005). Briefly, cells were rinsed with PBS and fixed in 10% formaldehyde in PBS for 20 minutes. Cultures were then washed, stained in 1% Alcian blue 8GX (Sigma, St. Louis, MO) in 3% glacial acetic acid for 24 h, destained in 70% ethanol and stored in water before phase contrast photography.
Quantitative Alcian blue staining of high-density micromass cultures of MEMM cells
High density micromass (HDM) cultures of MEMM cells from either GD 12 or 13 or 14 embryos, were grown for five days as described above and were fixed in 10% formaldehyde containing 0.5% cetylpyridinium chloride for 20 minutes. Cultures of MEMM cells transfected with either pCMV-SPORT6-E2a plasmid or a control plasmid (pCMV-SPORT6) were washed with 3% acetic acid solution (pH 1.0), stained overnight with 1% Alcian blue 8GX (Sigma) in HCl (pH 1.0) and unbound stain removed by washing with 3% acetic acid solution (pH 1.0). Bound stain was extracted with 4M guanidine–HCl, 50 mM Tris–HCl, and 0.1% Chaps, pH 7.4, for 2 h at room temperature and optical density of the extracted dye was evaluated at 600 nm in a spectrophotometer (Ultrospec III, Pharmacia LKB).
Peanut agglutinin (PNA) staining of high-density micromass cultures of MEMM cells
High density micromass (HDM) cultures of MEMM cells from either GD 12 or 13 or 14 embryos, were grown on 4-well Lab-Tek® chamber slides (Nalge Nunc International, Rochester, NY) for five days as described above and were fixed in 10% paraformaldehyde for 20 min, rinsed, and incubated with Alexa Fluor® 488 conjugated peanut (Arachis hypogaea) agglutinin (1:100 dilution; Catalog# L-21409; Invitrogen) for 30 min at room temperature. Slides were washed with PBS, counterstained with 300nM of 4′-6′diamidino-2-phenylindole (DAPI, Molecular Probes) and mounted under Vectashield (Vector Labs, Inc., Burlington, CA) to preserve fluorescence. Cells were visualized and photographed with a Nikon Eclipse TE 2000-U microscope equipped with epifluorescence optics.
Immunolocalization
High density micromass (HDM) cultures of MEMM cells were grown on 4-well Lab-Tek® chamber slides (Nalge Nunc International). To demonstrate Sox9 protein expression, HDM spot cultures were fixed for 20 min in ice-cold methanol, washed with PBS, and permeabilized with 0.3% Triton-X-100-PBS for 5 min. Cells were then incubated in PBS–10% FBS-0.1% Triton-X-100-0.1%BSA for 5 min at room temperature to block nonspecific sites. Primary antibody to Sox9 (rabbit polyclonal antibody; Catalog# ab3697; Abcam Inc., Cambridge, MA) was diluted to 1:100 in 10% FBS-0.1% Triton-X-100-0.1%BSA in PBS and incubated overnight at 4°C in a humidified chamber. Following removal of primary antibody by repeated washing in PBS, slides were incubated with anti-rabbit IgG conjugated to Alexa Fluor 594 (1:200 dilution; Catalog# A-11012; Invitrogen) for 90 min at room temperature, washed with PBS, counterstained with 300nM of 4′-6′diamidino-2-phenylindole (DAPI, Molecular Probes) and mounted under Vectashield (Vector Labs) to preserve fluorescence. Cells were visualized and photographed with a Nikon Eclipse TE 2000-U microscope equipped with epifluorescence optics.
TaqMan Quantitative Real-Time PCR (QRT-PCR)
Total RNA from embryonic maxillary tissue dissected from GD 12, 13, or 14 embryos, or from LD or HDM cultures of MEMM cells, was isolated using the RNeasy Protect Mini Kit (Qiagen) following manufacturer's recommendations. The quality and quantity of extracted total RNAs were assessed by formaldehyde agarose gel electrophoresis and spectrophotometric UV absorbance at 260/280 nm, respectively. RNA was treated with DNase I in the presence of RNaseOUT (Invitrogen Life Technologies, Inc., Carlsbad, CA) to remove contaminating DNA before cDNA synthesis. cDNA was synthesized from total RNA using random hexamer primers and Superscript II reverse transcriptase (Invitrogen Life Technologies, Inc., Carlsbad, CA). QRT-PCR analysis was performed on a TaqMan ABI Prism 7000 Sequence Detector (Applied Biosystems; Foster City, CA). Primers and their corresponding fluorescence probes (Assays-on-Demand) were purchased from, Applied Biosystems. For each gene analyzed, both forward and reverse primers were used at a concentration of 900 nM and the final fluorescent probe concentration was 200 nM. The PCR reaction was performed in a total volume of 25 μl containing 0.2 mM each of dATP, dCTP, and dGTP, 0.4 mM dUTP, 0.625 unit of Amplitaq Gold (Applied Biosystems, UK) and 2 μl (8.0 ng) of cDNA template. Cycling parameters were: 50°C for 2 min for probe and primer activation, 95°C for 10 min for denaturation of DNA strands, 40 cycles of denaturation at 95°C for 15 s, and primer extension at 60°C for 1 min. For each reaction, a parallel reaction lacking template served as a negative control. Raw data were acquired and processed with ABI Sequence Detector System software, version 1.0 (Applied Biosystems, UK). mRNA amounts for each gene were normalized to GAPDH mRNA present in each sample.
Western blot analysis
Total protein was extracted from embryonic maxillary tissue from gestational day (GD) 12, 13, or 14 embryos or from LD or HDM cultures of MEMM cells and steady state levels of Id proteins determined by Western (immuno) blotting as previously described (Kusek et al., 2000). Protein was separated (50 μg/lane) by SDS–PAGE electrophoresis followed by electrophoretic transfer to PVDF membranes. To visualize proteins, and ensure the efficiency of transfer, gels were stained with Coomassie blue (Sasse and Gallagher, 1991) and membranes with 0.1% fast green, respectively. Blots were blocked by incubation in 5% non-fat dry milk in TBST buffer (50 mM Tris, pH 7.6; 150 mM NaCl; 0.1% Tween-20) for 1 h at room temperature. Antibodies (see below) were prepared by dilution in blocking solution and blots incubated with primary antibody for 2 h at room temperature, washed extensively, and then incubated for 0.5 h at room temperature with the appropriate horseradish peroxidase-conjugated secondary antibody. Immune complexes were detected using the ECL-Plus™ chemiluminescent detection system (Amersham Pharmacia Biotech, Piscataway, NJ) according to manufacturer's instructions. Molecular weights of proteins on each gel were estimated by reference to a MagicMark™ (20 – 200 kDa) protein ladder (Invitrogen). A methodological control, wherein buffer was utilized in place of primary antibody, was utilized to distinguish between specific immunoreactive bands and nonspecific bands due to interaction of the secondary antibody with endogenous proteins. Immunoblots of embryonic maxillary tissue were replicated with similar results utilizing a minimum of three complete sets of tissue samples. Commercially available primary antibodies utilized included: Id1 (C20) and Id4 (L20) polyclonal antibodies (Catalog# SC-488 and SC-491, respectively) from Santa Cruz Biotechnology, Inc. (Santa Cruz, CA), Id2 and Id3 mouse monoclonal antibodies (Catalog# 556523 and 556524, respectively) from BD-Pharmingen (BD Pharmingen™, BD Biosciences, San Jose, CA) and E2a/E47 monoclonal antibody (Catalog# SC-416; Santa Cruz). Secondary antibodies included: horseradish peroxidase-conjugated goat anti-rabbit IgG (catalog #81–6120) or horseradish peroxidase-conjugated rabbit anti-mouse IgG1 (catalog #61–0120), both from Zymed Laboratories (Zymed Laboratories, San Francisco, CA). To confirm equal loading of proteins, blots were stripped and reprobed for β-actin, a housekeeping protein.
Transfection of micromass cultures
The E2A gene is considered as the founder member of the vertebrate class I bHLH genes (Murre et al., 1989; Walker et al., 1990). Following dimerization with tissue-specific class II bHLH proteins, two alternative splice products of the E2A gene, the E47 and E12 bHLH transcription factor proteins, execute key roles in tissue-specific gene regulation (Murre et al., 1989; Engel and Murre, 1999; Massari and Murre 2000). The four Id HLH factors have also been reported to dimerize with the E2A proteins and negatively regulate their transcriptional activity (Benezra et al., 1990; Sun et al., 1991; Riechmann et al., 1994; Loveys et al., 1996). In addition, ectopic and co-expression of E47 protein have been shown to inhibit the physiological/cellular functions of Id proteins (Wilson et al., 2001; Norton and Atherton, 1998). An expression vector (pCMV-SPORT6-E2a) encoding the full-length mouse E2a/E47 protein, obtained from Open Biosystems (Open Biosystems, Huntsville, AL), was used to overexpress E2a/E47 protein in HDM cultures of MEMM cells. Transient transfection of 1.5 μg pCMV-SPORT6-E2a plasmid or a control plasmid (pCMV-SPORT6) was performed as described by Yu and Xing (Yu and Xing, 2006). Briefly, 100 μl of cell suspension (1 × 10⁶ cells) was mixed 2:1 (v/v) with the Effectine-DNA complex [lipophilic transfection reagent, Effectene (Qiagen Inc., Valencia, CA)], incubated at room temperature for 20 min, and then spotted in six-well tissue culture plates at a seeding density of 2 × 10⁵ cells per 10 μl spot. After a second incubation for 90 min at 37°C in an atmosphere of 95% air/5% CO2, cultures were flooded with 1 ml of fresh DMEM F-12 medium, incubated at 37°C in an atmosphere of 95% air/5% CO2 for 5 days, and then harvested for western blot analysis or Alcian blue staining.
Densitometric Analysis
Densitometric analyses of Id1, Id2, Id3, Id4 and β-actin protein bands were performed with Image J (version 1.38) software (Abramoff et al., 2004). The blots were scanned, analyzed by densitometry and the intensities of the β-actin bands were recorded and used as an internal control to correct for differences in sample loading. Densitometric data for each protein band of interest was normalized to that of β-actin in that lane by subtracting the intensity value for the specific protein band from the corresponding intensity value for the β-actin band for each sample.
Statistical Analyses
Statistical significance was determined by one-way ANOVA followed by Bonferroni's Multiple Comparison Test, using GraphPad Prism, v. 4.02 (GraphPad Software, Inc., San Diego, CA). P-values of <0.05 were considered significant. Each experiment was conducted at least three times with comparable results.
Results
Identification of Id mRNAs in extracts derived from murine embryonic maxillary tissue and from low- and high-density micromass cultures of MEMM cells
Total RNA from murine embryonic maxillary tissue (days 12, 13, and 14 of gestation), or from LD or HDM cultures of MEMM cells was analyzed by TaqMan® QRT-PCR. Significant levels of Id1, Id2, Id3 and Id4 mRNA were detected on each day of gestation examined (Fig. 1) as well as in LD and HDM cultures (Table II). Comparison of Ct values (Gibson et al., 1996) for each gene on each day of gestation that was examined, failed to reveal any statistically significant temporal changes in the expression of genes encoding any of the four Id isoforms. In contrast, comparison of the Ct values for each of the four Id genes obtained from HDM cultures of MEMM cells, revealed significantly reduced expression of Id1, Id2, Id3 and Id4 genes when compared to LD MEMM cell cultures (Fig. 2). The extent of reduction was approximately 6.0-fold for Id1 and Id4, and 1.5 to 2.0 fold for both Id2 and Id3 (Fig. 2). Genes encoding the chondrogenic marker proteins Type X collagen and Runx2, demonstrated significantly enhanced expression in HDM cultures of MEMM cells when compared to LD MEMM cell cultures (Fig. 2). Type X collagen is accepted as a marker of chondrogenesis (Mwale et al., 2006; Liu et al., 2004). Results from the study of Mwale et al. (2006), on the differentiation of human bone marrow-derived mesenchymal stem cells (MSC) into chondrocyte-like cells, demonstrated that Type X collagen is expressed as an early event - even before the expression of the early chondrogenic marker protein, Type II collagen. Ct values were representative of no less than three separate assays of unique RNA extracts from maxillary tissue on each of GD 12, 13, and 14, or from LD or HDM cultures of MEMM cells.
Figure 1.

Id1, Id2, Id3 and Id4 mRNA expression during murine orofacial morphogenesis. cDNA samples were prepared in triplicate from gestational day (GD) 12, 13, 14 embryonic orofacial tissue and subjected to TaqMan® quantitative real-time PCR (QRT-PCR) for each target gene using three independent tissue samples from each day of gestation. Ct values represent the number of cycles during the exponential phase of amplification necessary to reach a predetermined threshold level of PCR product as measured by fluorescence. The more template present at the start of a reaction, the fewer the cycles required to synthesize enough fluorescent product to be recorded as being statistically above background. Negative methodological control reactions, which lacked reverse transcriptase, did not amplify any detectable product. *Data presented represent Mean Ct ± standard deviation derived from triplicate determinations.
Table II.
Id1, Id2, Id3, and Id4 Protein Expression in Low Density (LD) and High-Density Micromass (HDM) Cultures of MEMM Cells.
| Type of Culture1 | Protein | Fold decrease in protein level (vs. LD samples)2 |
|---|---|---|
| LD | Id-1 | - |
| HDM | Id-1 | 2.17 ± 0.04 |
| LD | Id-2 | - |
| HDM | Id-2 | 1.51 ± 0.33 |
| LD | Id-3 | - |
| HDM | Id-3 | 4.13 ± 0.06 |
| LD | Id-4 | - |
| HDM | Id-4 | 2.52 ± 0.02 |
Steady state levels of Id1, Id2, Id3, and Id4 proteins were determined by immunoblot analysis (Fig. 4) of whole-cell extracts of low density (LD) and high-density micromass (HDM) cultures of MEMM cells.
Id1, Id2, Id3, and Id4 protein bands on immunoblots were densitometrically analyzed using the ImageJ (version 1.38) software, as described in the Materials and Methods section. Each immunoblot was representative of no less than three independent blots of unique extracts from low density (LD) and high-density micromass (HDM) cultures of MEMM cells. Blots were scanned, analyzed by densitometry and the intensities of the β-actin bands were recorded and used as an internal control to correct for differences in sample loading on gels. The densitometric data for each Id band was normalized to that of β-actin in that lane. Fold decrease was determined as follows: intensity of the Id band (from LD sample) / intensity of the Id band (from HDM sample). Data presented are average fold-decrease ± standard deviation from 3 separate experiments.
Figure 2.

Id1, Id2, Id3, Id4, Type X collagen and Runx2 mRNA expression in Low Density (LD) and High-Density Micromass (HDM) cultures of MEMM cells. cDNA samples were prepared from low density (LD) and high-density micromass (HDM) cultures of MEMM cells and subjected to TaqMan® quantitative real-time PCR (QRT-PCR) for each target gene. Analyses were performed in triplicate using three independent tissue samples from each type of culture. Ct values represent the number of cycles during the exponential phase of amplification necessary to reach a predetermined threshold level of PCR product as measured by fluorescence. The more template present at the start of a reaction, the fewer the cycles required to synthesize enough fluorescent product to be recorded as statistically above background. Negative methodological control reactions, which lacked reverse transcriptase, did not amplify any detectable product. All data were normalized to the amplification signal from the housekeeping gene, GAPDH i.e. the Ct value for each gene was subtracted from the corresponding GAPDH Ct value for each sample type. Fold-change values were determined according to the relationship: fold-change = 2-ΔΔCt, where Ct represents the threshold value for real-time PCR amplification detection, ΔCt the difference in Ct for the same probe:primer pair (e.g., Id1 or Id2 or Id3 etc.) on HDM samples vs. LD samples, and ΔΔCt = Δ Ct, sample − ΔCt, GAPDH (Livak and Schmittgen, 2001). Data presented represent fold-change ± standard deviation derived from triplicate determinations. Mean fold changes and standard deviations were calculated from triplicate samples, and compared by analysis of variance (ANOVA), followed by Student's t test. *P values <0.05 were considered statistically significant.
Alcian blue staining of low- and high-density micromass cultures of MEMM cells
Alcian blue staining enabled detection of chondrogenic nodules in HDM cultures of MEMM cells derived from all three days of gestation (GD 12, 13 and 14; Figs. 3a, 3b and 3c). This highlights the chondrogenic potential of cells of the developing murine maxillary mesenchyme. In contrast, chondrogenesis was not evident in LD cultures of MEMM cells derived from either GD 12, 13 or 14 maxillary tissue (Figs. 3d, 3e and 3f).
Figure 3.

Alcian blue staining of high-density micromass (HDM) and low density (LD) cultures of cells derived from murine embryonic maxillary mesenchymal tissue on gestational days (GD) 12 (a), GD-13 (b), or GD-14 (c). Chondrogenic nodules (white arrows) are visible in all HDM cultures whereas chondrogenesis is absent in low density (LD) cultures of embryonic maxillary mesenchymal cells derived from the gestational days (GD) 12 (d), GD-13 (e) and GD-14 (f) orofacial tissue. Result from one out of three independent sets of experiments is shown in the figure.
Peanut agglutinin (PNA) staining of high-density micromass cultures of MEMM cells
Chondrogenic potential of MEMM cells derived from all three days of gestation (GD 12, 13 and 14) was also examined via staining with peanut agglutinin (PNA), a lectin, that has been shown to specifically bind a cell surface marker(s) on condensing chondroprogenitor cells (Zimmermann and Thies, 1984; Milaire, 1991). Micromass cultures of MEMM cells derived from either GD 12, 13 or 14 maxillary tissue, were intensely stained with PNA – demonstrating PNA-positive chondrogenic condensations (Figs. 4a, 4b and 4c). Similar PNA and Alcian blue staining patterns provided support for the chondrogenic potential of maxillary mesenchymal cells derived from the developing orofacial region (Figs. 4d, 4e and 4f).
Figure 4.

Peanut Agglutinin (PNA) staining of high-density micromass (HDM) cultures of cells derived from murine embryonic maxillary mesenchymal tissue on gestational days (GD) 12 (a), GD-13 (b), or GD-14 (c). HDM cultures of cells were fixed, and incubated with AlexaFlour 488-conjugated PNA. Panels a, b and c represent the immunofluorescent images demonstrating intense staining of chondrogenic cells derived from the murine embryonic maxillary mesenchymal tissue. The corresponding Alcian blue staining of high-density micromass (HDM) of cells derived from murine embryonic maxillary mesenchymal tissue on gestational days (GD) 12 (a), GD-13 (b), or GD-14 (c) are shown in panels (d), (e) and (f), respectively. Result from one out of three independent sets of experiments is shown in the figure.
Quantitative Alcian blue staining of high-density micromass cultures of MEMM cells
Spectrophotometric estimation of Alcian blue staining of HDM cultures of MEMM cells derived from all three days of gestation indicated steady increase in chondrogenesis in the developing murine orofacial tissue (GD 12 – 14) (Fig. 5).
Figure 5.

Quantitative Alcian blue staining of high-density micromass (HDM) cultures of cells derived from murine embryonic maxillary mesenchymal tissue on gestational days (GD) 12, GD-13, and GD-14 embryos. Optical density of the extracted dye was evaluated at 600 nm in a spectrophotometer (Ultrospec III, Pharmacia LKB). Data presented are from three independent experiments and shown as mean ± SD. *P values <0.05 were considered statistically significant.
Immunolocalization of Sox9 in high-density micromass cultures of MEMM cells
Immunofluorescent staining of high-density micromass cultures of MEMM cells with a Sox9 polyclonal antibody (Abcam Inc.) revealed expression of the pro-chondrogenic transcription factor Sox9 localized and restricted to chondrogenic nodules (Figs. 6c and 6f).
Figure 6.

Immunolocalization of Sox9 protein in high-density micromass (HDM) cultures of MEMM cells derived from murine embryonic maxillary mesenchymal tissue on gestational day (GD) 13. HDM cultures of MEMM cells were fixed, permeabilized, and incubated with anti-Sox9 antibody, followed by incubation with an Alexa Fluor 594-conjugated secondary antibody. Panels a, d and g represent brightfield images while matching images representing DAPI staining of chondrogenic nodules are shown in panels b, e and h. Panels c and f represent the corresponding immunofluorescent images demonstrating localized expression of Sox9 to chondrogenic nodules. Panel i represents a methodological “control” wherein primary antibody was omitted from the immunostaining procedure. The upper (a,b,c) and lower (d,e,f) panels stand for two representative regions of the HDM culture. Result from one out of three independent sets of experiments is shown in the figure.
Identification of Id proteins in extracts derived from murine embryonic maxillary tissue and from low density and high-density micromass cultures of MEMM cells
Steady state levels of Id1, Id2, Id3 and Id4 proteins were detected by immunoblotting. Single 15 kDa bands for Id1 and Id2, 13 kDa for Id3, and 20 kDa for Id4, were detected on immunoblots of maxillary tissue extracts from GD 12, 13, and 14 embryos, and also from LD and HDM cultures of MEMM cells (Figs. 7 and 8). These results indicate that all the Id isoforms are expressed in embryonic maxillary tissue in vivo during murine gestational days 12-14 as well as in LD and HDM cultures of MEMM cells. Furthermore, all four Id proteins exhibited reduced expression in the embryonic maxillary mesenchyme as development proceeded from gestational days 12 to 14 (Fig. 7 and Table I). HDM cultures of MEMM cells displayed lower levels of Id expression when compared to LD cultures (Fig. 8 and Table II).
Figure 7.
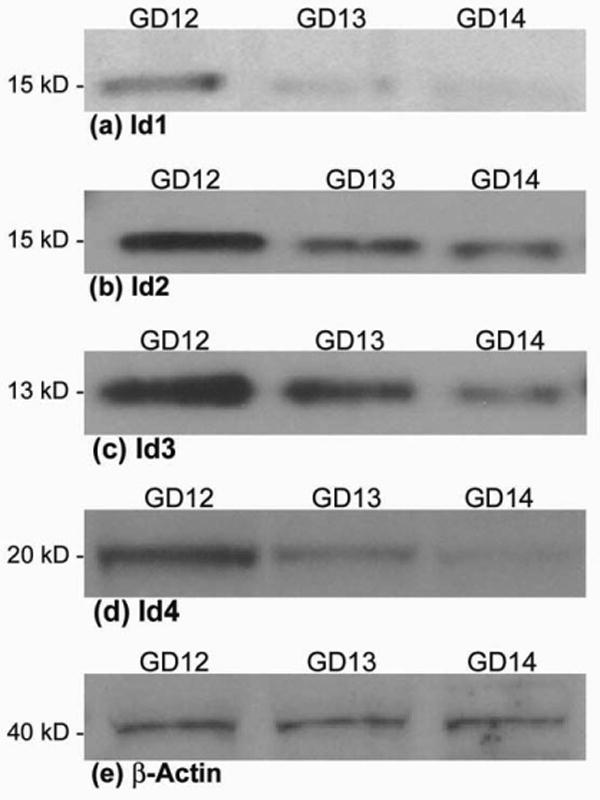
Immunoblots demonstrating steady state levels of Id1 (a), Id2 (b), Id3 (c), and Id4 (d) proteins in whole-cell extracts derived from murine embryonic maxillary mesenchymal tissue on gestational days (GD) 12, 13, and 14 of development. Equal amounts of protein (50 μg) were resolved by SDS-PAGE on 12% polyacrylamide bis-tris gels, transferred to PVDF membranes, probed with Id-specific antibodies and immunoreactive species detected by chemiluminescence, as detailed in the Materials and Methods. Molecular weights of the marker proteins are indicated to the left of each panel. The Id1 and Id2 antibodies both detected a single protein band of 15 kDa, the Id3 antibody detected a single protein band of 13 kDa, whereas the Id4 antibody detected a single protein band of 20 kDa. Each immunoblot is representative of no less than three independent blots of unique tissue extracts from embryonic maxillary mesenchyme tissue from each of GD 12, 13, and 14. Panel (e) shows the immunoblot of the β-actin loading control.
Figure 8.

Immunoblots demonstrating steady state levels of Id1 (a), Id2 (b), Id3 (c), and Id4 (d) proteins in whole-cell extracts of low density (LD) and high-density micromass (HDM) cultures of cells derived from murine embryonic maxillary mesenchymal tissue on gestational day (GD) 13 of development. Equal amounts of protein (50 μg) were resolved by SDS-PAGE on 12% polyacrylamide bis-tris gels, transferred to PVDF membranes, probed with Id-specific antibodies and immunoreactive species detected by chemiluminescence, as detailed in the Materials and Methods. Molecular weights of the marker proteins are indicated to the left of each panel. The Id1 and Id2 antibodies both detected a single protein band of 15 kDa, the Id3 antibody detected a single protein band of 13 kDa, whereas the Id4 antibody detected a single protein band of 20 kDa. Each immunoblot is representative of no less than three independent blots of unique tissue extracts from LD and HDM cultures of MEMM cells derived from the gestational days (GD) 13 orofacial tissue. Panel (e) shows the immunoblot of the β-actin loading control.
Table I.
Id1, Id2, Id3, and Id4 Protein Expression in Murine Embryonic Maxillary Mesenchymal Tissue.
| Developmental Stage1 | Protein | Fold decrease in protein level (vs. GD-12 samples)2 |
|---|---|---|
| GD-12 | Id-1 | - |
| GD-13 | Id-1 | 2.02 ± 0.15 |
| GD-14 | Id-1 | 3.84 ± 0.05 |
| GD-12 | Id-2 | - |
| GD-13 | Id-2 | 2.16 ± 0.08 |
| GD-14 | Id-2 | 3.49 ± 0.14 |
| GD-12 | Id-3 | - |
| GD-13 | Id-3 | 2.29 ± 0.15 |
| GD-14 | Id-3 | 4.71 ± 0.22 |
| GD-12 | Id-4 | - |
| GD-13 | Id-4 | 2.47 ± 0.08 |
| GD-14 | Id-4 | 3.56 ± 0.21 |
Steady state levels of Id1, Id2, Id3, and Id4 proteins were determined by immunoblot analysis (Fig. 3) of whole-cell extracts derived from murine embryonic maxillary mesenchymal tissue on gestational days (GD) 12, 13, and 14 of development.
Id1, Id2, Id3, and Id4 protein bands on immunoblots were densitometrically analyzed using the ImageJ (version 1.38) software, as described in the Materials and Methods section. Each immunoblot was representative of no less than three independent blots of unique extracts from maxillary mesenchymal tissue on gestational days (GD) 12, 13, and 14. Blots were scanned, analyzed by densitometry and the intensities of the β-actin bands were recorded and used as an internal control to correct for differences in sample loading on gels. The densitometric data for each Id band was normalized to that of β-actin in that lane. Fold decrease was determined as follows: intensity of the Id band (from GD-12 sample) / intensity of the Id band (from either GD-13 or GD-14 sample). Data presented are average fold-decrease ± standard deviation from 3 separate experiments.
Overexpression of E2a/E47 in micromass cultures of MEMM cells
Transfection of high density micromass (HDM) cultures of MEMM cells with the expression vector pCMV-SPORT6-E2a, encoding full-length mouse E2a/E47, resulted in overexpression of the protein and significant upregulation (>5.0-fold) of the gene encoding E2a/E47 as revealed by immunoblotting with a E2a/E47 mouse monoclonal antibody (Santa Cruz Biotechnology) and TaqMan QRTPCR, respectively (Fig. 9 and Table III). Alcian blue staining demonstrated formation of chondrogenic nodules in HDM cultures of MEMM cells overexpressing the Id-binding protein E2a/E47 (Figs. 10a and 10c). Chondrogenesis was less evident in HDM cultures of MEMM cells transfected with empty vector (Figs. 10b and 10d). Spectrophotometric estimation of Alcian blue staining of HDM cultures of MEMM cells transfected with either pCMV-SPORT6-E2a plasmid or a control plasmid (pCMV-SPORT6) demonstrated a 19% increase in chondrogenesis in MEMM cells overexpressing E2a (Fig 11). Genes encoding the chondrogenic marker proteins Type II collagen, Sox9, Link Protein 1 (LP1), Aggrecan, Type X collagen and Runx2, demonstrated enhanced expression in HDM cultures of MEMM cells transfected with pCMV-SPORT6-E2a when compared to HDM cultures of MEMM cells transfected with the empty vector (Table III). Expression of genes encoding the Id proteins Id1, Id2, Id3 and Id4, were found to be differentially regulated in HDM cultures of MEMM cells transfected with pCMV-SPORT6-E2a. The gene encoding Id1 was significantly upregulated, whereas the genes encoding Id2 and Id4 were down regulated in HDM cultures of MEMM cells overexpressing E2a/E47 mRNA and protein (Table III). The gene encoding Id3 did not demonstrate any significant change in expression between HDM cultures of cells transfected with pCMV-SPORT6-E2a or the control plasmid (Table III). Ct values were representative of no less than three separate assays of unique RNA extracts from HDM cultures of MEMM cells transfected with either pCMV-SPORT6-E2a plasmid or the control plasmid (pCMV-SPORT6).
Figure 9.

Immunoblot demonstrating expression of E2a/E47 protein in high-density micromass (HDM) cultures of MEMM cells derived from murine embryonic maxillary mesenchymal tissue on gestational day (GD) 13. Cell extracts of HDM cultures of MEMM cells (transfected independently with either the plasmid encoding the full-length E2a/E47 protein or the empty vector) were prepared and equal amounts of protein (50 μg) were resolved by SDS-PAGE on 8% polyacrylamide Tris/glycine gels, transferred to PVDF membranes, probed with a E2a/E47 antibody and immunoreactive species detected by chemiluminescence, as detailed in the Methods. Lane 1 represents an immunoblot of an extract prepared from HDM cultures of MEMM cells transfected with 1.0 μg of empty vector. Lanes 2, 3, and 4 represent immunoblots of extracts prepared from HDM cultures of MEMM cells transfected with 1.0 μg, 1.5 μg and 2.0 μg, respectively, of plasmid encoding the full-length E2a/E47 protein. The molecular weight of the protein identified is indicated to the left of the panel. Each immunoblot is representative of no less than three independent blots of unique cell extracts from MEMM cells transfected with either the empty vector or various concentrations of the plasmid encoding E2a/E47. Lower panel shows one representative western blot of the loading control β-actin.
Table III.
Expression of Ids and Chondrogenic Marker Protein mRNA expression in pCMV-Sport6-E2a plasmid and a control plasmid (pCMV-SPORT6; empty vector) Transfected Micromass (HDM) Cultures of MEMM Cells.
| Type of Culture1 | Gene | Mean Ct2,3* | Fold Change4 (vs. C-HDM)* |
|---|---|---|---|
| E2a-HDM | E2a-E47 | 24.03 | (+)5.1 ± 0.12 |
| C-HDM | E2a-E47 | 26.37 | - |
| E2a-HDM | Id-1 | 28.58 | (+)1.53 ± 0.10 |
| C-HDM | Id-1 | 29.18 | - |
| E2a-HDM | Id-2 | 28.66 | (-)1.41 ± 0.05 |
| C-HDM | Id-2 | 28.15 | - |
| E2a-HDM | Id-3 | 26.23 | No change |
| C-HDM | Id-3 | 26.23 | - |
| E2a-HDM | Id-4 | 26.68 | (-)1.45 ± 0.03 |
| C-HDM | Id-4 | 26.41 | - |
| E2a-HDM | Type II collagen | 28.05 | (+)1.35 ± 0.06 |
| C-HDM | Type II collagen | 28.45 | - |
| E2a-HDM | Type X collagen | 28.36 | (+) 1.26 ± 0.04 |
| C-HDM | Type X collagen | 28.69 | - |
| E2a-HDM | LP-1 | 29.45 | (+)1.26 ± 0.11 |
| C-HDM | LP-1 | 29.77 | - |
| E2a-HDM | Aggrecan | 27.26 | (+)1.30 ± 0.04 |
| C-HDM | Aggrecan | 27.64 | - |
| E2a-HDM | Sox9 | 23.69 | (+)1.31 ± 0.02 |
| C-HDM | Sox9 | 24.08 | - |
| E2a-HDM | Runx2 | 24.39 | (+)1.30 ± 0.03 |
| C-HDM | Runx2 | 24.83 | - |
cDNA samples were prepared from pCMV-Sport6-E2a plasmid (E2a-HDM) and the control plasmid (pCMV-SPORT6) (C-HDM) transfected micromass (HDM) cultures of MEMM Cells and subjected to TaqMan® quantitative real-time PCR (QRT-PCR) for each target gene. Analyses were performed in triplicate using three independent tissue samples from each type of culture.
Ct values represent the number of cycles during the exponential phase of amplification necessary to reach a predetermined threshold level of PCR product as measured by fluorescence. The more template present at the start of a reaction, the fewer the cycles required to synthesize enough fluorescent product to be recorded as statistically above background.
Negative methodological control reactions, which lacked reverse transcriptase, did not amplify any detectable product.
All data were normalized to the amplification signal from the housekeeping gene, GAPDH i.e. the Ct value for each gene was subtracted from the corresponding GAPDH Ct value for each sample type. Fold-change values were determined according to the relationship: fold-change = 2-ΔΔCt, where Ct represents the threshold value for real-time PCR amplification detection, ΔCt the difference in Ct for the same probe:primer pair (e.g., Id1 or Id2 or Id3 etc.) on E2a-HDM samples vs. C-HDM samples, and ΔΔCt = Δ Ct, sample − ΔCt, GAPDH (Livak and Schmittgen, 2001).
Data presented represent Mean Ct ± standard deviation or fold-change ± standard deviation derived from triplicate determinations. (+) and (-) indicate up and down regulation of gene expression, respectively.
Figure 10.

Alcian blue staining of high-density micromass (HDM) cultures of MEMM cells overexpressing the Id-binding protein E2a/E47. Transient transfection of HDM cultures of MEMM cells with 1.5 μg pCMV-SPORT6-E2a plasmid or a control plasmid (pCMV-SPORT6; empty vector) was performed as described by Yu and Xing (Yu and Xing, 2006). Chondrogenic nodules (yellow arrows) are clearly visible in HDM cultures of MEMM cells overexpressing E2a/E47 protein (a and c) and evident to a lesser extent in HDM cultures of MEMM cells transfected with the empty vector (b and d). The upper and lower panels are two representative regions of the E2a-overexpressing [panels (a) and (c)] and empty vector-transfected [panels (b) and (d)] HDM cultures of MEMM cells. Result from one out of three independent sets of experiments is shown in the figure.
Figure 11.

Quantitative Alcian blue staining of high-density micromass (HDM) cultures of cells overexpressing the Id-binding protein E2a/E47. Optical density of the extracted dye was evaluated at 600 nm in a spectrophotometer (Ultrospec III, Pharmacia LKB). Data presented are from three independent experiments and shown as mean ± SD. *P values <0.05 were considered statistically significant.
Discussion
The dominant-negative helix-loop-helix Id proteins have been implicated in the regulation of cell proliferation and in myogenic, neurogenic and hematopoietic differentiation (Iavarone et al., 1994; Chaudhary et al., 2005; Chen et al., 1997; Ghil et al., 2002; Buitenhuis et al., 2005). During post-gastrulational mouse development Id1, 2, and 3 are expressed in multiple tissues, whereas Id4 expression can only be detected in neuronal tissues and in the ventral portion of the epithelium of the developing stomach (Jen et al., 1996). These differential patterns of expression suggest non-redundant physiological functions for Id HLH factors during embryogenesis.
Inhibitors of differentiation (Id) transcription factors function as crucial regulators of chondrogenesis (Asp et al., 1998; Karlsson et al., 2007; Ali-Khan and Hales 2006). ID1 and ID3 have been shown to inhibit differentiation in human chondrocytes (Asp et al., 1998), and the expression of ID1 was shown to be reduced in human articular chondrocytes (Karlsson et al., 2007). Under conditions of retinol-induced hypochondrogenesis in murine limb buds, Id3 expression was significantly increased (Ali-Khan and Hales 2006), and it was hypothesized that retinol-mediated overexpression of Id3 was perturbing differentiation of pre-chondrocytes. Chondrogenesis has previously been documented in micromass cultures of cells from the embryonic murine (Ralphs, 1992) and avian (Wedden et al, 1986) frontonasal and maxillary mesenchyme, as well as in high density cultures of murine embryonic palate mesenchymal cells (Yu and Xing, 2006). The present study demonstrates the chondrogenic potential of cells of the murine embryonic maxillary mesenchyme (MEMM). Chondrogenic nodules were seen in high density micromass (HDM) cultures of MEMM cells derived from embryos from each of gestational days 12-14. Staining of MEMM cells (corresponding to all three days of gestation: GD 12, 13 and 14) with condensing chondroprogenitor cell specific stains such as PNA and Alcian blue, provides supporting evidence for the chondrogenic potential of the maxillary mesenchymal cells of the developing orofacial region.
Sox9, a key transcriptional regulator of cartilage differentiation, has been reported to be expressed in cells undergoing chondrogenesis (Wang et al., 1996; Bi et el., 1999). Absence of Sox9 led to complete inhibition of chondrocyte differentiation whereas its haploinsufficiency resulted in formation of defective cartilage primordia and premature mineralization in cranial bones (de Crombrugghe et al., 2000; Bi et al., 2001). In the present study, immunostaining of HDM cultures of MEMM cells with a Sox9 antibody revealed localized and restricted expression within chondrogenic nodules. This observation provides further support for the chondrogenic potential of MEMM cells.
Genes encoding all the Id isoforms (Id1-4) were shown to be expressed in embryonic maxillary tissue in vivo during gestational days 12-14 as well as in LD and HDM cultures of MEMM cells. Each of the Id proteins exhibited a temporal reduction in expression over the time course examined. Moreover, levels of Id 1, 2, 3 and 4 mRNA and protein, were significantly reduced in HDM cultures of MEMM cells when compared to cells grown under LD conditions. In contrast, genes encoding two chondrogenic marker proteins, Type X Collagen and Runx2, demonstrated significantly increased expression in “chondrogenic” HDM cultures when compared to cells grown under LD conditions. These results are in agreement with prior observations (as discussed above) that in a high density micromass environment, Id HLH factors undergo downregulation of expression concomitant with chondrogenic differentiation.
Id HLH proteins lacking a basic motif, dimerize with bHLH proteins inhibiting their DNA binding activity in vitro, resulting in loss of transcriptional activation by the bHLH factors in vivo (Benezra et al., 1990; Garrell and Modolell, 1990). Two classes of bHLH proteins have been reported. One class, termed E proteins, are ubiquitously expressed and bind DNA as either homodimers or heterodimers. This class is represented by E12 and E47 (splice variants of the E2A gene), in addition to the closely related genes E2-2 and ALF1/HEB (Henthorn P et al., 1990; Nielsen et al., 1992). Basic HLH proteins with restricted expression pattern constitutes the second class, exemplified by MyoD in skeletal muscle (Heidt et al., 2007), TAL1/SCL in hematopoietic cells (Nielsen et al., 1996) and MASH1 in neural tissue (Johnson et al., 1992)—all of which have been reported to heterodimerize with an E protein for functional activity (Heidt et al., 2007; Nielsen et al., 1996; Johnson et al., 1992). All four Id proteins have been reported to form heterodimers with the E2A gene products (E12 and E47), thereby inhibiting DNA binding activity of these E-proteins (Sun et al., 1991; Riechmann et al., 1994; Loveys et al., 1996). Sequestration of endogenous Id proteins in human adenocarcinoma cell lines via ectopic expression of the E47 bHLH protein, resulted in growth arrest (Wilson et al., 2001). Co-expression of the E47 protein has also been shown to reverse Id3-induced cell proliferation and apoptosis in rat and mouse embryonic fibroblasts (Norton et al., 1998). To confirm a role for the Ids in maxillary mesenchymal chondrogenesis, in the current study, Id function was inhibited via overexpression of a basic HLH (bHLH) factor, E2a/E47. Increased chondrogenesis was evident in HDM cultures of MEMM cells overexpressing the Id-binding protein E2a/E47. The expression of various chondrogenic marker proteins were also found to be affected in HDM cultures of MEMM cells overexpressing E2a/E47. This observation is consistent with the hypothesis that elevated levels of E2a/E47 diminished the inhibitory influence of Id proteins on chondrogenesis, allowing the chondrogenic potential of these cells to be expressed.
Data presented in the current study reinforce the notion that embryonic maxillary mesenchymal cells possess chondrogenic potential and, for the first time, demonstrate the expression of all four Id proteins in cells derived from developing orofacial tissue. Moreover, this study demonstrates the ability of HLH proteins to regulate chondrogenesis in these cells.
Acknowledgments
This research was supported in part by NIH grants HD053509, DE018215, the Commonwealth of Kentucky Research Challenge Trust Fund, and P20RR017702 from the COBRE Program of the National Center for Research Resources.
Footnotes
Publisher's Disclaimer: This is a PDF file of an unedited manuscript that has been accepted for publication. As a service to our customers we are providing this early version of the manuscript. The manuscript will undergo copyediting, typesetting, and review of the resulting proof before it is published in its final citable form. Please note that during the production process errors may be discovered which could affect the content, and all legal disclaimers that apply to the journal pertain.
References
- Abe J. Bone morphogenetic protein (BMP) family, SMAD signaling and Id helix-loop-helix proteins in the vasculature: the continuous mystery of BMPs pleotropic effects. J Mol Cell Cardiol. 2006;41:4–7. doi: 10.1016/j.yjmcc.2006.04.012. [DOI] [PubMed] [Google Scholar]
- Abramoff MD, Magelhaes PJ, Ram SJ. Image Processing with Image. J Biophotons Int. 2004;11:36–42. [Google Scholar]
- Ali-Khan SE, Hales BF. Novel retinoid targets in the mouse limb during organogenesis. Toxicol Sci. 2006;94:139–152. doi: 10.1093/toxsci/kfl037. [DOI] [PubMed] [Google Scholar]
- Asp J, Thornemo M, Inerot S, Lindahl A. The helix-loop-helix transcription factors Id1 and Id3 have a functional role in control of cell division in human normal and neoplastic chondrocytes. FEBS Lett. 1998;438:85–90. doi: 10.1016/s0014-5793(98)01268-x. [DOI] [PubMed] [Google Scholar]
- Atherton G, Travers H, Deed R, Norton JD. Regulation of cell differentiation in C2C12 myoblasts by the ID3 helix-loop-helix protein. Cell Growth Diff. 1996;7:1059–1066. [PubMed] [Google Scholar]
- Benezra R, Davis RL, Lockshon D, Turner DL, Weintraub H. The protein Id: a negative regulator of helix-loop-helix DNA binding proteins. Cell. 1990;61:49–59. doi: 10.1016/0092-8674(90)90214-y. [DOI] [PubMed] [Google Scholar]
- Bi W, Deng JM, Zhang Z, Behringer RR, de Crombrugghe B. Sox9 is required for cartilage formation. Nat Genet. 1999;22:85–89. doi: 10.1038/8792. [DOI] [PubMed] [Google Scholar]
- Bi W, Huang W, Whitworth DJ, Deng JM, Zhang Z, Behringer RR, de Crombrugghe B. Haploinsufficiency of Sox9 results in defective cartilage primordia and premature skeletal mineralization. Proc Natl Acad Sci USA. 2001;98:6698–6703. doi: 10.1073/pnas.111092198. [DOI] [PMC free article] [PubMed] [Google Scholar]
- Buitenhuis M, van Deutekom HW, Verhagen LP, Castor A, Jacobsen SE, Lammers JW, Koenderman L, Coffer PJ. Differential regulation of granulopoiesis by the basic helix-loop-helix transcriptional inhibitors Id1 and Id2. Blood. 2005;105:4272–4281. doi: 10.1182/blood-2004-12-4883. [DOI] [PubMed] [Google Scholar]
- Chaudhary J, Sadler-Riggleman I, Ague JM, Skinner MK. The helix-loop-helix inhibitor of differentiation (ID) proteins induce post-mitotic terminally differentiated Sertoli cells to re-enter the cell cycle and proliferate. Biol Reprod. 2005;72:1205–1217. doi: 10.1095/biolreprod.104.035717. [DOI] [PubMed] [Google Scholar]
- Chen B, Han BH, Sun XH, Lim RW. Inhibition of muscle-specific gene expression by Id3: requirement of the C-terminal region of the protein for stable expression and function. Nucleic Acids Res. 1997;25:423–430. doi: 10.1093/nar/25.2.423. [DOI] [PMC free article] [PubMed] [Google Scholar]
- de Crombrugghe B, Lefebvre V, Behringer RR, Bi W, Murakami S, Huang W. Transcriptional mechanisms of chondrocyte differentiation. Matrix Biol. 2000;19:389–394. doi: 10.1016/s0945-053x(00)00094-9. [DOI] [PubMed] [Google Scholar]
- Delise AM, Tuan RS. Analysis of N-cadherin function in limb mesenchymal chondrogenesis in vitro. Dev Dyn. 2002;225:195–204. doi: 10.1002/dvdy.10151. [DOI] [PubMed] [Google Scholar]
- Desprez PY, Hara E, Bissell MJ, Campisi J. Suppression of mammary epithelial cell differentiation by the helix-loop-helix protein, ID1. Mol Cell Biol. 1995;15:3398–3404. doi: 10.1128/mcb.15.6.3398. [DOI] [PMC free article] [PubMed] [Google Scholar]
- Desprez PY, Lin CQ, Thomasset N, Sympson CJ, Bissell MJ, Campisi J. A novel pathway for mammary epithelial cell invasion induced by the helix-loop-helix protein, ID1. Mol Cell Biol. 1998;18:4577–4588. doi: 10.1128/mcb.18.8.4577. [DOI] [PMC free article] [PubMed] [Google Scholar]
- Engel I, Murre C. Transcription factors in hematopoiesis. Curr Opin Genet Dev. 1999;9:575–579. doi: 10.1016/s0959-437x(99)00008-8. [DOI] [PubMed] [Google Scholar]
- Garrell J, Modolell J. The Drosophila extramacrochaetae locus, an antagonist of proneural genes that, like these genes, encodes a helix–loop–helix protein. Cell. 1990;61:39–48. doi: 10.1016/0092-8674(90)90213-x. [DOI] [PubMed] [Google Scholar]
- Ghil SH, Jeon YJ, Suh-Kim H. Inhibition of BETA2/NeuroD by Id2. Exp Mol Med. 2002;34:367–373. doi: 10.1038/emm.2002.52. [DOI] [PubMed] [Google Scholar]
- Gibson UE, Heid CA, Williams PM. A novel method for real time quantitative RT-PCR. Genome Res. 1996;6:995–1001. doi: 10.1101/gr.6.10.995. [DOI] [PubMed] [Google Scholar]
- Goldring MB, Tsuchimochi K, Ijiri K. The control of chondrogenesis. J Cell Biochem. 2006;97:33–44. doi: 10.1002/jcb.20652. [DOI] [PubMed] [Google Scholar]
- Gotting C, Prante C, Kuhn J, Kleesiek K. Proteoglycan biosynthesis during chondrogenic differentiation of mesenchymal stem cells. ScientificWorldJournal. 2007;7:1207–1210. doi: 10.1100/tsw.2007.231. [DOI] [PMC free article] [PubMed] [Google Scholar]
- Heidt AB, Rojas A, Harris IS, Black BL. Determinants of myogenic specificity within MyoD are required for noncanonical E box binding. Mol Cell Biol. 2007;27:5910–5920. doi: 10.1128/MCB.01700-06. [DOI] [PMC free article] [PubMed] [Google Scholar]
- Henthorn P, Kiledjian M, Kadesch T. Two distinct transcription factors that bind the immunoglobulin enhancer microE5/kappa 2 motif. Science. 1990;247:467–470. doi: 10.1126/science.2105528. [DOI] [PubMed] [Google Scholar]
- Iavarone A, Garg P, Lasorella A, Hsu J, Israel MA. The helix-loop-helix protein ID2 enhances cell proliferation and binds to the Retinoblastoma protein. Genes and Dev. 1994;8:1270–1284. doi: 10.1101/gad.8.11.1270. [DOI] [PubMed] [Google Scholar]
- Johnson JE, Zimmerman K, Saito T, Anderson DJ. Induction and repression of mammalian achaete-scute homologue (MASH) gene expression during neuronal differentiation of P19 embryonal carcinoma cells. Development. 1992;114:75–87. doi: 10.1242/dev.114.1.75. [DOI] [PubMed] [Google Scholar]
- Karlsson C, Brantsing C, Svensson T, Brisby H, Asp J, Tallheden T, Lindahl A. Differentiation of human mesenchymal stem cells and articular chondrocytes: analysis of chondrogenic potential and expression pattern of differentiation-related transcription factors. J Orthop Res. 2007;25:152–163. doi: 10.1002/jor.20287. [DOI] [PubMed] [Google Scholar]
- Kawakami Y, Rodriguez-Leon J, Belmonte JC. The role of TGFbetas and Sox9 during limb chondrogenesis. Curr Opin Cell Biol. 2006;18:723–729. doi: 10.1016/j.ceb.2006.10.007. [DOI] [PubMed] [Google Scholar]
- Kusek J, Greene R, Nugent P, Pisano M. Expression of the E2F family of transcription factors during murine development. Int J Dev Biol. 2000;44:267–277. [PubMed] [Google Scholar]
- Liu CJ, Prazak L, Fajardo M, Yu S, Tyagi N, Di Cesare PE. Leukemia/lymphoma-related factor, a POZ domain-containing transcriptional repressor, interacts with histone deacetylase-1 and inhibits cartilage oligomeric matrix protein gene expression and chondrogenesis. J Biol Chem. 2004;279:47081–47091. doi: 10.1074/jbc.M405288200. [DOI] [PubMed] [Google Scholar]
- Livak KJ, Schmittgen TD. Analysis of relative gene expression data using real-time quantitative PCR and the 2-ΔΔCt method. Methods. 2001;25:402–408. doi: 10.1006/meth.2001.1262. [DOI] [PubMed] [Google Scholar]
- Loveys DA, Streiff MB, Kato GJ. E2A basic-helix-loop-helix transcription factors are negatively regulated by serum growth factors and by the Id3 protein. Nucleic Acids Res. 1996;24:2813–2820. doi: 10.1093/nar/24.14.2813. [DOI] [PMC free article] [PubMed] [Google Scholar]
- Lyden D, Young AZ, Zagzag D, Yan W, Gerald W, O'Reilly R, Bader BL, Hynes RO, Zhuang Y, Manova K, Benezra R. Id1 and Id3 are required for neurogenesis, angiogenesis and vascularisation of tumour xenografts. Nature. 1999;401:670–677. doi: 10.1038/44334. [DOI] [PubMed] [Google Scholar]
- Massari ME, Murre C. Helix-loop-helix proteins: regulators of transcription in eukaryotic organisms. Mol Cell Biol. 2000;20:429–440. doi: 10.1128/mcb.20.2.429-440.2000. [DOI] [PMC free article] [PubMed] [Google Scholar]
- Milaire J. Lectin binding sites in developing mouse limb buds. Anat Embryol (Berl) 1991;184:479–488. doi: 10.1007/BF01236054. [DOI] [PubMed] [Google Scholar]
- Mukhopadhyay P, Greene RM, Zacharias W, Weinrich MC, Singh S, Young WW, Pisano MM. Developmental gene expression profiling of mammalian fetal oro/facial tissue. Birth Defects Res A Clin Mol Teratol. 2004;70:912–926. doi: 10.1002/bdra.20095. [DOI] [PubMed] [Google Scholar]
- Mukhopadhyay P, Singh S, Greene RM, Pisano MM. Molecular fingerprinting of BMP2- and BMP4-treated embryonic maxillary mesenchymal cells. Orthod Craniofac Res. 2006;9:93–110. doi: 10.1111/j.1601-6343.2006.00356.x. [DOI] [PubMed] [Google Scholar]
- Mukhopadhyay P, Webb CL, Greene RM, Pisano MM. BMP signaling dynamics in embryonic orofacial tissue. J Cell Physiol. 2008;216:771–779. doi: 10.1002/jcp.21455. [DOI] [PMC free article] [PubMed] [Google Scholar]
- Murre C, McCaw PS, Baltimore D. A new DNA binding and dimerization motif in immunoglobulin enhancer binding, daughterless, MyoD, and myc proteins. Cell. 1989;56:777–783. doi: 10.1016/0092-8674(89)90682-x. [DOI] [PubMed] [Google Scholar]
- Mwale F, Stachura D, Roughley P, Antoniou J. Limitations of using aggrecan and type X collagen as markers of chondrogenesis in mesenchymal stem cell differentiation. J Orthop Res. 2006;24:1791–1798. doi: 10.1002/jor.20200. [DOI] [PubMed] [Google Scholar]
- Norton JD, Atherton GT. Coupling of cell growth control and apoptosis functions of Id proteins. Mol Cell Biol. 1998;18:2371–2381. doi: 10.1128/mcb.18.4.2371. [DOI] [PMC free article] [PubMed] [Google Scholar]
- Norton JD. ID helix–loop–helix proteins in cell growth, differentiation and tumorigenesis. J Cell Sci. 2000;113:3897–3905. doi: 10.1242/jcs.113.22.3897. [DOI] [PubMed] [Google Scholar]
- Nielsen AL, Pallisgaard N, Pedersen FS, Jorgensen P. Murine helix-loop-helix transcriptional activator proteins binding to the E-box motif of the Akv murine leukemia virus enhancer identified by cDNA cloning. Mol Cell Biol. 1992;12:3449–3459. doi: 10.1128/mcb.12.8.3449. [DOI] [PMC free article] [PubMed] [Google Scholar]
- Nielsen AL, Norby PL, Pedersen FS, Jorgensen P. E-box sequence and context-dependent TAL1/SCL modulation of basic helix-loop-helix protein-mediated transcriptional activation. J Biol Chem. 1996;271:31463–31469. doi: 10.1074/jbc.271.49.31463. [DOI] [PubMed] [Google Scholar]
- Perk J, Iavarone A, Benezra R. Id family of helix–loop–helix proteins in cancer. Nat Rev Cancer. 2005;5:603–614. doi: 10.1038/nrc1673. [DOI] [PubMed] [Google Scholar]
- Ralphs JR. Chondrogenesis and myogenesis in micromass cultures of mesenchyme from mouse facial primordia. In Vitro Cell Dev Biol. 1992;28A:369–372. doi: 10.1007/BF02877061. [DOI] [PubMed] [Google Scholar]
- Riechmann V, van CrUchten I, Sablitzky F. The expression pattern of ld4, a novel dominant helix-loop-helix protein, is distinct from ldl, ld2, and ld3. Nucleic Acids Res. 1994;22:749–755. doi: 10.1093/nar/22.5.749. [DOI] [PMC free article] [PubMed] [Google Scholar]
- Sasse J, Gallagher SR. Staining protein gels. In: Ausubel F, Brent R, Kingston R, Moore D, Seidman J, Smith J, Struhl K, editors. Current protocols in molecular biology. New York: John Wiley and Sons; 1991. pp. 10.6.1–10.6.8. [Google Scholar]
- Shimizu H, Yokoyama S, Asahara H. Growth and differentiation of the developing limb bud from the perspective of chondrogenesis. Dev Growth Differ. 2007;49:449–454. doi: 10.1111/j.1440-169X.2007.00945.x. [DOI] [PubMed] [Google Scholar]
- Sun XH, Copeland NG, Jenkins NA, Baltimore D. Id proteins Id1 and Id2 selectively inhibit DNA binding by one class of helix-loop-helix proteins. Mol Cell Biol. 1991;11:5603–5611. doi: 10.1128/mcb.11.11.5603. [DOI] [PMC free article] [PubMed] [Google Scholar]
- Walker MD, Park CW, Rosen A, Aronheim A. A cDNA from a mouse pancreatic beta cell encoding a putative transcription factor of the insulin gene. Nucleic Acids Res. 1990;18:1159–1166. doi: 10.1093/nar/18.5.1159. [DOI] [PMC free article] [PubMed] [Google Scholar]
- Wang Q, Stacy T, Binder M, Marin-Padilla M, Sharpe AH, Speck NA. Disruption of the Cbfa2 gene causes necrosis and hemorrhaging in the central nervous system and blocks definitive hematopoiesis. Proc Natl Acad Sci USA. 1996;93:3444–3449. doi: 10.1073/pnas.93.8.3444. [DOI] [PMC free article] [PubMed] [Google Scholar]
- Wang Y, Belflower RM, Dong YF, Schwarz EM, O'Keefe RJ, Drissi H. Runx1/AML1/Cbfa2 mediates onset of mesenchymal cell differentiation toward chondrogenesis. J Bone Miner Res. 2005;20:1624–1636. doi: 10.1359/JBMR.050516. [DOI] [PubMed] [Google Scholar]
- Wedden SE, Lewin-Smith MR, Tickle C. The patterns on chondrogenesis of cells from facial primordia of chick embryos in micromass culture. Dev Biol. 1986;117:71–82. doi: 10.1016/0012-1606(86)90349-0. [DOI] [PubMed] [Google Scholar]
- Wilson JW, Deed RW, Inoue T, Balzi M, Becciolini A, Faraoni P, Potten CS, Norton JD. Expression of Id helix-loop-helix proteins in colorectal adenocarcinoma correlates with p53 expression and mitotic index. Cancer Res. 2001;61:8803–8810. [PubMed] [Google Scholar]
- Yamashiro T, Wang XP, Li Z, Oya S, Aberg T, Fukunaga T, Kamioka H, Speck NA, Takano-Yamamoto T, Thesleff I. Possible roles of Runx1 and Sox9 in incipient intramembranous ossification. J Bone Miner Res. 2004;19:1671–1677. doi: 10.1359/JBMR.040801. [DOI] [PubMed] [Google Scholar]
- Ying QL, Nichols J, Chambers I, Smith A. BMP induction of Id proteins suppresses differentiation and sustains embryonic stem cell self-renewal in collaboration with STAT3. Cell. 2003;115:281–292. doi: 10.1016/s0092-8674(03)00847-x. [DOI] [PubMed] [Google Scholar]
- Yu Z, Xing Y. All-trans retinoic acid inhibited chondrogenesis of mouse embryonic palate mesenchymal cells by down-regulation of TGF-beta/Smad signaling. Biochem Biophys Res Commun. 2006;340:929–934. doi: 10.1016/j.bbrc.2005.12.100. [DOI] [PubMed] [Google Scholar]
- Zebedee Z, Hara E. Id proteins in cell cycle control and cellular senescence. Oncogene. 2001;20:8317–8325. doi: 10.1038/sj.onc.1205092. [DOI] [PubMed] [Google Scholar]
- Zimmermann B, Thies M. Alterations of lectin binding during chondrogenesis of mouse limb buds. Histochemistry. 1984;81:353–361. doi: 10.1007/BF00514329. [DOI] [PubMed] [Google Scholar]
- Zhou G, Zheng Q, Engin F, Munivez E, Chen Y, Sebald E, Krakow D, Lee B. Dominance of SOX9 function over RUNX2 during skeletogenesis. Proc Natl Acad Sci. 2006;103:19004–19009. doi: 10.1073/pnas.0605170103. [DOI] [PMC free article] [PubMed] [Google Scholar]