

Abstract
We examined mechanisms by which L-4F reduces obesity and diabetes in obese (ob) diabetic mice. We hypothesized that L-4F reduces adiposity via increased pAMPK, pAKT, HO-1, and increased insulin receptor phosphorylation in ob mice. Obese and lean mice were divided into five groups: lean, lean-L-4F-treated, ob, ob-L-4F-treated, and ob-L-4F-LY294002. Food intake, insulin, glucose adipocyte stem cells, pAMPK, pAKT, CB1, and insulin receptor phosphorylation were determined. Subcutaneous (SAT) and visceral adipose tissue (VAT) were determined by MRI and hepatic lipid content by magnetic resonance spectroscopy. SAT and VAT volumes decreased in ob-L-4F-treated animals compared with control. L-4F treatment decreased hepatic lipid content and increased the numbers of small adipocytes (P < 0.05) and phosphorylation of insulin receptors. L-4F decreased CB1 in SAT and VAT and increased pAKT and pAMPK in endothelium. L-4F-mediated improvement in endothelium was prevented by LY294002. Inhibition of pAKT and pAMPK by LY294002 was associated with an increase in glucose levels. Upregulation of HO-1 by L-4F produced adipose remodeling and increased the number of small differentiated adipocytes. The anti-obesity effects of L-4F are manifested by a decrease in visceral fat content with reciprocal increases in adiponectin, pAMPK, pAKT, and phosphorylation of insulin receptors with improved insulin sensitivity.
Keywords: diabetes, adiponectin, adiposity, apolipoprotein A-I, heme oxygenase-1, insulin receptor, insulin sensitivity, obesity, endothelial dysfunction
Insulin resistance is the hallmark of type 2 diabetes and its associated cardiovascular disease (1, 2). Once hyperglycemia is established, an increase in reactive oxygen species (ROS) occurs, resulting in a progressive deterioration in vascular function with an elevation of inflammatory cytokines from adipose tissue (3). Obesity is also a risk factor for cardiovascular disease and diabetes in humans (4). Obesity and insulin resistance are considered independent predictors of cardiovascular disease (5, 6). However, recent studies have revealed the presence of myocardial perfusion abnormalities, even in the absence of coronary lesions, in patients with asymptomatic diabetes mellitus (6, 7). This suggests that obesity and diabetes are strongly associated with endothelial dysfunction (8–13), increased lipolysis, hepatic triglyceride secretion, and sterol-regulatory element binding protein-1 (SREBP-1) (14). SREBPs are the major transcription factors that regulate genes involved in fatty acid and cholesterol synthesis and are regulated by pAMPK and pAKT in ob mice (14). In addition, activation of the endocannabinoid receptor-1 (CB1 receptor) was shown to increase the hepatic lipogenic transcription factor and fatty acid synthesis (7). In visceral adipose tissue, CB1 receptor activity leads to a decrease in adiponectin and an increase in lipogenesis, both of which contribute to insulin resistance.
Drug therapy for atherosclerosis, coronary artery disease, dyslipidemia, hypertension, and other diseases associated with highly inflammatory states have been shown to either directly or indirectly induce heme oxygenase (HO) activity and increase HO gene expression (10). These drugs include aspirin, statins, losartan, immunosuppressive agents, such as cyclosporine A, and a host of other compounds, including 4F (10, 15). These 4F compounds are apolipoprotein A1 mimetic peptides, synthesized from either D (D-4F) or L (L-4F) amino acids that enhance the ability of HDL to protect LDL against oxidation in atherosclerotic animals (16–18). Oral administration of D-4F has been reported to reduce atherosclerotic disease independent of cholesterol levels (17, 18). D-4F causes HDL to become anti-inflammatory, stimulates HDL-mediated cholesterol efflux, and reverses cholesterol transport from macrophages (16, 17). D-4F has been reported to reduce SREBP-1c mRNA levels EO6 immunoreactivity and renal inflammation in LDL receptor-null mice fed a Western diet (19). In a sickle cell disease model, apolipoprotein A1 improved vasoreactivity in LDL-receptor null mice (20). L-4F and D-4F improve vascular function and restore the balance between nitric oxide and superoxide anions due to increase in EC-SOD, HO-1, and peNOS levels (8, 20–23). Induction of HO-1 protein results in a marked increase in serum levels of adiponectin and a decrease in the inflammatory cytokines IL-1, IL-6, and TNF and an increase in insulin sensitivity (24–26).
In this study, we examined the mechanism of L-4F treatment in the restoration of vascular function by measuring the expression of pAMPK, pAKT, and insulin receptor phosphorylation. L-4F treatment resulted in reduced adiposity, manifested by a decrease in visceral and subcutaneous fat levels, decreased adipogenesis, and the increased presence of smaller insulin sensitive adipocytes via an increase in pAMPK, pAKT, and insulin receptor phosphorylation.
MATERIALS AND METHODS
Animal protocols
Male obese (ob) mice (B6v-Lep ob/J) were purchased from Harlan (Chicago, IL) at the age of 7 weeks and used at 8 weeks of age. Age- and sex-matched lean mice (B6.V, lean; Harlan) served as controls. Mice were fed a normal chow diet and had free access to water. Body weight of ob and lean mice at the beginning of the treatment were 34 ± 5 g and 26 ± 3 g, respectively. Glucose levels were 248 ± 21 and 126 ± 14 mg/dl for ob and lean mice, respectively. Glucose monitoring was performed using an automated analyzer (Life Scan, Milpitas, CA). Beginning at 9 weeks of age when all ob mice had established diabetes, L-4F (i.e., Ac-D-W-F-K-A-F-Y-D-K-V-A-E-K-F-K-E-A-F-NH2) synthesized from l-amino acids as previously described (27) was injected at a dose of 200 μg/100 g daily in 200 μl vehicle), or vehicle (ABCT: ammonium bicarbonate buffer at pH 7.4 containing 0.01% Tween 20) were administered intraperitoneally (i.p.) for 6 weeks. At the time of sacrifice, subcutaneous and visceral fat visible in the abdomen, mesenteric fat, fat around the liver, kidney spleen, and heart were dissected free, pooled for each mouse, and weighed. Blood was collected (50–100 μl) from the tail vein of anesthetized ob mice following administration of either L-4F or vehicle. L-4F treated ob mice were divided into two groups, one treated with L-4F and the P13 kinase AKT inhibitor, LY294002 (Cell Signaling Technology, Boston, MA) 2-(4-morpholinyl)-8-phenyl-4H-1-benzopyran-4-HCl), which was dissolved in DMSO and diluted with PBS and injected i.p. at a dose of 100 mg/kg, three times a week for the last three weeks of the study (28, 29). We have previously shown that LY294004 is an inhibitor of HO-1-mediated cell protection (30). The second group of ob-L-4F-treated mice were treated with the same volume of vehicle (PMSO+PBS) without LY294002. Six groups of animals were studied: A) lean, B) lean-L-4F, C) lean-L-4F-LY-294002, D) ob control, E) ob-L-4F, and F) ob-L-4F-LY294002. Food intake did not change in the mice in any treatment group. The Animal Care and Use Committee of New York Medical College approved all experiments.
MRI and magnetic resonance spectroscopy
Subcutaneous fat tissue (SAT) and visceral fat tissue (VAT) were determined by MRI, while hepatic fat was determined by magnetic resonance spectroscopy (MRS). Mice were imaged in a GE Excite 1.5T scanner using a knee coil with a T1-weighted spin-echo pulse sequence (TEC 9.0 ms, TR = 540ms, NEX = 4, FOVO 8 × 8 cm) and an image size of 224 × 192 pixels. The whole chest and abdomen of each mouse were covered with axial slices (thickness 3 mm, no spacing). Acquired images underwent semiautomatic segmentation of SAT and VAT using the previously validated HIPPO FAT® tool (31–33).
The software computed three masks (background, fat, and nonfat tissues) using a fuzzy clustering segmentation. External and internal SAT boundaries were then defined by an active contour algorithm that exploited the previously computed masks as external force maps. A third contour was computed surrounding the area where VAT was present together with other tissues. VAT itself was assessed by the automated analysis of the signal histogram in the visceral region previously defined, by identifying the second peak of the signal histogram. This provided whole body volume (including the skeletal and soft tissues), total fat, SAT and VAT volumes, as well as VAT/SAT and fat/body volume ratios.
Liver lipid measurements
Localized 1H MRS of the liver was acquired on the GE Excite 1.5T MRI scanner. The liver slice with the largest gross dimensions was chosen for the MRS study. MRS for water and fat quantification was accomplished using a point resolved spectroscopy sequence. After line broadening and phase and baseline correction, the peak area of the water at 4.77 ppm and fat resonance (FR) at 1.40 ppm were measured. Quantification of the fat content was done by comparing the area of the FR with that of the unsuppressed water. Spectroscopic data were processed using the NUTS software. Hepatic fat percentage was calculated by dividing (FR) by the sum of FR and peak area of water. This technique is highly reproducible, with a coefficient of variation <2% in slices studied on eight separate occasions.
Determination of adipocyte cell size, HO-1, and CB1
Subcutaneous adipose tissue and renal, liver, and aortic visceral fat tissue collected from untreated ob mice and L-4F-treated ob mice (n = 8 mice per group) were prepared for morphological analysis. Samples were fixed in 4% paraformaldehyde for 24 h, cut into small pieces, and embedded in paraffin for histological analysis. The samples were cut by microtome (5 μm thick), mounted on D-polylisinated glass slides, deparaffinizated in xylene, and stained with hematoxylin and eosin for the evaluation of adipocyte size or processed for CB-1 or HO-1 immunohistochemistry. Immunostaining for CB-1 was carried out using a goat polyclonal anti-CB-1 primary antibody (22) (Santa Cruz Biotechnology, Santa Cruz, CA), and HO-1 immunostaining was carried out using a rabbit polyclonal anti-HO-1 primary antibody (Stressgen Bioreagents, Victoria, BC, Canada). For each experimental group, five sections per animal were stained. Sections were immersed in 3% hydrogen peroxide and diluted in methanol for 30 min to quench endogenous peroxidase activity. The sections were preincubated with 3% horse serum for 60 min followed by primary antibody anti-CB-1 diluted 1:125 for 2 h at 37°C. The sections were then washed in TBS (0.1 M), incubated 30 min at room temperature with biotinylated horse anti-goat immunoglobulin (Vector Laboratories, Burlingame, CA), and then incubated for 30 min at room temperature with avidin-biotin-horseradish peroxidase complex (ABC complex; Vector Laboratories, Burlingame, CA). The reaction product was visualized using hydrogen peroxide and diaminobenzidine (Sigma-Aldrich, St. Louis, MO) as the chromogen. All slides were dehydrated and mounted in DPX (Sigma-Aldrich). Negative controls for primary antibody with nonimmune serum revealed no signal.
Determination of CB-1 and HO-1 fat
CB-1 and HO-1 staining intensity was computed as integrated optical density (IOD). Digitally fixed images of the slices (n = 5 per animal) at 20× magnification were analyzed using an optical microscope equipped with an image analyzer (Image Pro Plus; Immaginie Computer, Milan, Italy). For quantitative analysis, IOD was calculated for arbitrary areas, measuring three fields with the same area for each section.
Determination of adipocyte cell size
Digital images of adipose tissue sections were captured using a light microscope (Olympus) at 20× magnification. For each group, three fields from each of five different hematoxylin-eosin stained sections per animal were analyzed. Individual adipocyte areas (μm2) within each field were determined using image analysis software (Image Pro Plus). For the quantitative analysis, adipocyte areas were calculated in arbitrary fields, measuring 50 adipocytes for each section.
Western blot analysis of liver, kidney, and adipocyte stem cells for HO-1, AMPK, pAMPK, AKT, pAKT, and insulin receptor phosphorylation
At sacrifice, subcutaneous and visceral fat in the abdomen (the visible mesenteric fat and fat around the liver, kidney, spleen, and the heart) were dissected, pooled for each mouse, and used to isolate adipocyte stem cells. Specimens were stored at −140°C until assayed. Frozen liver, kidney, heart, and fat tissues were pulverized under liquid nitrogen and placed in a homogenization buffer [mmol/l: 10 phosphate buffer, 250 sucrose, 1 EDTA, 0.1 PMSF, and 0.1% (v/v) tergitol, pH 7.5]. Homogenates were centrifuged at 27,000 g for 10 min at 4°C, supernatant was isolated, and protein levels were visualized by immunoblotting with antibodies. Antibodies against AMPK, pAMPK, AKT, and pAKT were obtained from Cell Signaling Technology (Beverly, MA). Antibodies were prepared by dilution of HO-1, pAMPK, pAKT, and insulin receptor as we described previously (23, 25, 26).
Measurement of fiber diameter and fat deposits
Serial sections (8 μm thick) were cut by cryostat and stained with hematoxylin-eosin for morphological evaluation (measurement of diameter) and analayzed for fat deposits with Oil Red O staining. Digital images were taken using a light microscope (Olympus) and then analyzed with a software program (Image-Pro Plus 4.5.1). Ten fibers from each muscle slice were randomly selected to estimate fiber diameter; fat deposits were evaluated through measurement of the percentage of Oil Red O stained areas in five fields per randomly selected muscle sections. A total of five sections per animal were analyzed.
Adipocyte mesenchymal stem cell isolation from SAT and VAT of lean, ob, and ob L-4F-treated mice
To isolate mouse adipocyte mesenchymal stem cells (MSCs), adipose tissues were washed with PBS and digested at 37°C for 30 min with 0.075% type II collagenase (34). At 50% confluence, L-4F was added as indicated in the figure legends. HO-1 and adipogenesis were measured, with the latter using Oil Red O staining (25).
Glucose tolerance test
After a 12 h fast, mice were injected i.p. with glucose (2.0g/kg body weight). Blood samples were taken at various time points (0–120 min) for measurement of blood glucose levels.
Human bone marrow-derived mesenchymal stem cells and adipocytes
Frozen bone marrow mononuclear cells were purchased from Allcells (Emeryville, CA). After thawing the cells, mononuclear cells were cultured as previously described (23, 25, 26).
Adipogenic differentiation of human MSCs and effect of L-4F
Adipogenic differentiation of human MSCs was induced by incubation in an adipogenesis induction medium [DMEM-high glucose (35, 36), supplemented with 10 μg/ml of insulin, 1 μmol/L of dexamethasone, 0.2 mmol/L of indomethacin, 10% FBS, and 1% antibiotic–antimycotic solution]. The medium was changed every 3–4 days (35, 36) for vehicle and L4F. At 50% confluence, L-4F and vehicle solutions were added, and HO-1, adiponectin, pAMPK, pAKT, and adipogenesis were measured, the latter using Oil Red O as previously described (25). MSC-derived adipocytes were treated with L-4F, 7.5 μM LY294002, a dose effective in inhibiting P 1-3 Kinase/AKT (29, 30). Addition of L-4F or LY294002 to adipocyte stem cell culture does not affect cell viability as measured by trypan blue staining.
The effect of L-4F and LY2940002 in cultured adipocyte stem cells on Oil Red O staining and lipid droplet size
For Oil Red O staining, 0.21% Oil Red O in 100% isopropanol (Sigma-Aldrich) was used. Briefly, adipocytes were fixed in 10% formaldehyde, washed in Oil Red O for 10 min, rinsed with 60% isopropanol (Sigma-Aldrich), eluted Oil Red O by adding 100% isopropanol for 10 min, and measured OD at 490 nm for 0.5 s reading. Cell size was measured using an ImagePro Analyzer (MediaCybernetics Corporation, Silver Springs, MD). The classification of the size of lipid droplets was as follows and is based on size by area (pixels): >200 pixels (large lipid droplets); <199 (small lipid droplets).
Statistical analysis
Statistical significance between experimental groups was determined by the Fisher method of analysis of multiple comparisons (P < 0.05 was regarded as significant). For comparison between treatment groups, the null hypothesis was tested by either a single-factor ANOVA for multiple groups or unpaired t-test for two groups. Data are presented as mean ± SEM except for cell size and IOD for CB1, which are presented as mean ± SD. Differences between experimental groups were evaluated with ANOVA with Bonferroni corrections. Statistical significance was regarded as significant at P < 0.05.
RESULTS
L-4F treatment reduces weight gain and fat content
We examined the effect of L-4F treatment on body and fat appearance. As seen in Fig. 1, L-4F treatment visibly reduced weight gain in ob mice. The final weights after 6 weeks of vehicle or L-4F treatment were (53 ± 2.9 g and 43.2 ± 1.7 g, respectively, P < 0.05). The L-4F-mediated reduction of weight gain was reversible. When L-4F was discontinued at week 10, ob mice gained weight at a faster rate than ob vehicle treated animals (data not shown). As seen in Fig. 1, visceral fat in obese mice was decreased by L-4F treatment. This provided semiquantitative estimates of fat content, which was quantitated using MRI as described below.
Fig. 1.
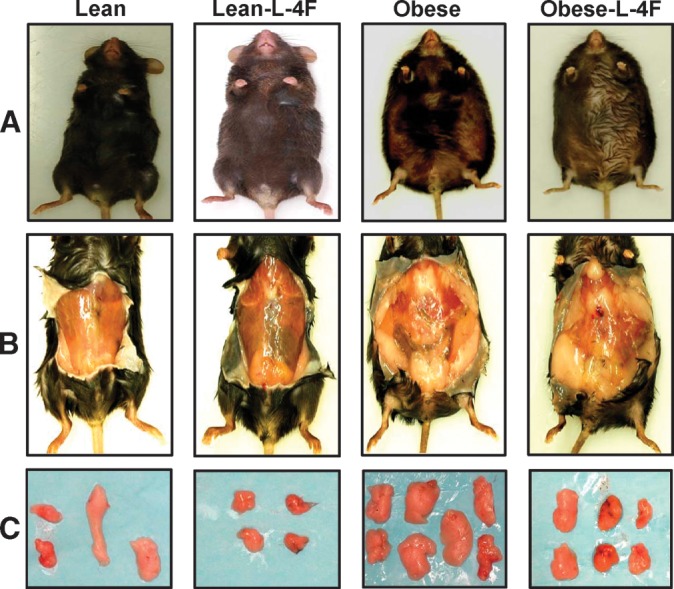
Effect of L-4F on body weight and visceral fat content in lean and ob mice. A: Effect of L-4F administration on body appearance. Examples of subcutaneous and visceral fat (B) and dissected fat (C) from lean and ob mice. Representative photographs showing one mouse from each group after 6 weeks of treatment (n = 8).
Effect of L-4F on fat content determined by MRI
MRI was used to quantify SAT and VAT. As seen on Fig. 2, global SAT and global VAT were significantly decreased by L4F, P < 0.05 and P < 0.01, respectively. Subcutaneous fat in ob mice was decreased from 5.13 ± 0.78 to 3.21 ± 45g, and visceral fat in obese mice was decreased from 8.82 ± 0.49 to 6.13 ± 0.69 g. The decrease in visceral fat was accompanied by a significant increase in adiponectin levels and a decrease in the levels of the inflammatory cytokine IL-1 β. Prior to treatment, adiponectin levels in the ob mice were 2.73 ± 0.51 μg/ml compared with 4.76 ± 0.93 μg/ml (P < 0.029) in lean animals. L-4F treatment resulted in a significant increase (P < 0.01) in the levels of serum adiponectin 6.14 ± 1.49 μg/ml in the ob mice. Obese mice exhibited a significant increase in serum IL-1β levels (123 ± 29 pg/ml) when compared with age-matched lean controls (48 ± 31 pg/ml), P < 0.05. L-4F treatment resulted in a significant (P < 0.01) decrease in serum IL-1 levels in the ob mice (39 ± 26 pg/ml) compared with 106 ± 21 pg/ml in untreated ob to levels seen in the lean mice, confirming previous data (23).
Fig. 2.

Effect of L-4F treatment on Global SAT and VAT as measured. A: Effect of L-4F treatment on global SAT and VAT as measured by MRI. B: Global fat was increased in ob mice compared with ob-L-4F-treated mice (* P < 0.01, n = 3).
L-4F treatment on muscle weight and intramuscular Oil Red O staining
The weight of gastrocnemius muscle in lean mice, untreated ob mice, and L-4F-treated ob mice was 393 ± 46 mg, 350 ± 52 mg, and 356 ± 48 mg, respectively (Fig. 3). As shown in Fig. 3, L-4F treatment did not affect muscle fiber, fat content, or muscle diameter. The diameters of muscle fibers for the lean, ob untreated, and L-4F-treated mice were 50 ± 4.7 μm, 53 ± 4 μm, and 51 ± 4 μm, respectively (Fig. 3B). Intramuscular lipid droplets were severalfold higher in ob compared with lean mice (P < 0.005) but were not different in ob mice treated with L-4F when compared with untreated ob mice (Fig. 3D).
Fig. 3.

Effect of L-4F on gastrocnemius muscle fibril diameter and muscle weight. A: Hematoxylin eosin staining of gastrocnemius and Oil Red O staining within myofibril interstitial spaces in muscle cross section. Small arrow indicates extracellular fat deposits and large bar indicates intracellular fat deposits. Lean (A), ob fat (B), ob fat L-4F (C). A: The mean diameter of myofibril of the lean versus obese (P < 0.05). B: Muscle fibril diameter, arrow in lean, ob, and ob-L4F-treated mice. C: Muscle weight was measured as described in Materials and Methods. The results are expressed as mean ± SEM, n = 4. D: Oil Red O muscle fat staining showing increased staining in ob mice and not reduced by L-4F (*P < 0.005).
Effect of L-4F on adipocyte size
Histological examination of SAT and VAT revealed that adipocyte cell size was significantly decreased (Fig. 4). Adipocyte cell size in the subcutaneous fat of control ob mice was 52 ± 14 μm2 ×100 (Fig. 4A). Adipocyte cell size was significantly lower in L-4F-treated ob mice, 42 ± 11 μm2 × 100 (P < 0.05). A similar reduction was seen with L-4F treatment in adipocyte cell size in visceral fat surrounding aortic fat tissue (Fig. 4B). Adipocyte cell size was proportionally lower in subcutaneous fat tissue. Adipocyte cell size in lean animals was 37 ± 9 μm2 × 100 compared with lean mice treated with L-4F (26 ± 7 μm2 × 100) (data not shown).
Fig. 4.

Effect of L-4F on Subcutaneous (A) and visceral (B) fat in ob mice. Haematoxylin-eosin staining of subcutaneous (A) and visceral (B) fat in ob and L-4F-treated ob mice. Bars = 50 μm. Quantitative analysis of adipocyte size in subcutaneous fat and visceral fat surrounding the aorta of ob or L-4F-treated ob mice is displayed. Data are expressed as means ± SD (* P < 0.05 vs. ob).
Effect of L-4F on CB1 and HO-1 expression in adipocytes of visceral and subcutaneous tissues
We examined the effect of L-4F treatment on CB1 expression in adipose tissue. The level of CB1 expression in SAT was significantly lower in L-4F-treated ob mice (595 ± 119 in control ob mice compared with 334 ± 98 in L-4F-treated ob mice; P < 0.05) (Fig. 5). Similarly, the level of CB1 expression in VAT was significantly lower in L-4F-treated ob mice (788 ± 124 in control ob mice compared with 409 ± 153 in L-4F treated ob mice; P < 0.05) (Fig. 5). L-4F treatment of ob mice significantly increased HO-1 expression in both SAT and VAT (Fig. 6) (P < 0.05). The increase in HO-1 expression has been shown to suppress the levels of inflammatory cytokines released by adipocytes (23, 25).
Fig. 5.

Expression of CB-1 expression in subcutaneous fat and visceral fat surrounding aorta of ob mice. A: IOD of CB-1 expression in subcutaneous fat and visceral fat surrounding aorta of ob or L-4F-treated ob mice is displayed. Data are expressed as mean ± SD (* P < 0.05 vs. obese mice). B: Effect of L-4F on CB1 levels in SAT and VAT.
Fig. 6.

Effect of L-4F on HO-1 expression in subcutaneous fat and visceral fat surrounding aorta of ob mice. A: Immunohistochemistry staining for HO-1 of subcutaneous fat and visceral fat surrounding aorta of ob or L-4F-treated ob mice. Arrows indicate HO-1 immunoreactivity. Bars = 50 μm. B: IOD of HO-1 expression in subcutaneous fat and visceral fat surrounding aorta of ob or L-4F-treated ob mice. Data are expressed as means ± SD (* P < 0.05 SAT and VAT).
Effect of L-4F on hepatic lipid content
MRI showed that fat constituted 40% of hepatic tissue in untreated ob mice but only 15% of hepatic tissue in ob mice treated with L-4F. For comparison, hepatic fat content in lean mice was <5% (Fig. 7).
Fig. 7.

Effect of L-4F on percentage of fat in the liver of ob mice measured by MRS. Analysis of lipid content percentage of fat was calculated as described in Materials and Methods (*P < 0.01 vs. obese, n = 3).
Effect of L-4F on liver insulin receptor phosphorylation
Visceral fat depots drain into the portal circulation, resulting in the elevation of free fatty acids. This has been implicated in the genesis of impaired insulin signaling and decreased phosphorylation of insulin receptors. We therefore examined the effect of L-4F treatment on liver insulin receptor phosphorylation in untreated ob and lean mice. Phosphorylation of insulin receptors at sites Tyr-972 and Tyr-1146 was examined and shown in Fig. 8; insulin phosphorylation at sites 972 and 1146 was significantly decreased in untreated ob mice compared with lean animals. Densitometry analysis showed that L-4F treatment increased the ratio of P-Tyr 972 and Tyr-1146 in L-4F-treated ob mice compared with untreated ob mice (P < 0.01), and the resulting levels were equal to or greater than those in lean mice (Fig. 8).
Fig. 8.

Effect of L-4F on insulin receptor phosphorylation. A: Western blot and densitometry analysis of insulin receptor phosphorylation and actin proteins in liver of lean, ob, and ob-treated with L-4F. B: Quantitative densitometry evaluation of P-Tyr 972 and Tyr-1146 and actin proteins ratio was determined. Representative immunoblots are shown (n = 5).
Effect of AKT kinase inhibitor on glucose levels
Plasma glucose levels in ob mice treated with vehicle were significantly higher than those in ob mice treated with L-4F (Fig. 9A, upper panel, 0 time). Blood glucose levels in vehicle-treated ob mice were significantly (P < 0.001) elevated after glucose administration at all time points (Fig. 9A, upper panel). To clarify the role of pAKT and pAMPK as downstream signals in insulin sensitivity, we examined the effect of LY294002 on glucose levels. As seen in Fig. 9A, lower panel, LY294002 partially prevented the L-4F antihyperglycemic effect, resulting in increased glucose levels compared with L-4F-treated ob mice at the 0 time point. After glucose administration, glucose levels were elevated at all time points in the obese animals compared with the ob-L-4F-treated animals. Glucose levels in ob-L-4F-treated animals administered LY294002 remained elevated compared with ob-L-4F-treated animals at a level intermediate between the latter and ob animals (Fig. 9, lower panel).
Fig. 9.


Effect of inhibition of pAKT by LY294002 on glucose tolerance and signaling. A: Effect of LY294002 [three times/week for 3 weeks, administered by intraperitoneal injection on glucose tolerance (IPGTT)] tests in obese, L-4F obese, was performed as described in Materials and Methods. The results are expressed mean ± SEM, n = 3. B: Western blot of HO-1, adiponectin, pAKT, pAMPK, and actin proteins in kidney of ob, ob-treated with L-4F, and ob-treated with L-4F and LY294002. Representative immunoblots are shown (n = 4).
Effect of L-4F on aorta AKT, pAKT, AMPK, and pAMPK
As seen in Fig. 9B, AKT and AMPK levels in aorta tissue isolated from untreated ob mice were no different from that in lean mice or ob mice treated with L-4F. However, there were significant decreases in both pAKT and pAMPK in ob mice. Densitometry analysis showed that pAKT was increased significantly in ob mice treated with L-4F, compared with nontreated ob mice, P < 0.04. Additionally, as seen in Fig. 9B, LY294002 partially prevented the increase in L-4F-induced phosphorylation of AKT. The amount of nonphosphorylated AKT was unaffected by either L-4F or LY294002 treatment. Similar results were seen with AMPK and pAMPK (Fig. 9B). HO-1 levels were increased in ob-L-4F-treated animals. This was blunted by LY294002 treatment (Fig. 9B).
Effect of L-4F and inhibitors of AKT on adipogenesis in adipocyte MSCs
We also examined the effect of LY294002 on adipogenesis. Scan of lipid size of a representative experiment and Oil Red O staining is shown in Fig. 10A and B. L-4F decreased the levels of Oil Red O staining compared with control, while LY294002 (7.5 μM) increased Oil Red O staining in L-4F-treated cells. Thus, L-4F decreased adipogenesis (P < 0.05) as measured by Oil Red O staining, while LY294002 caused a significant increase in Oil Red O staining (Fig. 10B). Measurement of the size of the Oil Red O generated by adipocytes provides an indication of adipocyte regeneration and expansion (Fig. 10C). L-4F treatment decreased the number of large lipid droplets compared with control (Fig. 10D, upper panel). In contrast, supplementation of LY294002 alone or in the presence of L-4F significantly increased the large Oil Red O but decreased the number of small Oil Red O (Fig. 10C, D), compared with culture treated with LY294002 or control (untreated adipose cultures).
Fig. 10.

Effect of LY294002 on L-4F-mediated MSC-derived adipogenesis. A: Scan of lipid size of a representative experiment. B: Adipogenesis was measured as the relative absorbance of Oil Red O at day 10 after inducing adipogenesis as described in Materials and Methods. C: Measurement of number of lipid droplet size. D: Comparison of the effect of L-4F, LY294002, on number of lipid droplet sizes. Results are mean ± SEM, n = 4 (*P < 0.05 vs. control medium; **P < 0.02 vs. LY294002 or control culture).
DISCUSSION
In this report, we demonstrate that L-4F decreased adipogenesis and adiposity. This is manifested by a decrease in both SAT and VAT, a decrease in hepatic lipid content, and the presence of increased numbers of adipocytes with smaller cell size. MRI and MRS showed that treatment with L-4F resulted in a reciprocal decrease in visceral fat with improvement in vascular dysfunction as determined by the levels of pAMPK, pAKT, and phosphorylation of insulin receptors. Thus, L-4F appears capable of reprogramming vascular tissue and adipocytes in a manner that results in the expression of a new phenotype that contains adipocytes of reduced cell size with restored insulin sensitivity. Four observations substantiate this conclusion.
First, the L-4F-mediated prevention of visceral and subcutaneous fat accumulation, measured by MRI, is consistent with the observed decrease in hepatic lipid content. The decrease in lipid content is also consistent with the finding that L-4F treatment produced an elevation of the phosphorylation of insulin receptors at multiple sites (Fig. 8). The decrease in visceral and subcutaneous fat levels was paralleled by an increase in the number of smaller adipocytes, which are regarded as “healthy” insulin-sensitive adipocytes (37, 38). Thus, it appears that L-4F acts by preventing the adipocytes from increasing in size. Larger adipocytes appear to die off as their size increases (39), and the beneficial action of L-4F can be seen in lipid droplets that are smaller in size and with reduced hepatic lipid content (40). Abdominal fat mass is regarded as a predictor of cardiovascular risk (23, 25, 26, 40), which may be a result of obesity-mediated systemic inflammation with inflammatory cytokines TNF, IL-6, and IL-1, which are markedly elevated in obese rodents and humans (23, 25, 41–43). There is a direct proportionality of the degree of visceral adiposity and endothelial dysfunction (5, 23, 25, 40).
Second, L-4F treatment decreased serum IL-1β and CB1 receptor. The metabolic syndrome and obesity are characterized by increased serum levels of inflammatory cytokines, such as IL-1β, which decrease insulin sensitivity (44, 45). CB1 receptors in mice increase hepatic lipogenic transcription factor SREBP-1 and fatty acid synthesis (7). Therefore, the L-4F-mediated decreases in the levels of IL-1β and CB1 receptors may contribute to the observed increase in insulin sensitivity. In addition, downregulation of the peripheral endocannabinoid system, CB1, may contribute to the weight loss as well.
Third, L-4F administration has been shown to increase HO-1 protein levels and adiponectin both in vitro and in vivo. Decreased levels of serum adiponectin are the result of an increase in the levels of ROS and H2O2, thereby contributing to the pathogenesis of insulin resistance (46, 47). Previous studies have shown that increased levels of HO-1 protein caused a marked increase in serum adiponectin levels in Zucker fat rats and ob mice (23, 25, 26). An increase in adiponectin levels is an indication of improvement in the metabolic syndrome that, in turn, leads to increased insulin sensitivity and a subsequent decrease in arterial disease and heart disease (37, 45, 48–51). This supports the concept that expansion of adipogenesis leads to an increased number of adipocytes of smaller cell size. Smaller adipocytes are considered to be healthy, insulin-sensitive adipocyte cells that are capable of producing adiponectin (37). While increases in obesity and diabetes are considered a risk factor for cardiovascular complications (45), improvement in the diabetic phenotype, including improved insulin sensitivity and glucose tolerance, may occur through increased preadipocyte differentiation and increased adiponectin secretion (37, 52).
Fourth, the remarkable action of L-4F treatment in increased pAKT, pAMPK, and phosphorylation of insulin receptors is associated in an improvement in glucose tolerance. Insulin resistance is an independent factor for the development of vascular dysfunction (53, 54). Therefore, L-4F treatment improves vascular function on the basis of increases in both insulin sensitivity and insulin receptor phosphorylation. Others have shown that increased phosphorylation of insulin receptors and vascular function may be a response to the increase in pAMPK and pAKT crosstalk (55–57). Further activation of pAMPK and pAKT increases glucose transport fatty acid oxidation and mitochondrial function (58–60). In this study, inhibition of pAKT by LY294002 administration in L-4F-treated mice reversed glucose tolerance and insulin sensitivity. We previously reported that LY294002 inhibition of the AKT pathways prevented HO-1 in ameliorating cell protection against ROS (30). However, LY294002 administration in vivo inhibited both AKT and AMPK and decreased glucose tolerance and insulin sensitivity. pAKT and AMPK act as fuel sensors in the regulation of energy balance, and the resultant crosstalk of AMPK-AKT has been shown to regulate nitric oxide bioavailability and vascular function (56, 61, 62). Furthermore, activated AMPK alone has been suggested as a therapeutic target to ameliorate endothelial dysfunction (63–65). Thus, the novel effect of L-4F on the HO-1-adiponectin-pAKT-pAMPK-module (i.e., an increase in HO-1) increases adiponectin, and the subsequent increase in AKT-AMPK crosstalk and signaling pathway provides a beneficial mechanistic basis for L-4F-mediated vascular protection. L-4F treatment offers great potential as a drug that could be employed therapeutically to address the metabolic derangements associated with obesity, the metabolic syndrome, and insulin-resistant diabetes to restore vascular function.
Acknowledgments
The authors are indebted to Dr. Attallah Kappas and the Beatrice Renfield Foundation for their support. Ms. Daniele DeMarchi and Dr. Alessandro Pingipore are well appreciated for valuable help in the acquisition of Magnetic Resonance data.
Abbreviations
FR, fat resonance
HO, heme oxygenase
IOD, integrated optical density
i.p., intraperitoneally
MRS, magnetic resonance spectroscopy
MSC, mesenchymal stem cell
ob, obese
ROS, reactive oxygen species
SAT, subcutaneous fat tissue
SREBP-1, sterol-regulatory element binding protein-1
VAT, visceral fat tissue
Published, JLR Papers in Press, March 26, 2009.
Footnotes
This work was supported by National Institutes of Health Grants DK-068134, HL-55601, and HL-34300 (N.G.A.), by the CNR Medical Department and Cardiopulmonary Project, and by the Scuola Sant'Anna.
This work was presented in part at the American Heart Association, November, 2009.
References
- 1.Morino K., S. Neschen, S. Bilz, S. Sono, D. Tsirigotis, R. M. Reznick, I. Moore, Y. Nagai, V. Samuel, D. Sebastian, et al. 2008. Muscle specific IRS-1 Ser->Ala transgenic mice are protected from fat-induced insulin resistance in skeletal muscle. Diabetes. 57 2644–2651. [DOI] [PMC free article] [PubMed] [Google Scholar]
- 2.Danial N. N., L. D. Walensky, C. Y. Zhang, C. S. Choi, J. K. Fisher, A. J. Molina, S. R. Datta, K. L. Pitter, G. H. Bird, J. D. Wikstrom, et al. 2008. Dual role of proapoptotic BAD in insulin secretion and beta cell survival. Nat. Med. 14 144–153. [DOI] [PMC free article] [PubMed] [Google Scholar]
- 3.Wellen K. E., and G. S. Hotamisligil. 2003. Obesity-induced inflammatory changes in adipose tissue. J. Clin. Invest. 112 1785–1788. [DOI] [PMC free article] [PubMed] [Google Scholar]
- 4.Weisberg S. P., D. Hunter, R. Huber, J. Lemieux, S. Slaymaker, K. Vaddi, I. Charo, R. L. Leibel, and A. W. Ferrante, Jr. 2006. CCR2 modulates inflammatory and metabolic effects of high-fat feeding. J. Clin. Invest. 116 115–124. [DOI] [PMC free article] [PubMed] [Google Scholar]
- 5.Eckel R. H., D. A. York, S. Rossner, V. Hubbard, I. Caterson, S. T. St Jeor, L. L. Hayman, R. M. Mullis, and S. N. Blair. 2004. Prevention Conference VII: Obesity, a worldwide epidemic related to heart disease and stroke: executive summary. Circulation. 110 2968–2975. [DOI] [PubMed] [Google Scholar]
- 6.Tounian P., Y. Aggoun, B. Dubern, V. Varille, B. Guy-Grand, D. Sidi, J. P. Girardet, and D. Bonnet. 2001. Presence of increased stiffness of the common carotid artery and endothelial dysfunction in severely obese children: a prospective study. Lancet. 358 1400–1404. [DOI] [PubMed] [Google Scholar]
- 7.Osei-Hyiaman D., M. DePetrillo, P. Pacher, J. Liu, S. Radaeva, S. Batkai, J. Harvey-White, K. Mackie, L. Offertaler, L. Wang, et al. 2005. Endocannabinoid activation at hepatic CB1 receptors stimulates fatty acid synthesis and contributes to diet-induced obesity. J. Clin. Invest. 115 1298–1305. [DOI] [PMC free article] [PubMed] [Google Scholar]
- 8.Kruger A. L., S. Peterson, S. Turkseven, P. M. Kaminski, F. F. Zhang, S. Quan, M. S. Wolin, and N. G. Abraham. 2005. D-4F induces heme oxygenase-1 and extracellular superoxide dismutase, decreases endothelial cell sloughing, and improves vascular reactivity in rat model of diabetes. Circulation. 111 3126–3134. [DOI] [PubMed] [Google Scholar]
- 9.Kruger A. L., S. J. Peterson, M. L. Schwartzman, H. Fusco, J. A. McClung, M. Weiss, S. Shenouda, A. I. Goodman, M. S. Goligorsky, A. Kappas, et al. 2006. Up-regulation of heme oxygenase provides vascular protection in an animal model of diabetes through its antioxidant and antiapoptotic effects. J. Pharmacol. Exp. Ther. 319 1144–1152. [DOI] [PubMed] [Google Scholar]
- 10.Abraham N. G., and A. Kappas. 2008. Pharmacological and clinical aspects of heme oxygenase. Pharmacol. Rev. 60 79–127. [DOI] [PubMed] [Google Scholar]
- 11.Steinberg H. O., H. Chaker, R. Leaming, A. Johnson, G. Brechtel, and A. D. Baron. 1996. Obesity/insulin resistance is associated with endothelial dysfunction. Implications for the syndrome of insulin resistance. J. Clin. Invest. 97 2601–2610. [DOI] [PMC free article] [PubMed] [Google Scholar]
- 12.Yudkin J. S., M. Kumari, S. E. Humphries, and V. Mohamed-Ali. 2000. Inflammation, obesity, stress and coronary heart disease: is interleukin-6 the link? Atherosclerosis. 148 209–214. [DOI] [PubMed] [Google Scholar]
- 13.Zhang F., J. I. Kaide, L. Yang, H. Jiang, S. Quan, R. Kemp, W. Gong, M. Balazy, N. G. Abraham, and A. Nasjletti. 2004. CO modulates pulmonary vascular response to acute hypoxia: relation to endothelin. Am. J. Physiol. Heart Circ. Physiol. 286 H137–H144. [DOI] [PubMed] [Google Scholar]
- 14.Porstmann T., B. Griffiths, Y. L. Chung, O. Delpuech, J. R. Griffiths, J. Downward, and A. Schulze. 2005. PKB/Akt induces transcription of enzymes involved in cholesterol and fatty acid biosynthesis via activation of SREBP. Oncogene. 24 6465–6481. [DOI] [PubMed] [Google Scholar]
- 15.Lee T. S., C. C. Chang, Y. Zhu, and J. Y. Shyy. 2004. Simvastatin induces heme oxygenase-1: a novel mechanism of vessel protection. Circulation. 110 1296–1302. [DOI] [PubMed] [Google Scholar]
- 16.Navab M., G. M. Anantharamaiah, S. T. Reddy, S. Hama, G. Hough, V. R. Grijalva, A. C. Wagner, J. S. Frank, G. Datta, D. Garber, et al. 2004. Oral D-4F causes formation of pre-beta high-density lipoprotein and improves high-density lipoprotein-mediated cholesterol efflux and reverse cholesterol transport from macrophages in apolipoprotein E-null mice. Circulation. 109 3215–3220. [DOI] [PubMed] [Google Scholar]
- 17.Navab M., G. M. Ananthramaiah, S. T. Reddy, B. J. Van Lenten, B. J. Ansell, G. C. Fonarow, K. Vahabzadeh, S. Hama, G. Hough, N. Kamranpour, et al. 2004. The oxidation hypothesis of atherogenesis: the role of oxidized phospholipids and HDL. J. Lipid Res. 45 993–1007. [DOI] [PubMed] [Google Scholar]
- 18.Navab M., G. M. Anantharamaiah, S. T. Reddy, B. J. Van Lenten, G. Hough, A. Wagner, K. Nakamura, D. W. Garber, G. Datta, J. P. Segrest, et al. 2003. Human apolipoprotein AI mimetic peptides for the treatment of atherosclerosis. Curr. Opin. Investig. Drugs. 4 1100–1104. [PubMed] [Google Scholar]
- 19.Buga G. M., J. S. Frank, G. A. Mottino, A. Hakhamian, A. Narasimha, A. D. Watson, B. Yekta, M. Navab, S. T. Reddy, G. M. Anantharamaiah, et al. 2008. D-4F reduces EO6 immunoreactivity, SREBP-1c mRNA levels, and renal inflammation in LDL receptor-null mice fed a Western diet. J. Lipid Res. 49 192–205. [DOI] [PubMed] [Google Scholar]
- 20.Ou J., Z. Ou, D. W. Jones, S. Holzhauer, O. A. Hatoum, A. W. Ackerman, D. W. Weihrauch, D. D. Gutterman, K. Guice, K. T. Oldham, et al. 2003. L-4F, an apolipoprotein A-1 mimetic, dramatically improves vasodilation in hypercholesterolemia and sickle cell disease. Circulation. 107 2337–2341. [DOI] [PubMed] [Google Scholar]
- 21.Ou Z., J. Ou, A. W. Ackerman, K. T. Oldham, and K. A. Pritchard, Jr. 2003. L-4F, an apolipoprotein A-1 mimetic, restores nitric oxide and superoxide anion balance in low-density lipoprotein-treated endothelial cells. Circulation. 107 1520–1524. [DOI] [PubMed] [Google Scholar]
- 22.Peterson S. J., D. Husney, A. L. Kruger, R. Olszanecki, F. Ricci, L. F. Rodella, A. Stacchiotti, R. Rezzani, J. A. McClung, W. S. Aronow, et al. 2007. Long-term treatment with the apolipoprotein A1 mimetic peptide increases antioxidants and vascular repair in type I diabetic rats. J. Pharmacol. Exp. Ther. 322 514–520. [DOI] [PubMed] [Google Scholar]
- 23.Peterson S. J., G. Drummond, K. D. Hyun, M. Li, A. L. Kruger, S. Ikehara, and N. G. Abraham. 2008. L-4F treatment reduces adiposity, increases adiponectin levels and improves insulin sensitivity in obese mice. J. Lipid Res. 49 1658–1669. [DOI] [PMC free article] [PubMed] [Google Scholar]
- 24.L'Abbate A., D. Neglia, C. Vecoli, M. Novelli, V. Ottaviano, S. Baldi, R. Barsacchi, A. Paolicchi, P. Masiello, G. S. Drummond, et al. 2007. Beneficial effect of heme oxygenase-1 expression on myocardial ischemia-reperfusion involves an increase in adiponectin in mildly diabetic rats. Am. J. Physiol. Heart Circ. Physiol. 293 H3532–H3541. [DOI] [PubMed] [Google Scholar]
- 25.Li M., D. H. Kim, P. L. Tsenovoy, S. J. Peterson, R. Rezzani, L. F. Rodella, W. S. Aronow, S. Ikehara, and N. G. Abraham. 2008. Treatment of obese diabetic mice with a heme oxygenase inducer reduces visceral and subcutaneous adiposity, increases adiponectin levels, and improves insulin sensitivity and glucose tolerance. Diabetes. 57 1526–1535. [DOI] [PubMed] [Google Scholar]
- 26.Kim D. H., A. P. Burgess, M. Li, P. L. Tsenovoy, F. Addabbo, J. A. McClung, N. Puri, and N. G. Abraham. 2008. Heme oxygenase-mediated increases in adiponectin decrease fat content and inflammatory cytokines, tumor necrosis factor-alpha and interleukin-6 in Zucker rats and reduce adipogenesis in human mesenchymal stem cells. J. Pharmacol. Exp. Ther. 325 833–840. [DOI] [PubMed] [Google Scholar]
- 27.Navab M., G. M. Anantharamaiah, S. Hama, D. W. Garber, M. Chaddha, G. Hough, R. Lallone, and A. M. Fogelman. 2002. Oral administration of an Apo A-I mimetic peptide synthesized from D-amino acids dramatically reduces atherosclerosis in mice independent of plasma cholesterol. Circulation. 105 290–292. [DOI] [PubMed] [Google Scholar]
- 28.Hu L., J. Hofmann, and R. B. Jaffe. 2005. Phosphatidylinositol 3-kinase mediates angiogenesis and vascular permeability associated with ovarian carcinoma. Clin. Cancer Res. 11 8208–8212. [DOI] [PubMed] [Google Scholar]
- 29.Hu L., J. Hofmann, Y. Lu, G. B. Mills, and R. B. Jaffe. 2002. Inhibition of phosphatidylinositol 3′-kinase increases efficacy of paclitaxel in in vitro and in vivo ovarian cancer models. Cancer Res. 62 1087–1092. [PubMed] [Google Scholar]
- 30.Salinas M., R. Diaz, N. G. Abraham, C. M. Ruiz De Galarreta, and A. Cuadrado. 2003. Nerve growth factor protects against 6-hydroxydopamine-induced oxidative stress by increasing expression of heme oxygenase-1 in a phosphatidylinositol 3-kinase-dependent manner. J. Biol. Chem. 278 13898–13904. [DOI] [PubMed] [Google Scholar]
- 31.Positano V., A. Gastaldelli, A. M. Sironi, M. F. Santarelli, M. Lombardi, and L. Landini. 2004. An accurate and robust method for unsupervised assessment of abdominal fat by MRI. J. Magn. Reson. Imaging. 20 684–689. [DOI] [PubMed] [Google Scholar]
- 32.Demerath E. W., K. J. Ritter, W. A. Couch, N. L. Rogers, G. M. Moreno, A. Choh, M. Lee, K. Remsberg, S. A. Czerwinski, W. C. Chumlea, et al. 2007. Validity of a new automated software program for visceral adipose tissue estimation. Int. J. Obes. (Lond). 31 285–291. [DOI] [PMC free article] [PubMed] [Google Scholar]
- 33.Bonekamp S., P. Ghosh, S. Crawford, S. F. Solga, A. Horska, F. L. Brancati, A. M. Diehl, S. Smith, and J. M. Clark. 2008. Quantitative comparison and evaluation of software packages for assessment of abdominal adipose tissue distribution by magnetic resonance imaging. Int. J. Obes. (Lond). 32 100–111. [DOI] [PMC free article] [PubMed] [Google Scholar]
- 34.Lee R. H., B. Kim, I. Choi, H. Kim, H. S. Choi, K. Suh, Y. C. Bae, and J. S. Jung. 2004. Characterization and expression analysis of mesenchymal stem cells from human bone marrow and adipose tissue. Cell. Physiol. Biochem. 14 311–324. [DOI] [PubMed] [Google Scholar]
- 35.Novikoff A. B., P. M. Novikoff, O. M. Rosen, and C. S. Rubin. 1980. Organelle relationships in cultured 3T3–L1 preadipocytes. J. Cell Biol. 87 180–196. [DOI] [PMC free article] [PubMed] [Google Scholar]
- 36.Tondreau T., N. Meuleman, A. Delforge, M. Dejeneffe, R. Leroy, M. Massy, C. Mortier, D. Bron, and L. Lagneaux. 2005. Mesenchymal stem cells derived from CD133-positive cells in mobilized peripheral blood and cord blood: proliferation, Oct4 expression, and plasticity. Stem Cells. 23 1105–1112. [DOI] [PubMed] [Google Scholar]
- 37.Kim J. Y., E. van de Wall, M. Laplante, A. Azzara, M. E. Trujillo, S. M. Hofmann, T. Schraw, J. L. Durand, H. Li, G. Li, et al. 2007. Obesity-associated improvements in metabolic profile through expansion of adipose tissue. J. Clin. Invest. 117 2621–2637. [DOI] [PMC free article] [PubMed] [Google Scholar]
- 38.Nicolai A., M. Li, D. H. Kim, S. J. Peterson, L. Vanella, V. Positano, A. Gastaldelli, R. Rezzani, L. F. Rodella, G. Drummond, et al. 2009. Heme Oxygenase-1 induction remodels adipose tissue and improves insulin sensitivity in obesity-induced diabetic rats. Hypertension. 53 508–515. [DOI] [PMC free article] [PubMed] [Google Scholar]
- 39.Khan T., E. S. Muise, P. Iyengar, Z. V. Wang, M. Chandalia, N. Abate, B. B. Zhang, P. Bonaldo, S. Chua, and P. E. Scherer. 2009. Metabolic dysregulation and adipose tissue fibrosis: role of collagen VI. Mol. Cell Biol. 29 1575–1591. [DOI] [PMC free article] [PubMed] [Google Scholar]
- 40.Williams I. L., P. J. Chowienczyk, S. B. Wheatcroft, A. Patel, R. Sherwood, A. Momin, A. M. Shah, and M. T. Kearney. 2006. Effect of fat distribution on endothelial-dependent and endothelial-independent vasodilatation in healthy humans. Diabetes Obes. Metab. 8 296–301. [DOI] [PubMed] [Google Scholar]
- 41.Bastard J. P., M. Maachi, J. T. Van Nhieu, C. Jardel, E. Bruckert, A. Grimaldi, J. J. Robert, J. Capeau, and B. Hainque. 2002. Adipose tissue IL-6 content correlates with resistance to insulin activation of glucose uptake both in vivo and in vitro. J. Clin. Endocrinol. Metab. 87 2084–2089. [DOI] [PubMed] [Google Scholar]
- 42.Maachi M., L. Pieroni, E. Bruckert, C. Jardel, S. Fellahi, B. Hainque, J. Capeau, and J. P. Bastard. 2004. Systemic low-grade inflammation is related to both circulating and adipose tissue TNFalpha, leptin and IL-6 levels in obese women. Int. J. Obes. Relat. Metab. Disord. 28 993–997. [DOI] [PubMed] [Google Scholar]
- 43.Hingorani A. D., J. Cross, R. K. Kharbanda, M. J. Mullen, K. Bhagat, M. Taylor, A. E. Donald, M. Palacios, G. E. Griffin, J. E. Deanfield, et al. 2000. Acute systemic inflammation impairs endothelium-dependent dilatation in humans. Circulation. 102 994–999. [DOI] [PubMed] [Google Scholar]
- 44.Muse E. D., T. K. Lam, P. E. Scherer, and L. Rossetti. 2007. Hypothalamic resistin induces hepatic insulin resistance. J. Clin. Invest. 117 1670–1678. [DOI] [PMC free article] [PubMed] [Google Scholar]
- 45.Lazar M. A. 2005. How obesity causes diabetes: not a tall tale. Science. 307 373–375. [DOI] [PubMed] [Google Scholar]
- 46.Kondo H., I. Shimomura, Y. Matsukawa, M. Kumada, M. Takahashi, M. Matsuda, N. Ouchi, S. Kihara, T. Kawamoto, S. Sumitsuji, et al. 2002. Association of adiponectin mutation with type 2 diabetes: a candidate gene for the insulin resistance syndrome. Diabetes. 51 2325–2328. [DOI] [PubMed] [Google Scholar]
- 47.Fasshauer M., J. Klein, S. Neumann, M. Eszlinger, and R. Paschke. 2001. Adiponectin gene expression is inhibited by beta-adrenergic stimulation via protein kinase A in 3T3–L1 adipocytes. FEBS Lett. 507 142–146. [DOI] [PubMed] [Google Scholar]
- 48.Bahia L., L. G. Aguiar, N. Villela, D. Bottino, A. F. Godoy-Matos, B. Geloneze, M. Tambascia, and E. Bouskela. 2006. Relationship between adipokines, inflammation, and vascular reactivity in lean controls and obese subjects with metabolic syndrome. Clinics. 61 433–440. [DOI] [PubMed] [Google Scholar]
- 49.Han S. H., M. J. Quon, J. A. Kim, and K. K. Koh. 2007. Adiponectin and cardiovascular disease: response to therapeutic interventions. J. Am. Coll. Cardiol. 49 531–538. [DOI] [PubMed] [Google Scholar]
- 50.Fontana L., J. C. Eagon, M. E. Trujillo, P. E. Scherer, and S. Klein. 2007. Visceral fat adipokine secretion is associated with systemic inflammation in obese humans. Diabetes. 56 1010–1013. [DOI] [PubMed] [Google Scholar]
- 51.Iwashima Y., T. Horio, Y. Suzuki, S. Kihara, H. Rakugi, K. Kangawa, T. Funahashi, T. Ogihara, and Y. Kawano. 2006. Adiponectin and inflammatory markers in peripheral arterial occlusive disease. Atherosclerosis. 188 384–390. [DOI] [PubMed] [Google Scholar]
- 52.Yamauchi T., Y. Nio, T. Maki, M. Kobayashi, T. Takazawa, M. Iwabu, M. Okada-Iwabu, S. Kawamoto, N. Kubota, T. Kubota, et al. 2007. Targeted disruption of AdipoR1 and AdipoR2 causes abrogation of adiponectin binding and metabolic actions. Nat. Med. 13 332–339. [DOI] [PubMed] [Google Scholar]
- 53.Kearney M. T., E. R. Duncan, M. Kahn, and S. B. Wheatcroft. 2008. Insulin resistance and endothelial cell dysfunction: studies in mammalian models. Exp. Physiol. 93 158–163. [DOI] [PubMed] [Google Scholar]
- 54.Duncan E., P. Crossey, S. Walker, N. Anilkumar, L. Poston, G. Douglas, V. Ezzat, S. Wheatcroft, A. M. Shah, and M. Kearney. 2008. The effect of endothelium-specific insulin resistance on endothelial function in vivo. Diabetes. 57 3307–3314. [DOI] [PMC free article] [PubMed] [Google Scholar]
- 55.Fleming I., C. Schulz, B. Fichtlscherer, B. E. Kemp, B. Fisslthaler, and R. Busse. 2003. AMP-activated protein kinase (AMPK) regulates the insulin-induced activation of the nitric oxide synthase in human platelets. Thromb. Haemost. 90 863–871. [DOI] [PubMed] [Google Scholar]
- 56.Kovacic S., C. L. Soltys, A. J. Barr, I. Shiojima, K. Walsh, and J. R. Dyck. 2003. Akt activity negatively regulates phosphorylation of AMP-activated protein kinase in the heart. J. Biol. Chem. 278 39422–39427. [DOI] [PubMed] [Google Scholar]
- 57.Longnus S. L., C. Segalen, J. Giudicelli, M. P. Sajan, R. V. Farese, and O. E. Van. 2005. Insulin signalling downstream of protein kinase B is potentiated by 5′AMP-activated protein kinase in rat hearts in vivo. Diabetologia. 48 2591–2601. [DOI] [PubMed] [Google Scholar]
- 58.Hardie D. G. 2003. Minireview: the AMP-activated protein kinase cascade: the key sensor of cellular energy status. Endocrinology. 144 5179–5183. [DOI] [PubMed] [Google Scholar]
- 59.Hardie D. G. 2007. AMP-activated protein kinase as a drug target. Annu. Rev. Pharmacol. Toxicol. 47 185–210. [DOI] [PubMed] [Google Scholar]
- 60.Di Noia M. A., D. S. Van, F. Palmieri, L. M. Yang, S. Quan, A. I. Goodman, and N. G. Abraham. 2006. Heme oxygenase-1 enhances renal mitochondrial transport carriers and cytochrome C oxidase activity in experimental diabetes. J. Biol. Chem. 281 15687–15693. [DOI] [PubMed] [Google Scholar]
- 61.Ouchi N., H. Kobayashi, S. Kihara, M. Kumada, K. Sato, T. Inoue, T. Funahashi, and K. Walsh. 2004. Adiponectin stimulates angiogenesis by promoting cross-talk between AMP-activated protein kinase and Akt signaling in endothelial cells. J. Biol. Chem. 279 1304–1309. [DOI] [PMC free article] [PubMed] [Google Scholar]
- 62.Sun J. F., T. Phung, I. Shiojima, T. Felske, J. N. Upalakalin, D. Feng, T. Kornaga, T. Dor, A. M. Dvorak, K. Walsh, et al. 2005. Microvascular patterning is controlled by fine-tuning the Akt signal. Proc. Natl. Acad. Sci. USA. 102 128–133. [DOI] [PMC free article] [PubMed] [Google Scholar]
- 63.Schulz E., J. Dopheide, S. Schuhmacher, S. R. Thomas, K. Chen, A. Daiber, P. Wenzel, T. Munzel, and J. F. Keaney, Jr. 2008. Suppression of the JNK pathway by induction of a metabolic stress response prevents vascular injury and dysfunction. Circulation. 118 1347–1357. [DOI] [PMC free article] [PubMed] [Google Scholar]
- 64.Chen K., M. T. Kirber, H. Xiao, Y. Yang, and J. F. Keaney, Jr. 2008. Regulation of ROS signal transduction by NADPH oxidase 4 localization. J. Cell Biol. 181 1129–1139. [DOI] [PMC free article] [PubMed] [Google Scholar]
- 65.Murabito J. M., M. J. Keyes, C. Y. Guo, J. F. Keaney, Jr., R. S. Vasan, R. B. D'Agostino, Sr., and E. J. Benjamin. 2008. Cross-sectional relations of multiple inflammatory biomarkers to peripheral arterial disease: The Framingham Offspring Study. Atherosclerosis. 203 509–514. [DOI] [PMC free article] [PubMed] [Google Scholar]