

Summary
Self- and kin-discrimination are observed in most kingdoms of life and are mediated by highly polymorphic plasma membrane proteins [1-7]. Sequence polymorphism, which is essential for effective recognition, is maintained by balancing selection [8-10]. Dictyostelium discoideum are social amoebae that propagate as unicellular organisms, but aggregate upon starvation and from fruiting bodies with viable spores and dead stalk cells. Aggregative development exposes Dictyostelium to the perils of chimerism, including cheating, which raises questions about how the victims survive in nature and how social cooperation persists [11-15]. Dictyostelids can minimize the cost of chimerism by preferential cooperation with kin [16-18], but the mechanisms of kin-discrimination are largely unknown. Dictyostelium lag-genes encode transmembrane proteins with multiple immunoglobulin (Ig) repeats that participate in cell-adhesion and signaling [19-25]. Here we describe their role in kin-discrimination. We show that lagB1 and lagC1 are highly polymorphic in natural populations and that their sequence dissimilarity correlates well with wild-strain segregation. Deleting lagB1 and lagC1 results in strain segregation in chimerae with wild-type cells, whereas elimination of the nearly invariant homolog lagD1 has no such consequences. These findings reveal an early evolutionary origin of kin-discrimination and provide insight into the mechanism of social recognition and immunity.
Results and Discussion
lagC1 and lagD1 encode similar proteins (59% identity) and have similar developmental functions [21]. lagC1 resides next to lagB1, which encodes another predicted transmembrane protein with several Ig repeats, and lagD1 resides next to lagE1 – a close homolog of lagB1 (68% identity) [25]. In both gene pairs, the ORFs face away from each other, separated by a short intergenic sequence. To test whether these gene pairs could be involved in kin discrimination, we measured their polymorphism levels in wild isolates. We sequenced these genes in wild isolates and found that lagB1 and lagC1 are polymorphic (Fig. 1) whereas lagD1 and lagE1 are nearly invariant (data not shown). The ratio between non-synonymous (dN) and synonymous (dS) substitutions is an indicator of evolutionary processes, whereby dN/dS > 1 suggests positive selection [26]. We found that lagB1 and lagC1 contain regions with dN/dS ratios as high as 2–4 (Fig. 1), which is comparable with values found in mammalian MHC genes [9]. In lagD1 and lagE1 the ratios were smaller than 1 (data not shown). Therefore, lagB1 and lagC1 are probably evolving under positive selection, possibly balancing selection considering the high number of polymorphic alleles [8], and the homologs lagD1 and lagE1 must be under purifying selection. Polymorphism is an essential feature of recognition proteins because it provides the molecular basis for self-identity. We therefore conclude that lagB1 and lagC1 are more likely to be involved in kin-recognition than lagD1 and lagE1.
Figure 1. Sequence polymorphism.

We amplified and sequenced genes from several D. discoideum strains and aligned the sequences of each gene separately. We determined the position of variable nucleotides and determined whether each variation corresponds to a synonymous (S) or a non-synonymous (N) variation in the protein sequence. The upper box of each panel represents the synonymous variations as green bars above the zero-line and the non-synonymous variations as red bars below the line. The x-axis indicates the codon number in the ORF and the y-axis indicates the frequency of the variation in each strain compared to all the other strains. We used the nucleotide variation data to compute the dN/dS ratio at each codon in a sliding window of 31 codons along the entire coding sequence. The data are plotted in the lower box of each panel, the x-axis indicates the codon number in the ORF and the y-axis indicates the dN/dS ratio. Data above the line (dN/dS = 1) suggest that the region is under balancing or positive selection. A. lagB1 exhibited a total of 266 polymorphic codons with as many as 8 variations per codon (30 strains tested). B. lagC1 exhibited 319 polymorphic codons with as many as 7 variants per codon (29 strains tested). We also sequenced lagD1 and lagE1. lagD1 exhibited only 9 polymorphic codons with no more than 2 variants per codon (15 strains tested) and lagE1 exhibited 10 polymorphic codons with only 2 variants per codon (6 strains tested). The dN/dS ratio was much lower than 1 in both cases (data not shown). Information about the strains and the genes we sequenced is provided in Supplement Table S1.
lagC1 and lagD1 mRNAs are developmentally regulated [21], so we tested the regulation of the respective tandem genes, lagB1 and lagE1. Fig. 2A shows that the lagB1 and lagC1 expression patterns are nearly indistinguishable, with mRNA levels peaking at 8-12 hrs, corresponding to the transition from loose aggregate to tight aggregate. Fig. 2B shows that lagD1 and lagE1 mRNA levels are also nearly indistinguishable with a peak at 16 hrs, corresponding to the finger stage of development. The tandem genes are therefore coordinately regulated, probably due to common regulatory elements that reside between their ORFs.
Figure 2. Developmental regulation and function of lag-genes.
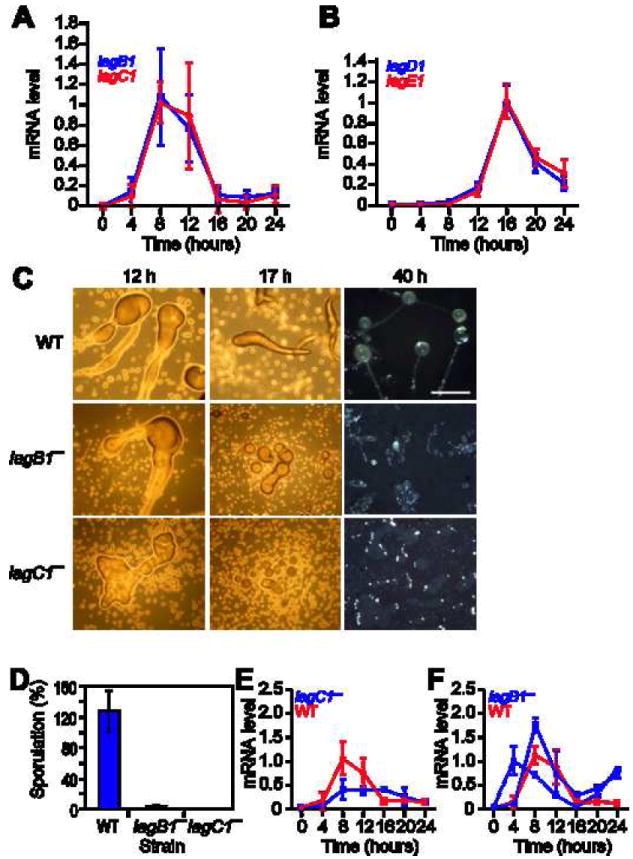
We used quantitative RT-PCR to measure the mRNA levels of lag-genes in samples collected at 4-hour intervals from developing wild type AX4 cells. At 0 hours, the cells are at the vegetative stage, at 4 hours they are starving, at 8 hours they begin to aggregate, at 12 hours they form tight aggregates with differentiated prespore and prestalk cells, at 16 hours they form fingers with prestalk cells in the anterior end, at 20 hours they begin to culminate and at 24 hours they form mature fruiting bodies with a ball of spores aloft a cellular stalk. The time (hours) is indicated on the x-axis and the mRNA level is indicated on the y-axis in arbitrary units, relative to the maximal level of expression. The results are presented as averages and standard deviations of three technical replications of each of two biological samples (a total of 6 measurements). A. lagB1 mRNA (blue) and lagC1 mRNA (red). B. lagD1 mRNA (blue) and lagE1 mRNA (red). We mutated the lagB1 gene, developed wild type and mutant cells for the indicated time (hours) and analyzed their development. C. Morphological analysis: growth and early developmental properties of the three strains were nearly indistinguishable (data not shown). We show morphological differences between cells developed on non-nutrient agar (12h, 17h) and on dark nitrocellulose filters (40h). The genotypes are indicated on the left. Pictures were taken from above the structure. Bar – 0.5mm. D. Sporulation efficiency: we counted the number of spores collected after 30 hours and present the data as a fraction (%) of the number of amoebae deposited for development. The genotypes are indicated below the bars. Results are the means and standard deviations of 3 independent replications. Gene expression: We used quantitative RT-PCR to measure mRNA levels in samples collected at 4-hour intervals from developing cells. The graphs are as above and the results are presented as averages and standard deviations of three technical replications of each of two biological samples (a total of 6 measurements) except as indicated. E. lagB1 mRNA in wild type cells (red) and in lagC1− cells (blue). F. lagC1 mRNA in wild type cells (red) and in lagB1− cells (blue). The lagB1− cells exhibited large differences between biological samples, probably because the cells do not develop synchronously, so we show 2 biological experiments out of 4 that we have performed (solid and dashed blue lines). The data are averages and standard deviations of three technical replications.
lagC1 is essential for aggregation and for subsequent development [19-24], so we tested whether lagB1 was also involved in development. We disrupted lagB1 and compared the mutant to the parental AX4 strain and to lagC1− cells. lagB1− cells failed to progress beyond the loose aggregate stage after 12 and 17 hrs of development, similar to lagC1−, whereas the wild type formed tipped aggregates and slugs at the respective times (Fig. 2C). A few lagB1− mounds formed small, gnarled fruiting bodies after 40 hrs (Fig. 2C). Neither mutant produced spores in the first 24 hrs of development (data not shown), but 2% of the lagB1− cells formed spores after 30 hrs (Fig. 2D). Therefore, lagC1 and lagB1 are essential for aggregation and for subsequent development, suggesting common functions.
The proximity of lagC1 and lagB1 raised the possibility that disrupting one gene might have inadvertently disrupted the other. To test that possibility, we measured lagB1 mRNA in lagC1− cells and vice versa. lagB1 mRNA was present in the lagC1− cells, although the levels were lower and the mRNA persisted relative to the wild type (Fig. 2E). lagC1 mRNA was present in the lagB1− cells at levels similar to the wild type (Fig. 2F). These observations indicate that deleting one gene did not directly inactivate the other. The reduced levels and the persistence of lagB1 mRNA in lagC1− cells probably reflect the delayed development of the mutants, but it is formally possible that they contributed directly to the observed phenotypes.
The patterns of sequence polymorphism and gene expression, and the phenotypes of the null-mutants suggested that lagB1 and lagC1 are likely to function together in kin discrimination. To test that possibility we followed cells in chimerae between differentially labeled strains. In control chimerae, AX4-GFP and AX4-RFP cells exhibited equal mixing of green- and red-fluorescent cells at the aggregation stage (10-12 hrs) and at the finger stage (16-19 hrs), indicating that the fluorescent markers do not cause segregation (Fig. 3A i and ii). Mixing AX4-RFP with lagB1−–GFP yielded a different pattern: the red-fluorescent wild type and the green-fluorescent mutant co-aggregated at first, but then segregated into regions enriched in either red- or green-fluorescent cells during mound formation (Fig. 3A iii). The mounds progressed into slugs that contained cells from both strains, but the lagB1− cells were enriched in the middle of the slugs (Fig. 3A iv). This enrichment in the prespore region suggested that the mutant may cheat on the wild type [14], but a direct test did not support this hypothesis (data not shown).
Figure 3. Segregation of cell-cell adhesion mutants from wild type and from lagC1− cells.

A. We mixed wild-type (AX4) cells labeled with RFP with different strains labeled with GFP. We developed the cells on a solid substratum, photographed the aggregates after 10-12 hours and after 16-19 hours of development with fluorescence microscopy at the appropriate wavelengths, and merged the red and green images. Bar – 0.5mm. B. To test the adhesion properties of the cells, we developed separately wild-type (AX4) cells labeled with RFP and lagC1− cells labeled with GFP. We disaggregated the cells after 5 hours (B i, bar – 1.0 mm) and after 12 hours (B ii, bar – 0.5 mm) of development, as indicated, mixed the cells with unlabeled counterparts, and allowed them to re-aggregate in shaking suspension. We photographed the mixed aggregates as above. C. To test interactions between pairs of mutant strains, we mixed lagC1− cells labeled with RFP with different strains labeled with GFP (C, i-vi) and lagC1− cells labeled with GFP with different strains labeled with RFP (C, vii-x), as indicated, developed them on a solid substrate and photographed them as above. Bar – 0.5 mm. The genotypes are indicated on the left of each row.
The results observed with lagC1− were even more dramatic. Cells from the two strains co-aggregated at first, but then segregated within the loose aggregates (Fig. 3A v). Several hours later, the AX4-RFP cells formed migrating slugs that contained a few lagC1−-GFP cells and migrated away, leaving behind mounds of mainly lagC1−-GFP cells (Fig. 3A vi). These results suggest that lagC1 and lagB1 play a role in kin-discrimination, although lagB1 plays a lesser role than lagC1.
To test the kin-discrimination role of lagD1, we mixed lagD1−-GFP with AX4-RFP cells. The strains mixed well and remained mixed throughout development (Fig. 3A vii and viii). These results do not support a role for lagD1 in kin-discrimination, even though lagD1 shares many other properties with lagC1 [21], highlighting the difference between the polymorphic lagC1 gene and the nearly invariant lagD1 homolog.
LagC1 is a cell-adhesion protein [22, 24], so we tested whether other adhesion genes participate in kin-discrimination. cadA [22, 27] and csaA [28] encode two thoroughly studied cell-cell adhesion proteins [22]. We tested the respective null-mutants in chimerae with AX4 cells and found no evidence of segregation (Fig. 3A ix-xii), arguing against a general role for cell-adhesion genes in kin-discrimination. These results are not in conflict with work that described csaA as a greenbeard gene [29, 30]. In those experiments, csaA− segregated from the wild type during development on soil but not on agar. Moreover, the sequence conservation of csaA in wild strains (unpublished data) is inconsistent with a direct role in kin-discrimination.
The segregation of lagC1− from AX4 could have resulted from differential adhesion. To test the adhesion properties of the strains, we developed them in pure populations for 5 and 12 hrs. We disaggregated the cells, mixed them, and allowed them to reaggregate in liquid suspension. We found mixed aggregates in both cases (Fig. 3B i and ii), indicating mutual adherence and suggesting that differential adhesion cannot account for the segregation observed in Fig. 3A. Moreover, the 12-hrs cells became segregated within the mixed aggregates (Fig. 3B ii), consistent with the proposed role of lagC1 in kin-discrimination.
lagB1, lagC1 and lagD1 have similar developmental roles because mutations in either one cause a developmental arrest at the loose aggregate stage ([19, 21]; Fig. 2C). We further tested their roles in kin-discrimination by testing chimerae between lagC1− and other mutants (Fig. 3C). The control experiment showed that the differential labels did not cause segregation (Fig. 3C i and ii). To test whether lagB1 and lagC1 participate in one kin-discrimination pathway, we mixed differentially labeled cells of the respective mutants and observed no segregation at any stage (Fig. 3C iii and iv). Conversely, lagC1− and lagD1− first co-aggregated (Fig. 3C v), but then segregated into clusters consisting mainly of one or the other strain (Fig. 3C vi). The latter observation suggests that segregation is not a result of differential developmental progression because the strains segregate even though both progress to the same developmental stage.
These results suggest that lagB1 and lagC1, but not lagD1, function in one kin-discrimination pathway. This conclusion is also supported by the finding that lagB1 and lagC1 are physically mapped near each other, so they are likely to be inherited together in a syntenic block as seen in other kin-discrimination genes [2], and by the observation of developmental co-regulation (Fig. 2A), which provides the temporal opportunity for common function.
We also tested the role of other cell-adhesion genes by mixing lagC1− with cadA− or with csaA−. In both cases the cells co-aggregate initially, but then segregated into structures that consisted mainly of one strain or the other (Fig. 3C vii-x). These results suggest that the kin-discrimination roles of lagB1 and lagC1 are specific to these genes rather than a general property of cell-cell adhesion genes.
Mixing AX4 cells with genetically dissimilar cells results in partial segregation, implying a kin-discrimination mechanism [18]. The properties of lagB1 and lagC1 suggest they might participate in that mechanism. To examine the correlation between the lagB1 and lagC1 sequence polymorphism and segregation we computed the dissimilarities between the AX4 LagB1 and LagC1 sequences and the respective sequences in 11 wild isolates. We then computed the correlation between these dissimilarities and the published strain segregation data [18]. We observed a positive correlation between sequence dissimilarity and segregation, although it was weaker than the correlation with genetic distances inferred from microsatellite length (Supplement Table S2). We then searched and found protein domains within LagB1 and LagC1 that exhibited better correlations between sequence dissimilarity and strain segregation (Supplement Table S2). In LagB1, the correlation was best between aa 239-259 and in LagC1 it was between aa 180-197 (Supplement Fig. S1). Both regions reside near the first Ig-fold of the extracellular domain, suggesting that specific extracellular domains may have a function in segregation.
Because we tested many correlations, one or more could have been strong just by chance. However, if these correlations reflect a causative relationship, they should be predictive of strain segregation, which would be less likely if they were serendipitous. Ostrowski et al. mixed three wild strains, QS32, QS33 and QS38, all of which segregated from AX4. QS32 and QS33 are genetically close to each other and distant from QS38. In that experiment, QS32 did not segregate from itself or from QS33, but segregated from the genetically dissimilar strain QS38 [18]. Table 1 shows that our sequence data predict low segregation of QS32 from QS33 and high segregation of QS38 from QS32. Therefore, the predictions of the sequence-based segregation model correlate well with the observations, supporting the hypothesis that LagB1 and LagC1 play a direct role in kin-discrimination.
Table 1.
Prediction of strain segregation from lagB1 and lagC1 sequence dissimilarity
| Strains | Reported segregation a | Predicted segregation | |
|---|---|---|---|
| lagB1 sequence | lagC1 sequence | ||
| QS32 / QS32 | 0.9 | 0 | 0 |
| QS33 / QS32 | 2.5 | 0 | 0.3 |
| QS38 / QS32 | 201.5 | 61.3 | 257.4 |
| Pearson’s correlation | 0.9999 | 0.9999 | |
| p-value | 0.0044 | 0.0038 | |
recalculated from [18]
Our data suggest that lagB1 and lagC1 participate in a common self- or kin-recognition mechanism in D. discoideum. In other organisms, genetic crosses between organisms with polymorphic alleles have provided support for the role of such genes in self/nonself-recognition [3, 31]. Since D. discoideum is not amenable to these types of studies, tests of the causative relationships between lag-genes and kin-recognition would have to be accomplished by other means. Nevertheless, our findings suggest that the molecular mechanisms that regulate kin-recognition evolved before the evolutionary departure of the amoebazoa from the evolutionary line leading to animals, illustrating the critical role of these mechanisms in multicellularity and in sociality.
Experimental procedures
Cells, growth and development
Cells were grown in shaking suspension, harvested at the logarithmic growth phase and developed on filters [32] or on agar [33] as indicated. Wild isolates (Supplement Table S1) were grown in association with bacteria. The cadA− strain TL97 [27] and the csaA− strain T10 [34] were obtained from the Dictyostelium stock center. The lagD1− strain was described before [21]. Detailed information is provided in the supplement.
Construction of new strains
We constructed and used vectors for deletion of lagB1 and lagC1 by homologous recombination (see supplement for detailed information). The knockout plasmids were confirmed by sequencing, linearized and transformed into AX4 cells by electroporation. Clones were identified by PCR analysis and confirmed by Southern blot analysis [32].
For labeling cells with fluorescent proteins, we constructed several new vectors for expression of RFP and GFP under the actin15 promoter (see supplement for complete detail). The vectors were transformed into AX4 and into the various mutants.
Segregation assays
Strains were grown in pure populations, washed and mixed at 1:1 ratios, and deposited on non-nutrient agar (see supplement for detailed information). Developmental structures were photographed with epi-fluorescence microscopy at the appropriate wavelengths and images were overlaid without further manipulation. The results are shown as color photographs.
Sporulation Efficiency
Cells were grown and then developed for 30 hours. Sporulation efficiency was measured as described [35]. Each strain was tested in two independent biological replications. Each sample was developed on 3 filters and samples from each filter were counted thrice. Sporulation efficiency was calculated as the fraction (%) of spores recovered relative to the number of cells that were developed.
RNA Extraction and Quantitative RT-PCR
For RNA production, vegetative cells (5 × 10⁷ total) were resuspended in 500 μl Trizol reagent (Invitrogen). Developing cells were collected and resuspended in 500 μl Trizol, incubated at room temperature for 5 minutes and stored at −80°C. RNA was extracted according to the manufacturer’s recommended protocol. RNA concentration was calculated by absorbance at 260 nm. cDNA was produced by reverse transcription and quantified by real time PCR. Each strain was developed in two independent replicates and each RNA sample was analyzed thrice by quantitative PCR. Data and standard deviations were calculated across the 6 replicates (see supplement for detailed information).
Sequencing genes from wild strains
Genomic DNA was extracted as described [32]. To sequence lagB1, lagC1, lagD1 and lagE1, we used one set of primers to amplify the entire structural gene from genomic DNA and another set of primers to amplify smaller fragments from the initial PCR product. Each nested PCR primer pair contained universal primer tags for sequencing. The PCR products were purified and sequenced using an Applied Biosystems 3730xl automatic sequencer. Detailed information, GenBank accession numbers of the sequences we used and the sequences of all the oligonucleotides are provided in the supplement.
Analysis of polymorphic sequences
The regions of the genes used for analysis are provided in Supplemental Table S1. Multiple sequence alignments were performed with the Clustal W algorithm in MacVector 7.2.3. Intronic sequences were deleted manually and the alignments were adjusted accordingly. We used the Nei and Gojobori method to calculate the number of synonymous (dS) and non-synonymous (dN) nucleotide substitutions per site for a given pair of homologous sequences [36]. The gene coding sequences of a given pair of strains were scanned with a sliding window spanning 101, 81 and 31 aa with essentially identical results (31 aa windows shown), and the dN/dS ratio was calculated at each position. The dN/dS ratios reported are an average across all pair-wise comparisons.
Correlation between sequence polymorphism and segregation
We calculated the Spearman’s rank correlation between the calculated protein sequence dissimilarity and the segregation variance values reported by Ostrowski et al. [18] for 12 strains (AX4, NC4, QS32, QS33, QS34, QS36, QS37, QS38, QS40, QS41, QS45, QS113). Both the sequence similarity and the segregation were measured against a common reference strain (AX4). Sequence dissimilarity was calculated in all subintervals between 5 and 13 aa over each protein position. We used three protein similarity matrixes (PAM250, BLOSSUM, GONNET) to calculate similarity and then negating it to obtain dissimilarity. We then fitted a linear model relating sequence dissimilarity and segregation for each subinterval with high positive Spearman’s rank correlation (r ≥ 0.65 and p < 0.025). The final model is a composite (ensemble) of linear models (140 for lagB1 and 24 for lagC1), each represented by the coordinates of the identified subinterval, sequence similarity matrix used, and coefficients for linear regression. When the composite model was applied to a new sequence, each linear model predicted the level of segregation based on the sequence similarity in its specific subinterval. The final prediction of the composite model is an average of the predictions of all the linear models. We built two composite models, one for each gene (lagB1, lagC1) and present the final prediction as the relative contribution of each model among all models (y-axis) that span each position (x-axis) (Supplement Fig. S1; see Supplement for additional details).
We also adapted the models built on the AX4 reference data and applied them to predict the segregation of strains QS32, QS33 and QS38 from strain QS32. In that case, the models were adjusted (shifted by a constant value) to predict zero segregation when the reference strain was mixed with self.
Supplementary Material
Acknowledgments
We are grateful to Chandra Jack for curating the wild strains, the Dicty stock center for plasmids and axenic Dictyostelium strains, to John Landolt for strains QS42 and QS43, to Tomoaki Abe for the pEZTN∷tetR-A15hygR plasmid, and to Roger Tsien for the RFP construct. This work was supported by grants from the National Science Foundation (EF-0626963, EF-0328455, and DEB-0816690) and from the National Institute of Health (P01-HD39691). Rocio Benabentos was supported in part by an NRSA grant F31 GM086131-01 from the National Institute of Health and in part by a National Science Foundation Graduate Research Fellowship ID#2006042535. Elizabeth Ostrowski was supported by a postdoctoral fellowship from the Keck Center for Interdisciplinary Bioscience Training of the Gulf Coast Consortia (NLM grant no. 5T15LM07093). Tomaz Curk and Blaz Zupan were supported in part by Program grant P2-0209 and Project grant J2-9699 from the Slovenian Research Agency.
Footnotes
Publisher's Disclaimer: This is a PDF file of an unedited manuscript that has been accepted for publication. As a service to our customers we are providing this early version of the manuscript. The manuscript will undergo copyediting, typesetting, and review of the resulting proof before it is published in its final citable form. Please note that during the production process errors may be discovered which could affect the content, and all legal disclaimers that apply to the journal pertain.
References
- 1.Bergelson J, Kreitman M, Stahl EA, Tian D. Evolutionary dynamics of plant R-genes. Science. 2001;292:2281–2285. doi: 10.1126/science.1061337. [DOI] [PubMed] [Google Scholar]
- 2.Boehm T. Quality control in self/nonself discrimination. Cell. 2006;125:845–858. doi: 10.1016/j.cell.2006.05.017. [DOI] [PubMed] [Google Scholar]
- 3.De Tomaso AW, Nyholm SV, Palmeri KJ, Ishizuka KJ, Ludington WB, Mitchel K, Weissman IL. Isolation and characterization of a protochordate histocompatibility locus. Nature. 2005;438:454–459. doi: 10.1038/nature04150. [DOI] [PMC free article] [PubMed] [Google Scholar]
- 4.Gibbs KA, Urbanowski ML, Greenberg EP. Genetic determinants of self identity and social recognition in bacteria. Science. 2008;321:256–259. doi: 10.1126/science.1160033. [DOI] [PMC free article] [PubMed] [Google Scholar]
- 5.Harada Y, Takagaki Y, Sunagawa M, Saito T, Yamada L, Taniguchi H, Shoguchi E, Sawada H. Mechanism of self-sterility in a hermaphroditic chordate. Science. 2008;320:548–550. doi: 10.1126/science.1152488. [DOI] [PubMed] [Google Scholar]
- 6.Hattori D, Demir E, Kim HW, Viragh E, Zipursky SL, Dickson BJ. Dscam diversity is essential for neuronal wiring and self-recognition. Nature. 2007;449:223–227. doi: 10.1038/nature06099. [DOI] [PMC free article] [PubMed] [Google Scholar]
- 7.Matthews BJ, Kim ME, Flanagan JJ, Hattori D, Clemens JC, Zipursky SL, Grueber WB. Dendrite self-avoidance is controlled by Dscam. Cell. 2007;129:593–604. doi: 10.1016/j.cell.2007.04.013. [DOI] [PubMed] [Google Scholar]
- 8.Charlesworth D. Balancing selection and its effects on sequences in nearby genome regions. PLoS Genet. 2006;2:e64. doi: 10.1371/journal.pgen.0020064. [DOI] [PMC free article] [PubMed] [Google Scholar]
- 9.Hughes AL, Nei M. Pattern of nucleotide substitution at major histocompatibility complex class I loci reveals overdominant selection. Nature. 1988;335:167–170. doi: 10.1038/335167a0. [DOI] [PubMed] [Google Scholar]
- 10.Richman A. Evolution of balanced genetic polymorphism. Mol Ecol. 2000;9:1953–1963. doi: 10.1046/j.1365-294x.2000.01125.x. [DOI] [PubMed] [Google Scholar]
- 11.Foster KR, Fortunato A, Strassmann JE, Queller DC. The costs and benefits of being a chimera. Proc Biol Sci. 2002;269:2357–2362. doi: 10.1098/rspb.2002.2163. [DOI] [PMC free article] [PubMed] [Google Scholar]
- 12.Shaulsky G, Kessin RH. The cold war of the social amoebae. Curr Biol. 2007;17:R684–692. doi: 10.1016/j.cub.2007.06.024. [DOI] [PubMed] [Google Scholar]
- 13.Fortunato A, Strassmann JE, Santorelli L, Queller DC. Co-occurrence in nature of different clones of the social amoeba, Dictyostelium discoideum. Mol Ecol. 2003;12:1031–1038. doi: 10.1046/j.1365-294x.2003.01792.x. [DOI] [PubMed] [Google Scholar]
- 14.Santorelli LA, Thompson CR, Villegas E, Svetz J, Dinh C, Parikh A, Sucgang R, Kuspa A, Strassmann JE, Queller DC, Shaulsky G. Facultative cheater mutants reveal the genetic complexity of cooperation in social amoebae. Nature. 2008;451:1107–1110. doi: 10.1038/nature06558. [DOI] [PubMed] [Google Scholar]
- 15.Strassmann JE, Zhu Y, Queller DC. Altruism and social cheating in the social amoeba Dictyostelium discoideum. Nature. 2000;408:965–967. doi: 10.1038/35050087. [DOI] [PubMed] [Google Scholar]
- 16.Gilbert OM, Foster KR, Mehdiabadi NJ, Strassmann JE, Queller DC. High relatedness maintains multicellular cooperation in a social amoeba by controlling cheater mutants. Proc Natl Acad Sci U S A. 2007;104:8913–8917. doi: 10.1073/pnas.0702723104. [DOI] [PMC free article] [PubMed] [Google Scholar]
- 17.Mehdiabadi NJ, Jack CN, Farnham TT, Platt TG, Kalla SE, Shaulsky G, Queller DC, Strassmann JE. Social evolution: kin preference in a social microbe. Nature. 2006;442:881–882. doi: 10.1038/442881a. [DOI] [PubMed] [Google Scholar]
- 18.Ostrowski EA, Katoh M, Shaulsky G, Queller DC, Strassmann JE. Kin discrimination increases with genetic distance in a social amoeba. PLoS Biol. 2008;6:e287. doi: 10.1371/journal.pbio.0060287. [DOI] [PMC free article] [PubMed] [Google Scholar]
- 19.Dynes JL, Clark AM, Shaulsky G, Kuspa A, Loomis WF, Firtel RA. LagC is required for cell-cell interactions that are essential for cell-type differentiation in Dictyostelium. Genes Dev. 1994;8:948–958. doi: 10.1101/gad.8.8.948. [DOI] [PubMed] [Google Scholar]
- 20.Iranfar N, Fuller D, Loomis WF. Transcriptional regulation of post-aggregation genes in Dictyostelium by a feed-forward loop involving GBF and LagC. Dev Biol. 2006;290:460–469. doi: 10.1016/j.ydbio.2005.11.035. [DOI] [PubMed] [Google Scholar]
- 21.Kibler K, Svetz J, Nguyen TL, Shaw C, Shaulsky G. A cell-adhesion pathway regulates intercellular communication during Dictyostelium development. Dev Biol. 2003;264:506–521. doi: 10.1016/j.ydbio.2003.08.025. [DOI] [PubMed] [Google Scholar]
- 22.Siu CH, Harris TJ, Wang J, Wong E. Regulation of cell-cell adhesion during Dictyostelium development. Semin Cell Dev Biol. 2004;15:633–641. doi: 10.1016/j.semcdb.2004.09.004. [DOI] [PubMed] [Google Scholar]
- 23.Sukumaran S, Brown JM, Firtel RA, McNally JG. lagC-null and gbf-null cells define key steps in the morphogenesis of Dictyostelium mounds. Dev Biol. 1998;200:16–26. doi: 10.1006/dbio.1998.8934. [DOI] [PubMed] [Google Scholar]
- 24.Wang J, Hou L, Awrey D, Loomis WF, Firtel RA, Siu CH. The membrane glycoprotein gp150 is encoded by the lagC gene and mediates cell-cell adhesion by heterophilic binding during Dictyostelium development. Dev Biol. 2000;227:734–745. doi: 10.1006/dbio.2000.9881. [DOI] [PubMed] [Google Scholar]
- 25.Eichinger L, Pachebat JA, Glockner G, Rajandream MA, Sucgang R, Berriman M, Song J, Olsen R, Szafranski K, Xu Q, Tunggal B, Kummerfeld S, Madera M, Konfortov BA, Rivero F, Bankier AT, Lehmann R, Hamlin N, Davies R, Gaudet P, Fey P, Pilcher K, Chen G, Saunders D, Sodergren E, Davis P, Kerhornou A, Nie X, Hall N, Anjard C, Hemphill L, Bason N, Farbrother P, Desany B, Just E, Morio T, Rost R, Churcher C, Cooper J, Haydock S, van Driessche N, Cronin A, Goodhead I, Muzny D, Mourier T, Pain A, Lu M, Harper D, Lindsay R, Hauser H, James K, Quiles M, Madan Babu M, Saito T, Buchrieser C, Wardroper A, Felder M, Thangavelu M, Johnson D, Knights A, Loulseged H, Mungall K, Oliver K, Price C, Quail MA, Urushihara H, Hernandez J, Rabbinowitsch E, Steffen D, Sanders M, Ma J, Kohara Y, Sharp S, Simmonds M, Spiegler S, Tivey A, Sugano S, White B, Walker D, Woodward J, Winckler T, Tanaka Y, Shaulsky G, Schleicher M, Weinstock G, Rosenthal A, Cox EC, Chisholm RL, Gibbs R, Loomis WF, Platzer M, Kay RR, Williams J, Dear PH, Noegel AA, Barrell B, Kuspa A. The genome of the social amoeba Dictyostelium discoideum. Nature. 2005;435:43–57. doi: 10.1038/nature03481. [DOI] [PMC free article] [PubMed] [Google Scholar]
- 26.Nielsen R. Molecular signatures of natural selection. Annu Rev Genet. 2005;39:197–218. doi: 10.1146/annurev.genet.39.073003.112420. [DOI] [PubMed] [Google Scholar]
- 27.Wong E, Yang C, Wang J, Fuller D, Loomis WF, Siu CH. Disruption of the gene encoding the cell adhesion molecule DdCAD-1 leads to aberrant cell sorting and cell-type proportioning during Dictyostelium development. Development. 2002;129:3839–3850. doi: 10.1242/dev.129.16.3839. [DOI] [PubMed] [Google Scholar]
- 28.Noegel A, Harloff C, Hirth P, Merkl R, Modersitzki M, Stadler J, Weinhart U, Westphal M, Gerisch G. Probing an adhesion mutant of Dictyostelium discoideum with cDNA clones and monoclonal antibodies indicates a specific defect in the contact site A glycoprotein. Embo J. 1985;4:3805–3810. doi: 10.1002/j.1460-2075.1985.tb04151.x. [DOI] [PMC free article] [PubMed] [Google Scholar]
- 29.Ponte E, Bracco E, Faix J, Bozzaro S. Detection of subtle phenotypes: the case of the cell adhesion molecule csA in Dictyostelium. Proc Natl Acad Sci U S A. 1998;95:9360–9365. doi: 10.1073/pnas.95.16.9360. [DOI] [PMC free article] [PubMed] [Google Scholar]
- 30.Queller DC, Ponte E, Bozzaro S, Strassmann JE. Single-gene greenbeard effects in the social amoeba Dictyostelium discoideum. Science. 2003;299:105–106. doi: 10.1126/science.1077742. [DOI] [PubMed] [Google Scholar]
- 31.Drummond DA, Wilke CO. Mistranslation-induced protein misfolding as a dominant constraint on coding-sequence evolution. Cell. 2008;134:341–352. doi: 10.1016/j.cell.2008.05.042. [DOI] [PMC free article] [PubMed] [Google Scholar]
- 32.Shaulsky G, Loomis WF. Cell type regulation in response to expression of ricin-A in Dictyostelium. Dev Biol. 1993;160:85–98. doi: 10.1006/dbio.1993.1288. [DOI] [PubMed] [Google Scholar]
- 33.Huang E, Blagg SL, Keller T, Katoh M, Shaulsky G, Thompson CR. bZIP transcription factor interactions regulate DIF responses in Dictyostelium. Development. 2006;133:449–458. doi: 10.1242/dev.02240. [DOI] [PMC free article] [PubMed] [Google Scholar]
- 34.Harloff C, Gerisch G, Noegel AA. Selective elimination of the contact site A protein of Dictyostelium discoideum by gene disruption. Genes Dev. 1989;3:2011–2019. doi: 10.1101/gad.3.12a.2011. [DOI] [PubMed] [Google Scholar]
- 35.Shaulsky G, Escalante R, Loomis WF. Developmental signal transduction pathways uncovered by genetic suppressors. Proc Natl Acad Sci U S A. 1996;93:15260–15265. doi: 10.1073/pnas.93.26.15260. [DOI] [PMC free article] [PubMed] [Google Scholar]
- 36.Nei M, Gojobori T. Simple methods for estimating the numbers of synonymous and nonsynonymous nucleotide substitutions. Mol Biol Evol. 1986;3:418–426. doi: 10.1093/oxfordjournals.molbev.a040410. [DOI] [PubMed] [Google Scholar]
Associated Data
This section collects any data citations, data availability statements, or supplementary materials included in this article.