

Abstract
Identification and characterization of functional elements in the noncoding regions of genomes is an elusive and time-consuming activity whose output does not keep up with the pace of genome sequencing. Hundreds of bacterial genomes lay unexploited in terms of noncoding sequence analysis, although they may conceal a wide diversity of novel RNA genes, riboswitches, or other regulatory elements. We describe a strategy that exploits the entirety of available bacterial genomes to classify all noncoding elements of a selected reference species in a single pass. This method clusters noncoding elements based on their profile of presence among species. Most noncoding RNAs (ncRNAs) display specific signatures that enable their grouping in distinct clusters, away from sequence conservation noise and other elements such as promoters. We submitted 24 ncRNA candidates from Staphylococcus aureus to experimental validation and confirmed the presence of seven novel small RNAs or riboswitches. Besides offering a powerful method for de novo ncRNA identification, the analysis of phylogenetic profiles opens a new path toward the identification of functional relationships between co-evolving coding and noncoding elements.
In all living organisms, the genome regions located between protein-coding sequences are home to a wide diversity of functional elements that include noncoding RNA (ncRNA) genes, DNA regulatory elements, untranslated regions (UTRs) of genes, transposable and self-replicating elements, and a variety of other transcribed or nontranscribed functional sequences. As these elements are often key players in gene regulation and thus in the global cell interaction network, their systematic identification and characterization has become a major challenge in biology.
Computational protocols developed to collect and characterize noncoding elements in genomic sequences rely, to a large extent, on comparative genomics. The most common strategies involve, first, collecting sequences under selective pressure and, second, analyzing the aligned sequences using various classifiers that exploit criteria such as nucleotide composition, folding potential, fold conservation, or covariation between distant positions (Rivas and Eddy 2001; Washietl et al. 2005; Pedersen et al. 2006; Torarinsson et al. 2006). In general, such classifiers are designed to detect structured RNAs among noncoding elements with no further distinction between regulatory elements, repeats, or artifacts produced by sequence comparison algorithms.
Comparative genomics entails a significant amount of expert intervention, especially in obtaining the right genome set to optimize the specificity and sensitivity of RNA detection. Although a number of studies have successfully identified ncRNAs in several animal (Missal et al. 2005; Washietl et al. 2007) and microbial genomes (Altuvia 2007), the pace at which such studies are performed and published lags far behind the rate of genome sequence output. Most of the complete genomes sequenced to date have escaped the scrutiny of RNA experts, and their potential for novel RNA functions lies unexplored. Recently, Livny et al. (2008) introduced an automated procedure, SIPHT, which combines conserved sequence detection and the presence of adjacent Rho-independent terminators. The procedure is sufficiently automated to be applied to all available bacterial genomes; however, the requirement for a terminator motif introduces a bias against the significant fraction of RNA elements that are not followed by a detectable terminator.
Nucleic acid phylogenetic profiling (NAPP) addresses both the issue of high-throughput noncoding sequence identification and that of their functional characterization. Phylogenetic profiling (Ragan and Gaasterland 1998; Pellegrini et al. 1999) posits that genes belonging to the same metabolic or regulatory pathway tend to occur concomitantly in a given set of organisms. By clustering proteins based on their occurrence profile in many species, one therefore obtains clusters of functionally related proteins, which enables functional assignments to uncharacterized sequences. While this principle has been successfully applied to protein annotation (Pellegrini et al. 1999; Enault et al. 2003; Srinivasan et al. 2005), to date, no application to ncRNA annotation has emerged. An obstacle to building nucleic acid profiles over a large evolutionary time frame is certainly the lower sensitivity of DNA sequence similarity searches compared to searches at the amino acid sequence level. However, in spite of this limitation, Janky and van Helden (2008) were able to obtain clear phylogenetic profiles for promoter DNA elements, by focusing their analysis on upstream sequences of orthologous genes. In this study, we apply phylogenetic profiling for the first time to the complete noncoding DNA in bacterial genomes, with the objective of classifying all conserved noncoding elements in a single computing process.
Results
Collecting noncoding conserved elements
To collect loosely conserved noncoding elements in a selected reference genome, we performed a BLAST search of all noncoding regions against a set of 422 complete bacterial genomes and obtained a conservation index for each intergenic position. Note that “intergenic” here also comprises gene UTRs. The conservation index represents the number of genomes in which a BLAST hit was recorded at this position, weighted by the phylogenetic proximity of each genome with the reference genome (see Methods). For each noncoding region, we produced a conservation histogram (Fig. 1), and extracted all conserved noncoding elements (CNEs) using empirical conservation index cutoffs, fragment sizes, and minimal distances between conserved fragments. An overview of the resulting CNEs in Escherichia coli and Bacillus subtilis is presented in Table 1. At the selected cutoffs, CNEs detected 76%–87% of all known ncRNAs in these two species. Examples of CNEs (Fig. 1) map to known noncoding elements, including small RNAs (Fig. 1A,B,D,E,G), a riboswitch (Fig. 1H), RNase P RNA genes (Fig. 1C,F) and the CRISPR locus (Fig. 1I). While CNEs do not strictly map the boundaries of RNA genes or elements, they generally overlap functional, and hence the most conserved regions, such as target- or substrate-binding regions in small RNAs (sRNAs) and riboswitches (black areas in Fig. 1A–E). In the CRISPR loci, each repeat is accurately represented by an independent CNE (Fig. 1I). The vast majority of CNEs, however, do not map any known ncRNA (3427 in E. coli and 2653 in B. subtilis). It is the classification of these heterogeneous elements that we will now address using phylogenetic profiling.
Figure 1.

Conservation profiles in selected bacterial noncoding regions. The vertical axis represents the conservation index (CI) and the horizontal axis represents genome coordinates in relative numbering. The CI threshold used for defining conserved noncoding elements (CNEs) is represented by a horizontal line at CI = 0.004. CNEs are denoted by shaded areas. Color code for RNA elements: RNA genes are gray with black areas representing known target-binding regions, CRISPR spacers are gray and CRISPR repeats are light gray. Transcription initiation sites are shown with broken arrows and terminators with hairpins. (A,B,D,E,G) E. coli regulatory sRNA genes; (H) E. coli TPP riboswitch; (C) E. coli RNase P RNA gene; (F) B. subtilis RNase P RNA gene; and (I) E. coli CRISPR locus.
Table 1.
CNE statistics

Phylogenetic profiling efficiently clusters ncRNAs
In order to obtain the phylogenetic profiles of CNEs in the reference species, we locally realigned each CNE against 422 complete bacterial genomes and retained the best hit in each genome in the form of a size-normalized BLAST score (Enault et al. 2003). As we were interested in comparing the profiles of noncoding elements to those of coding elements, we also generated profiles for each coding DNA sequence (CDS) in the reference genome using the same procedure. Each CNE/CDS was thus attributed a vector of 422 values between 0 and 1 (0: no hit; 1: perfect match). We computed a distance matrix by measuring Pearson's distances between all pairs of vectors and used this matrix for K-means clustering. To assess clustering quality, we computed the enrichment of clusters for known ncRNAs (excluding tRNA and rRNA), promoters, terminators, and transcription factor binding sites. Figure 2 presents a two-dimensional representation of K-means clusters of all nucleic acids elements in E. coli and B. subtilis, showing cluster enrichment in known ncRNAs. Enrichments in other functional elements are shown in Supplemental Figure S1 for E. coli. While some clusters are mildly enriched in promoters and terminators (P ∼ 10−3; Supplemental Fig. S1), enrichment in ncRNA is extremely significant: between 54% and 79% of all known ncRNAs are grouped into only two clusters in both E. coli and B. subtilis (P = 10−4 to 10−15; Fig 2).
Figure 2.

K-means clustering of CNEs and CDSs in (A) E. coli and (B) B. subtilis. A rectangle represents a cluster of CNEs/CDSs, and its size is proportional to the number of CNEs in the cluster. Numbers in each rectangle represent numbers of protein coding genes, CNEs and known ncRNA in this cluster, respectively. The color scale represents the enrichment/depletion of known ncRNA in each cluster. For ncRNA-rich clusters, the enrichment P-value is shown in the center of the rectangle. ncRNA enrichment measures do not include tRNA or rRNA.
Inclusion of protein-coding genes in profiles improves cluster quality with respect to ncRNA enrichment. When CNEs are clustered alone, the best ncRNA enrichment obtained in E. coli is not as significant as when protein-coding genes are present (P = 2 × 10⁻⁷; Supplemental Fig. S2). Moreover, the efficient ncRNA clustering is not caused by the higher conservation or longer size of ncRNAs compared to other elements. When performing K-means clustering of CNEs based on their size (Supplemental Fig. S3) or conservation level (Supplemental Fig. S4), the highest ncRNA enrichment observed are P = 4 × 10⁻³ and P = 10−2, respectively. This shows that information contained in a nucleic acid phylogenetic profile is significantly richer than size or conservation alone.
Performance of NAPP as an ncRNA classifier
NAPP is as efficient in bacterial ncRNA identification as specialized programs. We compared NAPP to RNAz (Washietl et al. 2005) and SIPHT (Livny et al. 2008). RNAz classifies multiple sequence alignments into ncRNA/non-ncRNA based on the detection of significant conserved secondary structure and base pair (bp) covariation. It has been applied to several organism families, including bacteria, where it led to experimental confirmation of novel ncRNAs (del Val et al. 2007; Panek et al. 2008; Sonnleitner et al. 2008). We compared NAPP clustering and RNAz in their abilities to distinguish true ncRNAs from other conserved elements. RNAz recommends input alignments containing at least four sequences with a minimal size of 50 nucleotides (nt) and less than 25% gaps. After realigning all E. coli CNEs against their best hits in other genomes, we obtained 512 alignments meeting these criteria, of which 23 correspond to known ncRNAs. Figure 3A compares predictions of NAPP (pink) and RNAz (blue) in four bacterial species. Both methods identify nearly the same fraction of known ncRNAs (yellow). NAPP appears more specific, as it produces fewer predictions in general. However, as complete sets of ncRNAs are unknown in either species, the larger RNAz prediction sets do not necessarily correspond to false positives. Figure 3B compares NAPP to SIPHT, an ncRNA detection procedure based on intergenic sequence conservation and the presence of transcription terminators (Livny et al. 2008). When tested on the four organisms, the two programs show similar performances in terms of sensitivity and apparent specificity. These results show that NAPP clustering of ncRNAs compares favorably with two recent, specialized ncRNA prediction systems. Known ncRNas predicted by the three methods present little overlap (Supplemental Table S1). Indeed, each program uses completely different criteria to classify conserved noncoding elements. As NAPP predictions are independent of conserved secondary structures (used in RNAz) and presence of a terminators (used in SIPHT), they are likely to contain a large fraction of ncRNA genes or elements that escaped previous scrutiny.
Figure 3.

Comparison of NAPP ncRNA predictions with RNAz and SIPHT predictions in four bacterial genomes. Numbers in Venn diagram areas represent the area exclusive of included subareas. Blue: ncRNA predictions from RNAz or SIPHT; pink: ncRNA predictions from the NAPP program; and yellow: known ncRNAs present in the tested set (excluding tRNA, rRNA). (A) Predictions from the RNAz program. White areas represent total numbers of candidate sequences that can be tested with RNAz. (B) Prediction from the SIPHT program. Both SIPHT and NAPP screen all conserved intergenic elements.
ncRNAs display distinctive phylogenetic signatures
Sequence comparisons are less sensitive when performed on nucleic acids than when performed on proteins and, consequently, whereas protein phylogenetic profiles often span hundreds of bacterial species, nucleic acids profiles span a much shorter evolutionary distance. In spite of this limitation, however, a large fraction of the nucleic acid profiles have very distinctive features when examined on shorter timescales. Figure 4 and Supplemental Figure S6 present a sample of K-means clusters represented as heat-maps. A histogram representing the average phylogenetic profile is superimposed onto each cluster (histograms for the full set of 35 K-means clusters are shown in Supplemental Fig. S7).
Figure 4.

Heat-map representations of NAPP clusters in E. coli K12. Each panel shows a representative part of a K-means cluster from Figure 2A. Each K-means cluster was reclassified by hierarchical clustering and displayed as a heat-map using Eisen software (Eisen et al. 1998). The horizontal axis represents the 423 bacterial species ordered according to a 16S rRNA tree. The right vertical axis represents CNEs or CDSs. A red dot indicates the presence of a given CNE/CDS in this species with color intensity proportional to normalized BLAST scores. The histogram superimposed on each cluster represents the average phylogenetic profile for this cluster (AFP, left vertical axis) obtained by averaging dot intensities in columns. (A) ncRNA-rich cluster #1 from Figure 2A; (B) ncRNA-rich cluster #2 from Figure 2A; (C) a promoter-rich cluster; (D) a cluster with no apparent functional enrichment; (E) the main tRNA cluster; and (F) a cluster containing mostly tRNAs and ribosomal RNAs.
Most NAPP clusters that are not functionally enriched have a narrow signature and a significant background noise visible in the form of red “dust” (e.g., see Fig. 4D). This dust occurs across the taxonomic spectrum, and likely corresponds to nonsignificant similarities. In this respect, profile clustering is an efficient means to condense the bulk of nonsignificant similarities usually produced by comparative genomics protocols into “garbage clusters” that can be singled out. Garbage clusters comprise the majority of CNEs and few CDSs. Most CDSs cluster in distinct groups that contain few CNEs and display relatively narrow signatures. The narrow signature of CDSs may be surprising at first sight because proteins are often conserved across a wide phylogenetic spectrum; however, as we consider here size-normalized DNA-level conservation, we did not expect protein-coding genes to be more conserved than any other functional DNA sequence. Indeed, conservation analysis in E. coli previously showed that sRNA genes and protein-encoding genes display similar degrees of conservation at the nucleotide level (Zhang et al. 2004). On the other end of the conservation spectrum, sequences with the broadest phylogenetic signature are tRNAs and rRNAs (Fig. 4E,F). In E. coli, most tRNAs are grouped into a single cluster (Fig. 4E) and most 5S, 16S, and 23S rRNAs are grouped into a second cluster together with ribosomal spacers, a few remaining tRNAs and some ribosomal protein genes (Fig. 4F). A similar pattern of tRNA and rRNA clustering is observed in other species (not shown).
The ncRNA-rich clusters (excluding tRNA and rRNA) often have intermediate signatures with a species distribution between that of rRNA and that of most coding sequences. One of the E. coli ncRNA-rich clusters contains elements present primarily in the Salmonella and Escherichia families (Fig. 4A), while the other cluster has a slightly broader signature extending to Yersinia (Fig. 4B). Most sequences in these two clusters have low-scoring putative homologs in more distant species such as Pseudomonas and Haemophilus, and have no visible homolog outside γ-proteobacteria. Not all ncRNA-rich clusters, however, have such signatures. In E. coli, one subcluster contains nine ncRNAs among a total of 21 CNEs, but nevertheless has a very narrow species distribution (Supplemental Fig. S6C). Similar distributions were seen for two ncRNA-rich clusters in B. subtilis and Vibrio cholerae (Supplemental Fig. S6A,E).
Functional analysis of clustered RNAs and CDSs
Noncoding RNA clusters contain both universal or kingdom-wide RNAs and the bulk of phylum-specific ncRNAs. For instance, ncRNA clusters #1 and #2 in E. coli (Fig. 4A,B; Supplemental Table S2) contain enterobacterial RNAs, such as sroB, csrB, csrC, and sraB, together with universal RNAs such as RNase P, SRP RNA, and tmRNA, as well as TPP and cobalamin riboswitches that are present in all bacteria (Barrick and Breaker 2007). We observe the same pattern in other species (Supplemental Table S2). Therefore, the width of phylogenetic signatures is not a direct function of the age of an RNA family. Ancient RNAs that were present at the root of bacterial evolution may exhibit a variety of phylogenetic signatures ranging from relatively narrow (RNase P, SRP RNA, tmRNA) to medium (rRNA) or extremely wide (tRNA). This diversity of profiles reflects large differences in the evolutionary rates of different RNA families.
As expected from the distribution of known RNAs in bacteria, we observed mostly cis-regulatory elements, such as riboswitches and leader sequences in Gram positive bacteria, and mostly small RNAs in Gram negative bacteria. In E. coli, where annotated ncRNA include both sRNA genes and cis-regulatory RNA elements, we observed instances of both classes in all RNA clusters. Numbers of known ncRNAs are currently too low to evaluate clustering by more specific functional criteria, such as the involvement of a ncRNA in a type of metabolism. However, the mixture of universal ncRNAs and species-specific regulatory ncRNAs in the same clusters suggests that the primary driving force in ncRNA clustering is neither biological nor molecular function, but instead relates to the evolutionary rate of each of the RNAs in different species.
Supplemental Table S3 lists known E. coli RNAs that were missed by the NAPP procedure. Eighteen known RNAs fell below our conservation threshold and therefore were not fed into the phylogenetic profile screens. Another 16 RNAs are distributed among various NAPP clusters. This list includes a single ancient RNA (6S) and a larger fraction of RNAs with unknown function than ncRNA-rich clusters (50% vs. 32%), suggesting that missed ncRNAs may be generally less reliable than predicted ncRNAs. Supporting this, four of the 16 missed RNAs (t44, c0343, c0465, is102) were detected in a single DNA microarray study (Tjaden et al. 2002).
We analyzed functional biases in the CDSs present in ncRNA clusters using KEGG-term enrichment (Kanehisa et al. 2002). In all species studied, at least one ncRNA cluster was enriched in major housekeeping functions such as “ribosome,” “RNA polymerase,” or “phosphorylative oxidation” (Supplemental Table S4). When comparing ncRNA clusters from distant species (E. coli and B. subtilis), we observed significant numbers of orthologous proteins in the “housekeeping” clusters (P = 1.8 × 10⁻² to 1.5 × 10⁻¹¹; Supplemental Fig. S5). This suggests that a similar set of housekeeping proteins is consistently associated with ncRNAs in different species. These clusters generally had wider phylogenetic signatures (Supplemental Fig. S6B,D; Supplemental Table S4) than other ncRNA clusters. Other ncRNA clusters do not present KEGG-term enrichment or are enriched for other functions, and are associated with narrower signatures. For example, ncRNA-rich cluster #2 in V. cholerae is enriched in KEGG-term “chemotaxis” (Supplemental Fig S6E; Supplemental Table S4).
RNA-rich clusters in E. coli contain a high proportion of CDSs coding for RNA-related proteins and Hfq-bound mRNAs (Supplemental Table S5). A first striking observation is that many of the encoded proteins either (1) regulate sRNA expression (e.g., RpoE, YobF, CsrA), (2) are regulated by ncRNA (e.g., OmpR), (3) are part of ribonucleoprotein complexes (e.g., RnpA, ribosomal proteins), or (4) bind RNA (e.g., CspA). Overall, 64% of the ORFs in the two major ncRNA clusters in E. coli are RNA related. Interestingly, the Hfq protein, a central player in RNA-based regulations in many bacterial species, is present in ncRNA-rich clusters in all four species analyzed. In a recent study, Sittka et al. (2008) sequenced 727 mRNAs that co-immunoprecipitated with Hfq in Salmonella. These mRNAs are thought to involve a majority of ncRNA targets that recruit Hfq through the ncRNA intermediate. We searched for E. coli orthologs of these potential Hfq targets and found 601 CDSs. Although these Hfq-related CDSs represent only 18% of total E. coli CDSs, they represent almost half of the CDSs in ncRNA clusters #1 and #2 (respectively, 45/99 CDSs and 15/33 CDSs; P = 5.6 × 10⁻⁶ and 7.4 × 10⁻³). There is thus a significant bias toward the presence of Hfq-bound mRNAs in the ncRNA-rich clusters of E. coli.
Experimental validation of candidate ncRNAs
We chose the Gram positive bacterium Staphylococcus aureus to challenge the NAPP method. S. aureus is a human commensal and an opportunistic pathogen that is widely responsible for nosocomial infections. Using NAPP to identify novel ncRNAs could have medical relevance, especially as only few ncRNAs were experimentally confirmed in this species (Pichon and Felden 2005). NAPP performed on strain N315 discerned 189 new ncRNA candidates in the ncRNA-rich clusters (Supplemental Table S6). We selected those that were positioned at more than 60 bp from a coding sequence, in order to avoid probing proximal elements in 5′ UTRs. Of the 48 sequences meeting this criterion, we randomly selected 24 for validation. To test for their presence, S. aureus was grown in rich media at 37°C. As ncRNAs are often expressed in specific growth conditions, total RNAs were extracted from samples collected at different growth phases. Northern blot experiments were performed using strand-specific-labeled oligonucleotides designed to probe the CNEs on each strand. Among the 24 CNEs tested, seven yield signals between 100 and 300 nt, showing the presence of corresponding small RNAs (named rsaOA to rsaOG; Fig. 5). Some of the labeled probes yield additional high molecular weight signals. Sequence analysis suggests that SA0347 (metB) is regulated by a T-box riboswitch and SA0667 (queC) by a preQ1 type riboswitch (Griffiths-Jones et al. 2005; Roth et al. 2007). Therefore, rsaOB and rsaOC are short transcripts likely resulting from premature transcription arrests of putatively longer transcripts that are also observed. Although these experiments suggest that nearly one-third of the ncRNAs predicted by NAPP may actually be produced by S. aureus, this proportion is likely underestimated, since we only assessed a limited set of conditions. For example, different stress conditions might induce expression of other, as yet undetected ncRNAs. This experimental approach demonstrates the efficiency of NAPP for the discovery of new small RNAs in bacteria.
Figure 5.

Identification of seven new S. aureus small RNAs. (A) Northern blot experiments showing the expression of NAPP-predicted small RNAs of N315 S. aureus in nutrient-rich medium. Total RNAs were prepared from cultures in exponential, early stationary, and late stationary phases. Black wedges indicate the increased OD600: 0.2, 0.4, 0.8, 2, 3.5, 6, and 10 from left to right. Marker sizes are shown to the left of each blot. RNAs were detected using 32P-labeled oligonucleotides designed to pair with the CNEs (cf. Supplemental Table S7). The name that we gave to each small RNA (rsaOA to rsaOG) is indicated. As the genome contains intergenic sequences similar to rsaOF, the RsaOF probe could hybridize to RNAs expressed from regions other than that indicated. 5S RNA was used as a control. (B) Genes flanking detected small RNAs. Arrows indicate the direction of transcription. Plain arrows correspond to small RNAs. Empty arrows correspond to open reading frames. Transcription terminators were predicted using Erpin (Gautheret and Lambert 2001) and RNAMotif (Macke et al. 2001).
Discussion
The assumption underlying phylogenetic profiling is that genes involved in a particular complex or pathway should co-occur in different species. As co-occurrence events are particularly significant when involving distant species (Cokus et al. 2007), and considering the rapid evolution of nucleic acid sequences, the application of phylogenetic profiling to the classification of nucleic acids was an uncertain endeavor. We provide here the first evidence that nucleic acid profiling performed on the full genome scale is functionally informative. Phylogenetic profiling efficiently clusters tRNAs, rRNAs, and other ncRNAs in several distinct groups, and concentrates a significant number of housekeeping and RNA-regulated (Hfq-bound) protein-coding genes in the ncRNA clusters. This approach opens fascinating perspectives for the analysis of RNA genes and RNA–protein interactions, and at the same time raises new questions as to why some sets of RNAs and CDSs should exhibit similar evolutionary profiles.
NAPP represents sequence constraints as a multidimensional value corresponding to conservation levels observed in multiple species. We propose that this vector representation depicts RNA evolution far more accurately than a one-dimensional value. Constraints on RNA sequences are subject to environmental and biological factors and can thus vary widely across species. The effectiveness of NAPP clustering shows that, in spite of these species-dependent evolutionary rates, sets of RNAs from the same genome display similar interspecies variations of conservation levels. In other words, we can witness constraints on RNA sequences that vary across the phylogenetic spectrum, but vary similarly from one RNA gene to another.
Exploiting these common evolutionary patterns, NAPP efficiently classifies bacterial RNAs in distinct clusters with no a priori knowledge of these molecules. A more precise functional classification that would distinguish ncRNAs involved, for instance, in iron homeostasis or other specific cellular functions will be harder to achieve. However, NAPP in its current form is already an efficient strategy for de novo ncRNA identification. Unlike other ncRNA prediction programs, NAPP neither requires similarities to existing gene families, nor involves analysis of sequence composition, RNA structure or covariation. It is remarkable that a clustering procedure that ignores these characteristics can perform similarly or better than dedicated RNA identification software. This approach thus opens a new path toward the identification of ncRNAs that escaped established screening methods.
Growth of the complete genome collection will result in denser sampling of species around genomes of interest, and hence to more informative phylogenetic profiles. As NAPP computing costs increase only linearly with the number of species, we should be able to fully exploit the rapidly expanding genome collection. Among possible outcomes of future functional analyses, we expect to gain insight into novel noncoding elements involved in specific adaptive responses, as well as in a large number of novel RNA–RNA and RNA–protein interactions.
Methods
Selection of conserved noncoding elements (CNEs)
We retrieved the 423 complete reference sequence (RefSeq) genomes from the NCBI genome database (Pruitt et al. 2007) as of February 2007. We extracted noncoding regions of the reference genome based on NCBI's coding sequence annotations and aligned these to the 422 remaining complete genome sequences using Washington University's WU-BLAST (parameters: −p BLASTN −W 5 −e 0.01). We computed the conservation rate of each intergenic position as the number of genomes in which this position was involved in a BLASTN hit. To reduce the impact of near-identical genomes in the collection, we weighted the conservation rates using interspecies phylogenetic distances derived from 16S rRNA. We obtained the 16S rRNA sequences from the RDP website (Cole et al. 2005), performed multiple alignments of the sequences with MUSCLE (Edgar 2004), and computed the distance matrix using DNAdist from the PHYLIP V3.6 package (Felsenstein 1989). The final conservation index (CI) for any intergenic position of the reference species Sr is computed as follows:
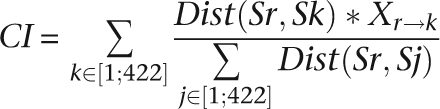 |
With Dist(Sr,Sk) the distance between the 16S rRNAs of species Sr and Sk, and X a Boolean representing the presence or absence of a nucleotide from species Sr in the local alignment with species Sk. The denominator is the sum of all distances between the 16S rRNA of Sr and the 16S rRNAs of other species Sj. We defined CNEs as segments with a CI greater than 0.004 over a minimal length of 15 nt. We merged consecutive CNEs separated by 35 nt or less. These parameters were determined empirically based on the observation of known ncRNAs in the E. coli and B. subtilis genomes.
Phylogenetic profiles and profile clustering
CNEs and protein-coding genes (CDSs from start to stop codon) were submitted to the same procedure. We aligned each CNE/CDS from a reference organism against the 422 remaining complete genomes using WU-BLAST (parameters: −p BLASTN −W 5 −e 0.01). The highest bit score obtained against each genome was normalized by the BLASTN score of the CNE/CDS sequence against itself. The phylogenetic profile of a CNE/CDS corresponds to this vector of 422 normalized scores. To clusterize profiles by similarity, we used the K-means procedure from the R package (Ihaka and Gentleman 1996) using Pearson distance and k = 35 clusters. We reached the number of 35 clusters by gradually increasing the cluster number until empty groups began to appear. Because of the stochastic component in K-means, each K-means run generates a different clustering. We performed multiple K-means runs for each species studied and observed no significant variation in cluster quality with respect to ncRNA contents. Known ncRNAs were always grouped into one or two clusters with highly significant enrichments. Detailed contents of ncRNA-enriched clusters for an expanding list of species are available for download at http://rna.igmors.u-psud.fr/download.
Functional enrichment
We obtained the coordinates of noncoding RNAs from the RFAM 8.0 database (Griffiths-Jones et al. 2005) and the coordinates of E. coli terminators, promoters, and transcription factor binding sites (TFBS) from RegulonDB 6.1 (Gama-Castro et al. 2008). We classified a CNE as a known ncRNA, terminator, or TFBS when it overlapped the corresponding element. On average, Rfam sequences covered 84% of the CNE length in E. coli and B. subtilis. Functional terms for E. coli and B. subtilis proteins were obtained from the KEGG database, January 2008 version (Kanehisa et al. 2002). We disregarded KEGG pathways that did not present sufficient functional relationships among their members, as suggested by Snitkin et al. (2006). For enrichment in Hfq-bound mRNAs, we extracted the list of 727 Hfq-associated mRNAs in Salmonella typhimurium from Sitka et al. (2008) and obtained E. coli orthologs from the COG database (Tatusov et al. 2003). To measure the enrichment of cluster C in property P, we used a two-sided Fisher test (P-value < 10−2), comparing the number of elements with property P in cluster C, the number of elements with property P in all clusters, and the total numbers of elements in cluster C and in all clusters.
Comparison with RNAz and SIPHT
Multiple alignments were generated for RNAz analysis as follows. For each CNE over 50 nt, we collected the best WU-BLAST hits (parameters: −p BLASTN −W 5 −e 0.01) in each of the 422 species. We discarded hits shorter than 75% of the query size and performed multiple alignments of the CNE and BLASTN hits using Muscle (Edgar 2004). Multiple alignments containing four or more distinct sequences were submitted to RNAz (512 alignments for E. coli, 653 for B. subtilis, 653 for S. aureus, and 456 for V. cholerae). Overall, only 10%–15% of CNEs produced a multiple alignment of sufficient quality for RNAz analysis. RNAz was run with default options (any alignment <50% identity is discarded). When a positive ncRNA prediction was scored by RNAz in one of the scanning windows, we tagged the whole alignment as ncRNA. Predictions of the SIPHT program were obtained directly from the authors' web server: http://bio.cs.wisc.edu/sRNA.
Experimental validation
We used N315, a methicillin resistant S. aureus strain that caused hospital-acquired infections in 1982 and was fully sequenced (Kuroda et al. 2001). Overnight staphylococcal cultures in BHI medium were diluted 1000-fold in the same medium and grown at 37°C. Total RNAs were extracted at the indicated optical density as previously described (Oh and So 2003; Bohn et al. 2007). Northern blot experiments were performed on samples separated by denaturing polyacrylamide gel electrophoresis. RNAs were transferred to nylon membranes using a semidry electrophoretic transfer unit. Oligonucleotide probes (see Supplemental Table S7) were γ32-dCTP labeled using the T4 polynucleotide kinase according to manufacturer's instructions (Fermentas). Hybridizations were performed overnight at 52°C. Radioactivity was detected using phosphor screen imaging system (Typhoon, GE-Healthcare).
Acknowledgments
This work was supported in part by the Institut Fédératif de Recherche 115 (IFR 115) and by grant ANR-06-MIME-016-01 from Agence Nationale pour la Recherche.
Footnotes
[Supplemental material is available online at www.genome.org.]
Article published online before print. Article and publication date are at http://www.genome.org/cgi/doi/10.1101/gr.089714.108.
References
- Altuvia S. Identification of bacterial small noncoding RNAs: Experimental approaches. Curr. Opin. Microbiol. 2007;10:257–261. doi: 10.1016/j.mib.2007.05.003. [DOI] [PubMed] [Google Scholar]
- Barrick J.E., Breaker R.R. The distributions, mechanisms, and structures of metabolite-binding riboswitches. Genome Biol. 2007;8:R239. doi: 10.1186/gb-2007-8-11-r239. [DOI] [PMC free article] [PubMed] [Google Scholar]
- Bohn C., Rigoulay C., Bouloc P. No detectable effect of RNA-binding protein Hfq absence in Staphylococcus aureus. BMC Microbiol. 2007;7:10. doi: 10.1186/1471-2180-7-10. [DOI] [PMC free article] [PubMed] [Google Scholar]
- Cokus S., Mizutani S., Pellegrini M. An improved method for identifying functionally linked proteins using phylogenetic profiles. BMC Bioinformatics. 2007;8(Suppl. 4):S7. doi: 10.1186/1471-2105-8-S4-S7. [DOI] [PMC free article] [PubMed] [Google Scholar]
- Cole J.R., Chai B., Farris R.J., Wang Q., Kulam S.A., McGarrell D.M., Garrity G.M., Tiedje J.M. The Ribosomal Database Project (RDP-II): Sequences and tools for high-throughput rRNA analysis. Nucleic Acids Res. 2005;33:D294–D296. doi: 10.1093/nar/gki038. [DOI] [PMC free article] [PubMed] [Google Scholar]
- del Val C., Rivas E., Torres-Quesada O., Toro N., Jimenez-Zurdo J.I. Identification of differentially expressed small non-coding RNAs in the legume endosymbiont Sinorhizobium meliloti by comparative genomics. Mol. Microbiol. 2007;66:1080–1091. doi: 10.1111/j.1365-2958.2007.05978.x. [DOI] [PMC free article] [PubMed] [Google Scholar]
- Edgar R.C. MUSCLE: Multiple sequence alignment with high accuracy and high throughput. Nucleic Acids Res. 2004;32:1792–1797. doi: 10.1093/nar/gkh340. [DOI] [PMC free article] [PubMed] [Google Scholar]
- Eisen M.B., Spellman P.T., Brown P.O., Botstein D. Cluster analysis and display of genome-wide expression patterns. Proc. Natl. Acad. Sci. 1998;95:14863–14868. doi: 10.1073/pnas.95.25.14863. [DOI] [PMC free article] [PubMed] [Google Scholar]
- Enault F., Suhre K., Abergel C., Poirot O., Claverie J.M. Annotation of bacterial genomes using improved phylogenomic profiles. Bioinformatics. 2003;19(Suppl. 1):i105–i107. doi: 10.1093/bioinformatics/btg1013. [DOI] [PubMed] [Google Scholar]
- Felsenstein J. PHYLIP—Phylogeny Inference Package (Version 3.2) Cladistics. 1989;5:164–166. [Google Scholar]
- Gama-Castro S., Jimenez-Jacinto V., Peralta-Gil M., Santos-Zavaleta A., Penaloza-Spinola M.I., Contreras-Moreira B., Segura-Salazar J., Muniz-Rascado L., Martinez-Flores I., Salgado H., et al. RegulonDB (version 6.0): Gene regulation model of Escherichia coli K-12 beyond transcription, active (experimental) annotated promoters and Textpresso navigation. Nucleic Acids Res. 2008;36:D120–D124. doi: 10.1093/nar/gkm994. [DOI] [PMC free article] [PubMed] [Google Scholar]
- Gautheret D., Lambert A. Direct RNA motif definition and identification from multiple sequence alignments using secondary structure profiles. J. Mol. Biol. 2001;313:1003–1011. doi: 10.1006/jmbi.2001.5102. [DOI] [PubMed] [Google Scholar]
- Griffiths-Jones S., Moxon S., Marshall M., Khanna A., Eddy S.R., Bateman A. Rfam: Annotating noncoding RNAs in complete genomes. Nucleic Acids Res. 2005;33:D121–D124. doi: 10.1093/nar/gki081. [DOI] [PMC free article] [PubMed] [Google Scholar]
- Ihaka R., Gentleman R. R: A language for data analysis and graphics. J. Comput. Graph. Statist. 1996;5:299–314. [Google Scholar]
- Janky R., van Helden J. Evaluation of phylogenetic footprint discovery for predicting bacterial cis-regulatory elements and revealing their evolution. BMC Bioinformatics. 2008;9:37. doi: 10.1186/1471-2105-9-37. [DOI] [PMC free article] [PubMed] [Google Scholar]
- Kanehisa M., Goto S., Kawashima S., Nakaya A. The KEGG databases at GenomeNet. Nucleic Acids Res. 2002;30:42–46. doi: 10.1093/nar/30.1.42. [DOI] [PMC free article] [PubMed] [Google Scholar]
- Kuroda M., Ohta T., Uchiyama I., Baba T., Yuzawa H., Kobayashi I., Cui L., Oguchi A., Aoki K., Nagai Y., et al. Whole genome sequencing of methicillin-resistant Staphylococcus aureus. Lancet. 2001;357:1225–1240. doi: 10.1016/s0140-6736(00)04403-2. [DOI] [PubMed] [Google Scholar]
- Livny J., Teonadi H., Livny M., Waldor M.K. High-throughput, kingdom-wide prediction and annotation of bacterial noncoding RNAs. PLoS One. 2008;3:e3197. doi: 10.1371/journal.pone.0003197. [DOI] [PMC free article] [PubMed] [Google Scholar]
- Macke T.J., Ecker D.J., Gutell R.R., Gautheret D., Case D.A., Sampath R. RNAMotif, an RNA secondary structure definition and search algorithm. Nucleic Acids Res. 2001;29:4724–4735. doi: 10.1093/nar/29.22.4724. [DOI] [PMC free article] [PubMed] [Google Scholar]
- Missal K., Rose D., Stadler P.F. Noncoding RNAs in Ciona intestinalis. Bioinformatics. 2005;21(Suppl. 2):ii77–ii78. doi: 10.1093/bioinformatics/bti1113. [DOI] [PubMed] [Google Scholar]
- Oh E.T., So J.-S. A rapid method for RNA preparation from Gram-positive bacteria. J. Microbiol. Methods. 2003;52:395–398. doi: 10.1016/s0167-7012(02)00218-x. [DOI] [PubMed] [Google Scholar]
- Panek J., Bobek J., Mikulik K., Basler M., Vohradsky J. Biocomputational prediction of small noncoding RNAs in Streptomyces. BMC Genomics. 2008;9:217. doi: 10.1186/1471-2164-9-217. [DOI] [PMC free article] [PubMed] [Google Scholar]
- Pedersen J.S., Bejerano G., Siepel A., Rosenbloom K., Lindblad-Toh K., Lander E.S., Kent J., Miller W., Haussler D. Identification and classification of conserved RNA secondary structures in the human genome. PLoS Comput. Biol. 2006;2:e33. doi: 10.1371/journal.pcbi.0020033. [DOI] [PMC free article] [PubMed] [Google Scholar]
- Pellegrini M., Marcotte E.M., Thompson M.J., Eisenberg D., Yeates T.O. Assigning protein functions by comparative genome analysis: Protein phylogenetic profiles. Proc. Natl. Acad. Sci. 1999;96:4285–4288. doi: 10.1073/pnas.96.8.4285. [DOI] [PMC free article] [PubMed] [Google Scholar]
- Pichon C., Felden B. Small RNA genes expressed from Staphylococcus aureus genomic and pathogenicity islands with specific expression among pathogenic strains. Proc. Natl. Acad. Sci. 2005;102:14249–14254. doi: 10.1073/pnas.0503838102. [DOI] [PMC free article] [PubMed] [Google Scholar]
- Pruitt K.D., Tatusova T., Maglott D.R. NCBI reference sequences (RefSeq): A curated non-redundant sequence database of genomes, transcripts and proteins. Nucleic Acids Res. 2007;35:D61–D65. doi: 10.1093/nar/gkl842. [DOI] [PMC free article] [PubMed] [Google Scholar]
- Ragan M.A., Gaasterland T. Microbial genescapes: A prokaryotic view of the yeast genome. Microb. Comp. Genomics. 1998;3:219–235. doi: 10.1089/omi.1.1998.3.219. [DOI] [PubMed] [Google Scholar]
- Rivas E., Eddy S.R. Noncoding RNA gene detection using comparative sequence analysis. BMC Bioinformatics. 2001;2:8. doi: 10.1186/1471-2105-2-8. [DOI] [PMC free article] [PubMed] [Google Scholar]
- Roth A., Winkler W.C., Regulski E.E., Lee B.W.K., Lim J., Jona I., Barrick J.E., Ritwik A., Kim J.N., Welz R., et al. A riboswitch selective for the queuosine precursor preQ1 contains an unusually small aptamer domain. Nat. Struct. Mol. Biol. 2007;14:308–317. doi: 10.1038/nsmb1224. [DOI] [PubMed] [Google Scholar]
- Sittka A., Lucchini S., Papenfort K., Sharma C.M., Rolle K., Binnewies T.T., Hinton J.C.D., Vogel J. Deep sequencing analysis of small noncoding RNA and mRNA targets of the global post-transcriptional regulator, Hfq. PLoS Genet. 2008;4:e1000163. doi: 10.1371/journal.pgen.1000163. [DOI] [PMC free article] [PubMed] [Google Scholar]
- Snitkin E.S., Gustafson A.M., Mellor J., Wu J., DeLisi C. Comparative assessment of performance and genome dependence among phylogenetic profiling methods. BMC Bioinformatics. 2006;7:420. doi: 10.1186/1471-2105-7-420. [DOI] [PMC free article] [PubMed] [Google Scholar]
- Sonnleitner E., Sorger-Domenigg T., Madej M.J., Findeiss S., Hackermuller J., Huttenhofer A., Stadler P.F., Blasi U., Moll I. Detection of small RNAs in Pseudomonas aeruginosa by RNomics and structure-based bioinformatic tools. Microbiology. 2008;154:3175–3187. doi: 10.1099/mic.0.2008/019703-0. [DOI] [PubMed] [Google Scholar]
- Srinivasan B.S., Caberoy N.B., Suen G., Taylor R.G., Shah R., Tengra F., Goldman B.S., Garza A.G., Welch R.D. Functional genome annotation through phylogenomic mapping. Nat. Biotechnol. 2005;23:691–698. doi: 10.1038/nbt1098. [DOI] [PubMed] [Google Scholar]
- Tatusov R.L., Fedorova N.D., Jackson J.D., Jacobs A.R., Kiryutin B., Koonin E.V., Krylov D.M., Mazumder R., Mekhedov S.L., Nikolskaya A.N., et al. The COG database: An updated version includes eukaryotes. BMC Bioinformatics. 2003;4:41. doi: 10.1186/1471-2105-4-41. [DOI] [PMC free article] [PubMed] [Google Scholar]
- Tjaden B., Saxena R.M., Stolyar S., Haynor D.R., Kolker E., Rosenow C. Transcriptome analysis of Escherichia coli using high-density oligonucleotide probe arrays. Nucleic Acids Res. 2002;30:3732–3738. doi: 10.1093/nar/gkf505. [DOI] [PMC free article] [PubMed] [Google Scholar]
- Torarinsson E., Sawera M., Havgaard J.H., Fredholm M., Gorodkin J. Thousands of corresponding human and mouse genomic regions unalignable in primary sequence contain common RNA structure. Genome Res. 2006;16:885–889. doi: 10.1101/gr.5226606. [DOI] [PMC free article] [PubMed] [Google Scholar]
- Washietl S., Hofacker I.L., Stadler P.F. Fast and reliable prediction of noncoding RNAs. Proc. Natl. Acad. Sci. 2005;102:2454–2459. doi: 10.1073/pnas.0409169102. [DOI] [PMC free article] [PubMed] [Google Scholar]
- Washietl S., Pedersen J.S., Korbel J.O., Stocsits C., Gruber A.R., Hackermuller J., Hertel J., Lindemeyer M., Reiche K., Tanzer A., et al. Structured RNAs in the ENCODE selected regions of the human genome. Genome Res. 2007;17:852–864. doi: 10.1101/gr.5650707. [DOI] [PMC free article] [PubMed] [Google Scholar]
- Zhang Y., Zhang Z., Ling L., Shi B., Chen R. Conservation analysis of small RNA genes in Escherichia coli. Bioinformatics. 2004;20:599–603. doi: 10.1093/bioinformatics/btg457. [DOI] [PubMed] [Google Scholar]