Abstract
Understanding the detailed mechanism of protein folding requires dynamic, site-specific stereochemical information. The short time response of vibrational spectroscopies allows evaluation of the distribution of populations in rapid equilibrium as the peptide unfolds. Spectral shifts associated with isotopic labels along with local stereochemical sensitivity of vibrational circular dichroism (VCD) allow determination of the segment sequence of unfolding. For a series of alanine-rich peptides that form α-helices in aqueous solution, we used isotopic labeling and VCD to demonstrate that the α-helix noncooperatively unwinds from the ends with increasing temperature. For these blocked peptides, the C-terminal is frayed at 5°C. Ab initio level theoretical simulations of the IR and VCD band shapes are used to analyze the spectra and to confirm the conformation of the labeled components. The VCD signals associated with the labeled residues are amplified by coupling to the nonlabeled parts of the molecule. Thus small labeled segments are detectable and stereochemically defined in moderately large peptides in this report of site-specific peptide VCD conformational analysis.
Because of their intrinsically fast time response, optical spectra (UV absorption, fluorescence, or electronic circular dichroism) often have been used to follow rapid dynamic conformational changes in proteins. However, these electronic spectral techniques probe only chromophores or the amide backbone and are not site-specific. Electronic circular dichroism is the most widely used method of monitoring secondary structural change, but its low resolution prevents much discrimination; all conformational types as well as all amide sites contribute to overlapping bands (1, 2). Vibrational spectroscopy, by contrast, provides a means of monitoring conformational change that is selective for various types of secondary structure and is effective on a fast time scale to detect equilibrium populations of dynamic conformational states (3). Interpretation of IR and Raman spectra of proteins depends on frequency shifts of characteristic local modes that are perturbed by their conformational environment. These shifts are not unique, yet are still very useful in terms of detecting structural change (4–6). Vibrational circular dichroism (VCD) has enhanced sensitivity to conformational type and, because its interpretation depends on band shape, is less susceptible to error from frequency shifts arising from nonstereochemical sources (7). Nonetheless vibrational spectroscopy techniques assume that those residues that have a similar conformation will give overlapping bands with similar spectral responses. In other words, types of structures (conformations) often are resolved, but these cannot be assigned to specific sites.
Isotopic labeling has proven to be an invaluable tool for sorting out transitions and enhancing practical resolution in NMR experiments. Such labeling also has an impact on vibrational spectra, most often applied in terms of hydrogen/deuterium exchange (8, 9). Selective isotopic labeling with 13C can shift diagnostic IR bands sufficiently to provide a specific monitor of the labeled segment (10–12). If the properties of the transition are characteristic of secondary structure, such as is possible with the VCD band shape, then this labeling method additionally provides site-specific conformational insight. We report here on the determination of the local conformation of a specific 13C-labeled residue sequence by use of its isotope-shifted VCD band shape. Furthermore, we demonstrate that these spectra can be simulated by using an ab initio quantum mechanical-based property tensor transfer method, which includes hydrogen bonding in the helix (13, 14). The model system studied is an aqueous, alanine-rich peptide that is highly α-helical at low temperatures and undergoes a thermal denaturation (15).
Materials and Methods
Materials.
The alanine-rich peptides (20 residues) used in these experiments were synthesized, characterized, and purified at Mount Holyoke College (16, 17). Blocked peptides of the general form Ac-AAAAKAAAAKAAAAKAAAA-Y-NH2 were prepared by solid-state synthesis. Isotopic variants with 13C-substituted Ala (on the C = O) inserted in the four separate AAAA sequences were prepared (denoted L1, L2, L3, and L4 from the Ac-blocked N terminus as in Table 1). Because of the HPLC purification, the peptides contain a trifluoroacetic acid (TFA) impurity that absorbs at 1,672 cm-1 in the IR, partially interfering with the dominant amide I mode we wanted to study, but not materially affecting the VCD measurements (because TFA is achiral). D2O was purchased from Cambridge Isotope Laboratories, Cambridge, MA, and TFA, for baseline tests, was from Aldrich. All of the peptides used in spectral measurements were dissolved in D2O to the same concentration, 25 mg/ml (pH ≈ 3), and allowed to exchange overnight at room temperature. Loss of the amide II and stability of its intensity through heating cycles monitored full exchange.
Table 1.
Peptide sequences
| Notation | Label position | Peptide sequence |
|---|---|---|
| Unlabeled | None | Ac-AAAAKAAAAKAAAAKAAAAY-NH2 |
| L1 | N terminus | Ac-AAAAKAAAAKAAAAKAAAAY-NH2 |
| L2 | Middle by N | Ac-AAAAKAAAAKAAAAKAAAAY-NH2 |
| L3 | Middle by C | Ac-AAAAKAAAAKAAAAKAAAAY-NH2 |
| L4 | C terminus | Ac-AAAAKAAAAKAAAAKAAAAY-NH2 |
C-labeled residues (on the C=O) in bold.
Spectral Measurements.
VCD and IR absorption spectra were measured at the University of Illinois, Chicago by using a dispersive VCD instrument that has been detailed (18). All of the spectra were recorded with 10-cm-1 spectral resolution and 10-s time constant. Each sample spectrum represented an average of six or eight scans, requiring 3–4 h. Mid-IR measurements were repeated at 4-cm-1 resolution by using Bio-Rad FTS60A Fourier transform IR (FTIR) spectrometer with a DTGS detector as an average of 1,024 scans.
All of the samples for IR and VCD measurements were placed in a homemade demountable cell equipped with CaF2 windows separated by a 50-μm path-length Teflon spacer. A Neslab Instruments (Portsmouth, NH) (RTE-110) water circulating bath attached to a brass cooling jacket was used to control the temperature of the sample, which was monitored at the jacket by using a thermocouple. Baseline spectra of just D2O and the same amount of trifluoroacetic acid as found in the sample (determined by FTIR band fitting) were measured in the same way as the samples for both VCD and IR. The baselines were subtracted from the averaged sample spectra at each temperature.
Computations.
For the simulation of IR and VCD spectra, the molecular force field (FF), atomic polar tensors (APTs), and axial tensors (AATs) were computed ab initio by using the magnetic field perturbation and density functional theories (19) on smaller model peptides. These FF, APT and AAT parameters were transferred in Cartesian coordinates onto a larger oligopeptide as described in earlier work (13, 20). Target geometries were obtained from fully ab initio optimized α-helical and poly-l-proline II-like (left-handed 31 helix) helical structures of an alanine decamer, as detailed separately (P.B., J.K., and T.A.K., unpublished work). These stereochemical parameters then were propagated onto Ac-A20-NH2 to create the target conformations. Smaller fragments were used for evaluation of VCD parameters, Ac-A6-NH-CH3 for the α-helix and Ac-A4-NH-CH3 for the 31 helix, each fragment constrained to the appropriate torsional values and reoptimized at the density functional-BPW91/6–31G* level with gaussian 98 (21). Analytical harmonic FF, APT, and AAT values all were calculated for the fragment molecule at the same density functional level by using gauge invariant atomic orbitals within the magnetic field perturbation theory for the AAT (19).
Transfer of atomic tensors from fragments to a target molecule as well as isotopic substitution and subsequent FF diagonalization were performed by using our own computer programs. Parameters for the residues other than the termini were transferred from the central residue of the fragment. Force constants with respect to pairs of atoms not encompassed in the fragment were set to zero (or approximated by adding empirical transition dipole coupling, TDC, terms). The transferred FF then was diagonalized, yielding the frequencies and corresponding eigenvectors from which the dipole and rotational strengths (D and R, respectively) were calculated with the APT and AAT parameters. IR absorption and VCD spectra were simulated from the obtained harmonic frequencies, D and R values, using a Lorentzian line shape with a uniform bandwidth of 24 cm-1.
Results
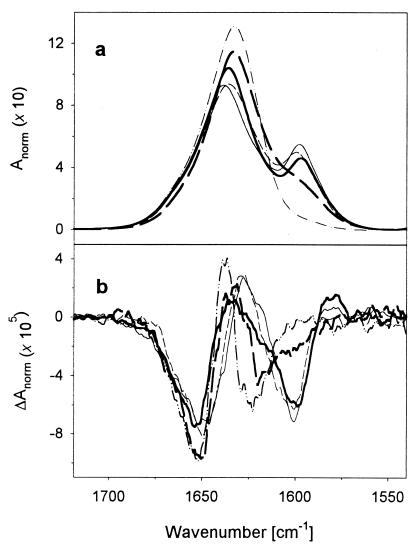
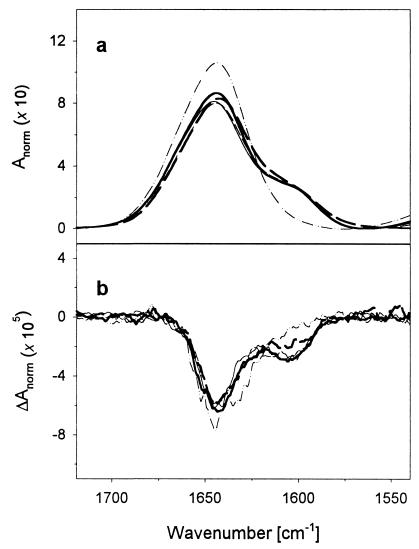
IR and VCD spectra of each sample were recorded from 5°C to 60°C in 5°C increments. To give the VCD results a reference base, FTIR spectra of the amide I′ bands of each of the peptides (with various isotopic patterns) at 5°C are overlaid in Fig. 1a. The L1, L2, and L3 peptides give similar spectra with a main 12C peak at ≈1,637 cm-1 and a weaker, resolved 13C peak at ≈1,600 cm-1, but L4 has just a broadened shoulder. This pattern follows that reported previously for a set of labeled 17-mers with two 13C labels (16). As temperature is increased, the main feature shifts up to ≈1,645 cm-1 and the 13C peak collapses to a shoulder, whereupon all of the 50°C-labeled peptide spectra look alike (Fig. 2a). VCD for all of the peptides at low temperatures indicate a high fraction of α-helix that results in an intense, predominantly W-shape spectral band over the amide I′ region (Fig. 1b). Just as for the high-frequency negative VCD lobe with respect to the main 12C IR band, the lower negative lobe for L1-L3 is to the high-frequency side of the 13C-induced IR band and is accompanied by the weak positive band at ≈1,580 cm-1, both features being consistent with α-helical character of the 13C segment. The L4 VCD was more like the unlabeled peptide than the other labeled peptides, yielding a narrower pattern, with the 13C negative band as a shoulder on the 12C component. On heating to 50°C, the VCD patterns for all of the differently labeled peptides became similar (Fig. 2b), being predominantly negative (for both the 13C and 12C bands). The 12C negative lobe shifted down in frequency (from the high- to low-frequency side of its IR), which is consistent with a change in sign of the VCD couplet, as expected for a coil form. A weak positive feature to high frequency of the 12C IR is also seen at high temperature (clearer in Fig. 3 and after factor analysis). The VCD signals at ≈1,600 cm-1 that correspond to the 13C part of the molecule are >50% as intense as the major features at ≈1,650 cm-1 from the 12C part of the molecule.
Figure 1.
Amide I′ FTIR (a) and VCD (b) spectra for an unlabeled (dotted/dashed line), L1 (thick solid line), L2 (thin solid line), L3 (thin dashed line), and L4 (thick dashed line) peptide at 5°C.
Figure 2.
Amide I′ FTIR (a) and VCD (b) spectra for an unlabeled (dotted/dashed line), L1 (thick solid line), L2 (thin solid line), L3 (thin dashed line), and L4 (thick dashed line) peptide at 50°C.
Figure 3.
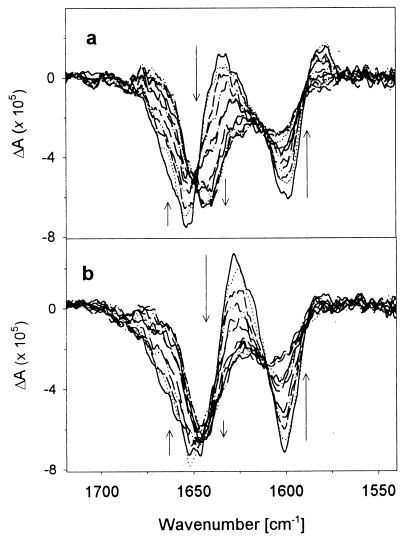
Temperature dependence of amide I′ VCD spectra for L1 (a) and L2 (b) from 5°C to 50°C. Arrows indicate spectral changes with increasing temperature.
Variable temperature VCD spectra for the unlabeled and labeled peptides were measured from 5°C to 60°C. The VCD for L2 and L3 have a very similar pattern as a function of temperature change, but L1 and L4 show distinctively different patterns, which are more pronounced than with FTIR. For L2 and L3 the change is mostly a loss of intensity in the lower frequency bands and shift for the higher frequency negative feature (Fig. 3b), whereas for L1 both the 12C and 13C VCD parts change dramatically in intensity and shift in frequency (Fig. 3a). The 13C component of the L4 VCD changed little, whereas the 12C part changed sharply in intensity (not shown).
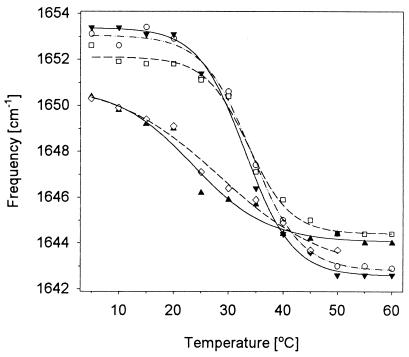
Analyses of these temperature-dependent spectra, FTIR and VCD, were carried out by using simple frequency shifts, intensity variations and band shape pattern methods, the last using factor analysis methods (22, 23). Most showed a gradual transition from the initial low to final high temperature form with a transition between 22°C and 35°C. The FTIR frequency changes yield a very broad transition; however, when components are resolved with second derivatives, they provide somewhat sigmoidal curves with an apparent half point systematically lower for L2 and L3 than for L1 and L4 in the 12C band and higher for L2 and L3 than L1 in the 13C band. For VCD, the 12C negative peak frequencies yield a sigmoidal pattern (Fig. 4) with L1, L4, and the unlabeled having a midpoint at ≈ 33°C, but for L2 and L3 below 30°C. The intensity variations are much noisier and less reliable.
Figure 4.
Temperature dependence of the main 12C negative amide I′ VCD band frequency for unlabeled (○), L1 (▾), L2 (▴), L3 (◊), and L4 (□).
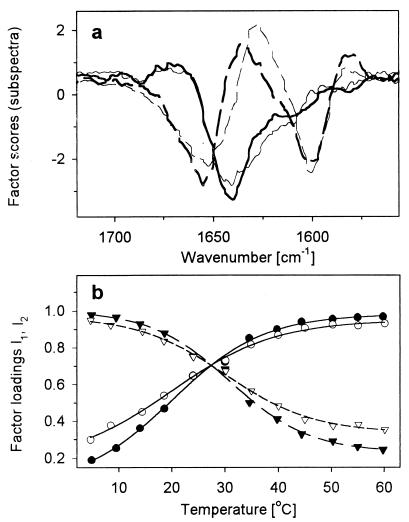
Factor analyses of the data show an interesting set of patterns. For the IR data, a simple gradual change is again found when loadings (22), or contributions, of the major factors are plotted against temperature, but for VCD, the plots are again sigmoidal. The labeled peptide VCD gives distinctly broader transitions than the unlabeled peptide, whereas in IR they are similar. For these VCD analyses, Varimax rotation of the vectors (22) enabled the first two components, representative of helical and coil states (shown for L1 and L2 in Fig. 5), to represent the bulk of the spectral response.
Figure 5.
Results of factor analysis of temperature dependence of amide I′ VCD spectra. (a) First (solid lines) and second (dashed lines) factor for L1 (thick lines) and L2 (thin lines) peptide. (b) First (●, ○) and second (▾, ▿) factor loadings for L1 (solid symbols) and L2 (empty symbols). Lines represent the least-squares sigmoidal fit (first loading, solid lines; second loading, dashed lines).
Discussion
These data represent the application of VCD for site-specific conformational analysis of peptide structure. The VCD band shape for the labeled segment indicates its local conformation and would even do so for just two labels (14, 24). By interpreting the spectra of a series of isotope-labeled alanine-rich peptides, we can draw conclusions about the detailed structure and conformation of the peptide, the mechanism of thermal unfolding in helical peptides, as well as the potential for general application of this method to study protein conformation and folding. To this end, we also present the ab initio level simulation of VCD and IR spectra for such isotopically labeled peptides.
The C Terminus of the Helix Is Significantly Frayed.
The VCD along with the complementary IR spectra for various isotopically labeled peptides conclusively demonstrate that the C-terminal region of these N- acetylated and C-capped Ala-rich peptides is not helical but is frayed, even at 5°C. This finding is consistent with earlier studies using EPR and NMR of similar peptides (25, 26) and the previously reported interpretations for the 17-mer peptide IR (16). The VCD spectra, having the characteristic α-helical band shape for the 12C part, but variable shape and temperature dependence for the 13C part depending on the site, combine to prove that although most of the peptide is dominantly α-helical, the C terminus is coil-like. That all of the labeled samples develop the same VCD band shape at high temperature (Fig. 2) confirms that their structures at high temperatures are similarly disordered even though they have distinct conformations at low temperatures (Fig. 1). That L4 shows no change in its 13C-labeled VCD confirms it is disordered at low temperature as well. The dominant negative VCD lobe to low frequency of the IR is consistent with a coil-like conformation (27, 28).
This observation of localized unfolding can be made only with the assistance of isotope labeling; previous IR and electronic circular dichroism studies could identify only a helix/coil mixture (23, 29). IR studies of unblocked peptides indicate that the Ac-group stabilizes the N-terminal helix (17). Although some evidence suggests such peptides may have significant 310 structure (30), particularly as they unfold, our data provide no direct support for that (23). It is possible that the higher temperature spectra represent a multistate equilibrium in which a 310-helical component plays some role that is not discriminated from the disordered component with this data.
Band Intensities of Labeled Residues Enhanced by Helical Environment.
An important characteristic of these data are the nonadditivity of the intensities for the 12C- and 13C-labeled parts. In the VCD, the intensity of the 13C originating bands is much higher than suggested by 20% labeling of the residues. In the low-temperature VCD (Fig. 1), the 13C negative band relative to the 12C component is more than twice as intense as the 13C statistical weight. This enhancement, much smaller in the high temperature spectra, is conformationally sensitive, being larger for the α-helix. Such an amplification implies that site-specific labeling has broader potential because a relatively small amount of label may be detected experimentally if it is in a helix, leading to more sensitivity to stereochemistry. Thus to use this enhancement it is important to understand it.
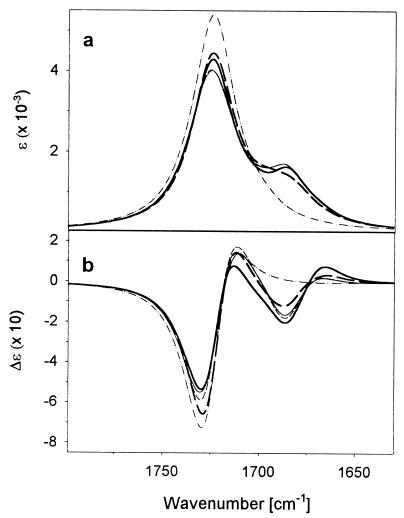
The results of our quantum chemical simulation of the 20-mer VCD are presented in Fig. 6 for comparison to Fig. 1. The simulated IR intensity of the 13C side band is noticeably weaker relative to the main 12C peak than in Fig. 1. However, several detailed systematics between the computed spectra for the differently positioned labels support the underlying validity of our simulation. The L2 and L3 13C IR side bands are the strongest whereas those of the L1 and L4 are somewhat weaker. This same pattern of IR intensity for different label positions is seen experimentally, where L1 has the highest intensity 12C and lowest 13C bands. This variance could arise from coupling of the middle-labeled residues to the helical residues lying before and after the labels, whereas those on the ends couple differently. In each simulation, only four transitions contribute to the low-frequency modes. Those involve mostly motions of the 13C-labeled C⩵O groups, making them mechanically localized. However, coupling to the 12C modes also can be electrostatic (through-space).
Figure 6.
Simulated amide I′ FTIR (a) and VCD (b) spectra for an unlabeled (dotted/dashed line), L1 (thick solid line), L2 (thin solid line), L3 (thin dashed line), and L4 (thick dashed line) peptide at α-helical conformation.
In the VCD simulations, L1 yields the strongest positive components and the overall most intense 13C VCD with correspondingly weaker 12C VCD, the opposite of the IR. By contrast, L4 has the weakest 13C VCD and most intense 12C VCD. The dramatic experimental increase in the VCD intensity for the helical 13C components probably arises from electric dipole coupling with helical 12C residues. In L4, the frayed 13C residues do not couple well to the 12C helical ones. Similarly, little enhancement is found in all of the high-temperature disordered 13C components.
The TDC mechanism can dominate VCD for symmetric molecules with two or more chirally displaced large dipole oscillators (31–33) and is the simplest interaction added to FF analyses of peptides (34–36). Although dipole coupling between local residues (via the heptamer ab initio FF) is included, for more widely separated residues, because of transfer limitations, it is not. Preliminary tests show that addition of long-range TDC terms to the FF (14) can lead to an increase in the 13C negative band intensity and a corresponding decrease in the 12C component. Both the 12C- and 13C-positive VCD bands computed in our simulations are decreased with added TDC. Thus TDC has the correct qualitative impact on spectra to explain the isotopically labeled VCD and IR intensity patterns. An even stronger impact of TDC on 13C-labeled IR intensities has been observed for β-sheets (36).
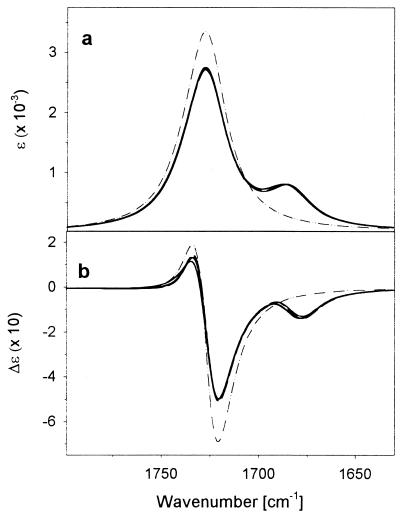
The high-temperature disordered state results follow the simulated patterns as well. Computing IR and VCD for this form is difficult, because we do not have a defined structure. Many experiments have shown that typical polypeptide random coil spectra are similar in band shape to those obtained for a poly-l-proline II (31) helix (27, 28). To provide an at least partially relevant comparison to the above helical results, we also have simulated the IR and VCD amide I′ spectra for the Ac-A20-NH2 peptide constrained to a 31 helical conformation (Fig. 7). Those “pseudocoil” spectra have more resolved 13C and 12C components than do the experimental high-temperature results (Fig. 2). This is expected because of the nonuniformity in the real high-temperature, disordered structure. Random-coil peptides lose local order at high temperatures, resulting in a broad, dominantly negative VCD (28). The relative frequencies of the simulated helix and this “coil” representation reflect the experimental results in that the coil amide I′ is higher in frequency than the helix. A dominant negative profile 31 VCD is computed, with the 13C side band being a negative shoulder on a larger negative main band, just as seen in the high-temperature experiment (Fig. 2). The computed weak positive high frequency band also fits the experiment. L1–L3 give very similar experimental spectra and are computed to be very similar. In contrast to the helical computations, there is very little isotopic positional differentiation between them, just as seen experimentally. This is consistent with the labels being in effectively similar local geometries in each high-temperature molecule, as would be expected of a disordered state, and of there being no long-range coupling of the labels to other components. That the C-terminal 13C labels are a bit different is possibly caused by the oversimplicity of the 31 extended helix as a coil model.
Figure 7.
Simulated amide I′ FTIR (a) and VCD (b) spectra for an unlabeled (dotted/dashed line), L1 (thick solid line), L2 (thin solid line), L3 (thin dashed line), and L4 (thick dashed line) peptide at polyPro II-helical conformation.
Given the approximations in the theoretical model used, the agreement with the experiment is exceptionally good. The density functional FF is known to yield relatively high frequencies for the amide I mode, and C⩵O modes (20, 37, 38), possibly because of its overestimating the C⩵O bond length (39) making absolute shifts unimportant. While underestimating the amide I-II split could potentially decouple local motions, for these calculations and experiments the N-H bond is deuterated, minimizing the impact of the amide II. Including explicit hydrogen bonds to water molecules can decrease the amide I-II split (14), but at the level of calculation reported here, this is not yet feasible. These are the largest ab initio-based VCD simulations reported to date and compare directly to the molecules studied.
Thermal Unfolding Begins at the Ends of the Peptide.
The temperature variations bring out the differential character of the labeled sites and provide an entree to the relative stability of the various sites. With these data we have the potential of determining different transition behavior for different parts of the molecule because our measurements sense the different sites, which lose structure at any given temperature to a different degree, with varying sensitivities. The key to understanding the temperature variation is that the ends unravel before the center, making the unfolding multistate, not two state, on a microscopic scale. We previously have detected an intermediate in the unfolding of unlabeled peptides by factor analysis of the VCD and IR band profile temperature variation (23, 28). How a given measurement senses specific sites will affect the observed thermal unfolding profile, but if the transition were truly two state, this would not matter. Similarly, if the measurement did not sense the local difference in the multiple states involved, such as can happen for electronic circular dichroism or fluorescence, one would miss the contribution of the helix-coil junctions. However, if the method samples the labeled portion differently from the unlabeled, then the observed transition will shift away from that found with an unlabeled peptide.
There are several ways to do this in the spectra we have presented. One can look at frequency shifts of the 12C and 13C bands in either IR or VCD, or at relative intensity changes for the various bands. VCD frequency shifts give a more sigmoidal profile variation than FTIR, showing different transition temperatures for the variously labeled peptides. For the unlabeled peptide, the 12C negative VCD peak frequency shifts with a transition temperature of 34°C (as does L4) and L1 is at ≈33°C but the L2 and L3 shift even lower (≈28°C and 23°C, respectively). The lower transition temperature for L2 and L3 arises from contribution due to the ends, which unwind at the lower temperature, preferentially contributing to the 12C peak. However, for the terminally labeled molecules, the bulk of the 12C peak correlates to the center of the molecule, which is most stable, only unwinding at higher temperatures.
Also one can study the entire profile changes by using factor analysis, which has improved precision by segregating noise to higher factors, but combines the contributions for the 13C and 12C components. Varimax rotation projects the components onto the major spectral contributors, which essentially separates the helix and coil contributions (Fig. 5). The shapes of these separated components even more closely reflect the computed band shapes. However, the sum of these contributions is not a constant and indicates that a third component (not shown) is significant, which parallels our earlier result (23), but adds information for the labeled segment on the peptide. Here the various peptides exhibit different transition temperatures for the contributions to the spectrum from the helical and coil-like components. A consistent picture emerges as the helical component has a transition at ≈ 28°C in the unlabeled peptide VCD, but for L1 this increased to 31°C caused by a discrimination (via labeling) of the less stable part (terminal residues). The L1 factor analysis plots (Fig. 5) have a distinct deviation from a simple sigmoid, which can be fit to two sigmoids; however, the quality of fit is less, yielding transitions at 21°C and 34°C, which probably represent the extremes of contributions to the overall profile.
Conclusions
A combination of isotopic labeling, IR and VCD spectroscopy confirms that these alanine-rich peptides are predominantly α-helical at low temperatures, unfold from the ends, and are less stable at the C terminal. The labels add site-specific selectivity to VCD stereochemical information. Theoretical simulation of the band shape implies that dipole coupling of the 13C to the 12C part is important, leading to an amplification of the effect in helices, and suggests a potential for detecting relatively small labels in larger systems.
Acknowledgments
This work was supported by the Petroleum Research Fund administered by the American Chemical Society (35443-AC4 to T.A.K.), by the National Institutes of Health (GM/OD 55897 to S.M.D.), and by the Grant Agency of the Czech Republic (203/97/P002 to P.B.).
Abbreviations
- VCD
vibrational circular dichroism
- FTIR
Fourier transform IR
- FF
force field
- APT
atomic polar tensor
- AAT
axial tensor
- TDC
transition dipole coupling
Footnotes
This paper was submitted directly (Track II) to the PNAS office.
Article published online before print: Proc. Natl. Acad. Sci. USA, 10.1073/pnas.140161997.
Article and publication date are at www.pnas.org/cgi/doi/10.1073/pnas.140161997
References
- 1.Johnson W C. Annu Rev Biophys Biophys Chem. 1988;17:145–166. doi: 10.1146/annurev.bb.17.060188.001045. [DOI] [PubMed] [Google Scholar]
- 2.Venyaminov S Y, Yang J T. In: Circular Dichroism and the Conformational Analysis of Biomolecules. Fasman G D, editor. New York: Plenum; 1996. pp. 69–107. [Google Scholar]
- 3.Cowen B R, Hochstrasser R M. In: Infrared Spectroscopy of Biomolecules. Mantsch H H, Chapman D, editors. Chichester, U.K.: Wiley-Liss; 1996. pp. 107–129. [Google Scholar]
- 4.Pancoska P, Wang L, Keiderling T A. Protein Sci. 1993;2:411–419. doi: 10.1002/pro.5560020313. [DOI] [PMC free article] [PubMed] [Google Scholar]
- 5.Surewicz W, Mantsch H H, Chapman D. Biochemistry. 1993;32:389–394. doi: 10.1021/bi00053a001. [DOI] [PubMed] [Google Scholar]
- 6.Jackson M, Mantsch H H. Crit Rev Biochem Mol Biol. 1995;30:95–120. doi: 10.3109/10409239509085140. [DOI] [PubMed] [Google Scholar]
- 7.Keiderling T A. In: Circular Dichroism: Principles and Applications. Nakanishi K, Berova N, Woody R A, editors. New York: Wiley; 2000. pp. 621–666. [Google Scholar]
- 8.Goormaghtigh E, Cabiaux V, Ruysschaert J M. In: Subcellular Biochemistry. Hilderson H J, Ralston G B, editors. Vol. 23. New York: Plenum; 1994. pp. 363–403. [Google Scholar]
- 9.Baello B, Pancoska P, Keiderling T A. Anal Biochem. 2000;280:46–57. doi: 10.1006/abio.2000.4483. [DOI] [PubMed] [Google Scholar]
- 10.Tadesse L, Nazarbaghi R, Walters L. J Am Chem Soc. 1991;113:7036–7037. [Google Scholar]
- 11.Haris P I, Robillard G T, van Dijk A A, Chapman D. Biochemistry. 1992;31:6279–6284. doi: 10.1021/bi00142a016. [DOI] [PubMed] [Google Scholar]
- 12.Fabian H, Chapman D, Mantsch H H. In: Infrared Spectroscopy of Biomolecules. Mantsch H H, Chapman D, editors. Chichester, U.K.: Wiley-Liss; 1996. pp. 341–352. [Google Scholar]
- 13.Bour P, Sopkova J, Bednarova L, Malon P, Keiderling T A. J Comput Chem. 1997;18:646–659. [Google Scholar]
- 14.Kubelka J, Silva R A G D, Bour P, Decatur S M, Keiderling T A. In: The Physical Chemistry of Chirality, ACS Symposium Series. Hicks J M, editor. New York: Oxford Univ. Press; 2000. , in press. [Google Scholar]
- 15.Marqusee S, Robbins V H, Baldwin R L. Proc Natl Acad Sci USA. 1989;86:5286–5290. doi: 10.1073/pnas.86.14.5286. [DOI] [PMC free article] [PubMed] [Google Scholar]
- 16.Decatur S M, Antonic J. J Am Chem Soc. 1999;121:11914–11915. [Google Scholar]
- 17.Decatur, S. M. (2000) Biopolymers, in press. [DOI] [PubMed]
- 18.Keiderling T A. In: Practical Fourier Transform Infrared Spectroscopy. Krishnan K, Ferraro J R, editors. San Diego: Academic; 1990. pp. 203–284. [Google Scholar]
- 19.Stephens P J, Ashvar C S, Devlin F J, Cheeseman J R, Frisch M J. Mol Phys. 1996;89:579–594. [Google Scholar]
- 20.Bour P, Kubelka J, Keiderling T A. Biopolymers. 2000;53:380–395. doi: 10.1002/(SICI)1097-0282(20000415)53:5<380::AID-BIP3>3.0.CO;2-R. [DOI] [PubMed] [Google Scholar]
- 21.Frisch M J, Trucks G W, Schlegel H B, Scuseria G E, Robb M A, Cheeseman J R, Zakrzewski V G, Montgomery J, J A, Stratmann R E, Burant J C, et al. gaussian 98. Pittsburgh PA: Gaussian; 1998. [Google Scholar]
- 22.Malinowski E R. Factor Analysis in Chemistry. 2nd Ed. New York: Wiley; 1991. [Google Scholar]
- 23.Yoder G, Pancoska P, Keiderling T A. Biochemistry. 1997;36:15123–15133. doi: 10.1021/bi971460g. [DOI] [PubMed] [Google Scholar]
- 24.Bour P, Keiderling T A. J Am Chem Soc. 1993;115:9602–9607. [Google Scholar]
- 25.Hansen P, Martinez G, Millhauser G, Formaggio F, Crisma M, Toniolo C, Vita C. J Am Chem Soc. 1996;118:271–272. [Google Scholar]
- 26.Rohl C A, Baldwin R L. Biochemistry. 1994;33:7760–7767. doi: 10.1021/bi00191a003. [DOI] [PubMed] [Google Scholar]
- 27.Dukor R K, Keiderling T A. Biopolymers. 1991;31:1747–1761. doi: 10.1002/bip.360311409. [DOI] [PubMed] [Google Scholar]
- 28.Keiderling T A, Silva R A G D, Yoder G, Dukor R, K. Bioorg Med Chem. 1999;7:133–141. doi: 10.1016/s0968-0896(98)00217-x. [DOI] [PubMed] [Google Scholar]
- 29.Rohl C A, Baldwin R L. Biochemistry. 1997;36:8435–8442. doi: 10.1021/bi9706677. [DOI] [PubMed] [Google Scholar]
- 30.Bolin K A, Millhauser G L. Acc Chem Res. 1999;32:1027–1033. [Google Scholar]
- 31.Narayanan U, Keiderling T A. J Am Chem Soc. 1983;105:6406–6410. [Google Scholar]
- 32.Bour P, Keiderling T A. J Am Chem Soc. 1992;114:9100–9105. [Google Scholar]
- 33.Wang L J, Yang L G, Keiderling T A. Biophys J. 1994;67:2460–2467. doi: 10.1016/S0006-3495(94)80734-9. [DOI] [PMC free article] [PubMed] [Google Scholar]
- 34.Torii H, Tasumi M. J Chem Phys. 1992;96:3379–3387. [Google Scholar]
- 35.Krimm S, Bandekar J. Adv Protein Chem. 1986;38:181–364. doi: 10.1016/s0065-3233(08)60528-8. [DOI] [PubMed] [Google Scholar]
- 36.Brauner J W, Dugan C, Mendelsohn R. J Am Chem Soc. 2000;122:677–683. [Google Scholar]
- 37.Tam C N, Bour P, Keiderling T A. J Am Chem Soc. 1996;118:10285–10293. [Google Scholar]
- 38.Jalkanen K J, Suhai S. Chem Phys. 1996;208:81–116. [Google Scholar]
- 39.Devlin F J, Finley J W, Stephens P J, Frisch M J. J Phys Chem. 1995;99:16883–16902. [Google Scholar]


