Abstract
Objectives
The objectives of this study were to 1) demonstrate X-ray microcomputed tomography (μCT) as a viable method for determining the polymerization shrinkage and microleakage on the same sample accurately and non-destructively, and 2) investigate the effect of sample geometry (e.g., C-factor and volume) on polymerization shrinkage and microleakage.
Methods
Composites placed in a series of model cavities of controlled C-factors and volumes were imaged using μCT to determine their precise location and volume before and after photopolymerization. Shrinkage was calculated by comparing the volume of composites before and after polymerization and leakage was predicted based on gap formation between composites and cavity walls as a function of position. Dye penetration experiments were used to validate μCT results.
Results
The degree of conversion (DC) of composites measured using FTIR in reflectance mode was nearly identical for composites filled in all model cavity geometries. The shrinkage of composites calculated based on μCT results was statically identical regardless of sample geometry. Microleakage, on the other hand, was highly dependent on the C-factor as well as the composite volume, with higher C-factors and larger volumes leading to a greater probability of microleakage. Spatial distribution of microleakage determined by μCT agreed well with results determined by dye penetration.
Significance
μ CT has proven to be a powerful technique in quantifying polymerization shrinkage and corresponding microleakage for clinically relevant cavity geometries.
Keywords: Composites, Dental restorative material, FTIR microspectroscopy, Microleakage, Photopolymerization, Polymerization shrinkage, X-ray microcomputed tomography
1. Introduction
Polymeric dental composites are increasingly used as restorative materials because of their good aesthetic and mechanical properties; however, their long-term performance remains less than optimal, frequently resulting in costly replacement procedures. Over 50 % of replacement procedures have been attributed to the formation of recurrent (secondary) caries [1–3]. It is believed that areas of microleakage (gaps) between the tooth and composite are susceptible to secondary caries formation. Penetration of bacteria through the gaps causes pulp pathology and material degradation, which lead to clinical failure [4, 5]. Microleakage of dental composites is often generated by polymerization shrinkage of methacrylate resins. Significant efforts have been focused on reducing the shrinkage of resin composites as well as developing methods to prevent microleakage by improving or optimizing the tooth-composite bonding.
Proper measurement techniques are necessary to correctly evaluate microleakage formation and propagation over time [6, 7]. Current methods have been limited to sectioning the restored tooth, followed by imaging. The prevailing approach involves submerging a bonded sample of tooth and composite in a dye solution, such as an organic dye or silver nitrate solution, followed by vertically sectioning several consecutive slices. The depth of dye penetration from these sections is measured and reported as microleakage. This approach provides the correct penetration depth with uniformly distributed microleakage. However, more in-depth analyses have revealed that microleakage is seldom uniformly distributed [8]. Thus, the depth measured from the vertical sections generally fluctuates unpredictably as the gap measured for a selective area cannot represent the entire sample. Although labor-intensive and tedious, sectioning the tooth-composite structure from the top to the bottom and scanning each cross-section can provide a more accurate picture of the microleakage. However, it is not feasible to characterize a large number of samples using this more comprehensive sectioning approach. Furthermore, sectioning destroys the sample and renders additional testing impossible.
With the advent of advanced imaging/tomography techniques, the internal structures can be monitored nondestructively. Using these techniques, monitoring polymerization shrinkage and microleakage is possible if the precise structure at each location in space is known. X-ray microcomputed tomography (μCT), which obtains the three-dimensional (3D) structures of small objects with high spatial resolution, has been widely accepted in biomedical research for examining the structure and mineral content of bones and teeth [9–12]. It has also been used to visualize structural features in tissue engineering scaffolds and subsequent tissue regeneration [13, 14]. In dental materials research, μCT has been used to analyze the structures at dentin-adhesive-composite interfaces [15], to characterize the mineral contact of enamel and dentin [16], and to evaluate 3D marginal adaptation qualitatively [17]. In the latter case, an accurate assessment of marginal adaptation depends on reliable volume calculations for the tooth and the restorative material. Results from μCT were also used to generate surface contours of enamel, dentin, and restorations, and analysis using 3D finite element analysis model [18]. In a previous study, we demonstrated that μCT can be utilized to accurately determine the volume of polymeric dental composites that have sufficient radiopacity. By comparing composite volumes before and after polymerization, the shrinkage in unconstrained containers can be obtained precisely and accurately [19].
In the current study, we examine the use of μCT to determine shrinkage and microleakage in defined and constrained geometries with varied volumes and configuration factors (C-factors, defined as the ratio of contact to noncontact area). This is accomplished by tracking the volume and position changes of dental composites before and after photopolymerization. Rather than describing microleakage only in terms of depth, we describe microleakage with more spatial information and with the aid of 3D visualization. Microleakage predictions obtained by μCT are also compared with results from a dye penetration method.
2. Materials and methods
2.1. Materials*
Model cavities were prepared by assembling a polymethylmethacrylate (PMMA) tube with a defined inner diameter and a desired height and a PMMA rod (base) with the same outer diameter. For all samples, the cavity surface was sandblasted with 50 μm alumina for 15 s, followed by 50 μm silica for 15 s to create roughened surface for mechanical interlocking. Fiduciary markers (glass beads, diameter 125 – 150 μm) were embedded into the PMMA sample holders for sample position calibration. The resin composite used in this study was a commercially available hybrid composite (TPH, Dentsply Caulk, shade A1).
2.2. X-ray Microcomputed Tomography
A Scanco Medical μCT 40 microcomputed tomography scanner was used to image the samples. The micro-focus X-ray source was set at 75 kVp and 114 μA and the samples were scanned at a 16 μm line resolution with an integration time of 300 s. The composite pastes were packed into model cavities and fixed upright at marked positions in the μCT sample holder. The composites were then irradiated from 1 mm above the top of the composite for 60 s using a 600 mW/cm2 Spectrum 200R (Dentsply Caulk) quartz tungsten halogen curing light equipped with an 8 mm 60° light guide. Another measurement was carried out 60 min after photopolymerization. 3D images were reconstructed and analyzed using the manufacturer’s complete imaging and evaluation software and ImageJ image analysis software. The shrinkage was calculated using procedures described in our previous publication [19]. Calculated shrinkage is an average of six measurements. Three samples from each group were used to evaluate microleakage.
2.3. ImageJ Software
ImageJ software (version 1.39) was downloaded from the NIH website. 2D images of composites before and after polymerization obtained from μCT were imported into ImageJ. Image properties were verified and the dimensions of the images were set according to the voxel size of the μCT data. 2D images were stacked to form 3D images which were used for calculation and further analysis. The 3D images generated for the sample after polymerization were subtracted from the images generated before polymerization. The volume difference between the image stacks predicted possible regions of leakage and was illustrated using 3D projection.
2.4. Dye Penetration
After the post-polymerization μCT measurements, samples were immersed into an aqueous Rhodamine B solution (1 % by mass) for 24 h. The pink dye penetrated into the composite/holder interface immediately. Dye penetration was captured for direct visualization.
2.5. FTIR Microspectroscopy
FTIR microspectroscopy analyses were performed using a Nicolet Magna-IR 550 FTIR spectrophotometer interfaced with a Nic-Plan IR microscope operated in reflectance mode (FTIR-RM). The microscope was equipped with a video camera, a liquid nitrogen-cooled mercury cadmium telluride (MCT) detector and a computer-controlled x–y translation stage. A total of 64 scans were collected from 650 cm−1 to 4000 cm−1 at 8 cm−1 resolution with a beam spot size of 90 μm × 90 μm. Five spectra each were obtained from the flat top and bottom of each filled cavity (from their middle and from 0.5 mm to their right, left, above and below). Each spot was manually focused before data collection. The reflectance spectra were proportioned against a background of an aluminum mirror and transformed to absorbance spectra using the Kramers-Kronig transform algorithm for dispersion correction, which converts the reflectance spectra to absorbance-like spectra [20, 21]. The degree of conversion (DC) was calculated as the reduction in the methacrylate peak (1634 cm−1) height using the phenyl absorbance peak (1610 cm−1) as an internal standard.
Composite-filled PMMA tubes were sandwiched between two glass cover slips in order to obtain the smooth top and bottom surfaces that are required for FTIR-RM. During photopolymerization, samples were placed onto a black surface to reduce light reflection, and the curing light radiated from 1 mm above the top surface of the samples. Each sample was cured for 60 s and the FTIR-RM spectra were obtained from both the top (close to curing light) and bottom surfaces at 1 h and 24 h after light curing. The degree of conversion (DC) was calculated. The results are an average of 5 measurements.
2.6. Statistical Analysis
Polymerization shrinkage values determined using μCT and DC measured by FTIR-RM were analyzed using one-way analysis of variance (ANOVA) with a 95 % confidence interval to indicate significant differences.
3. Results and discussion
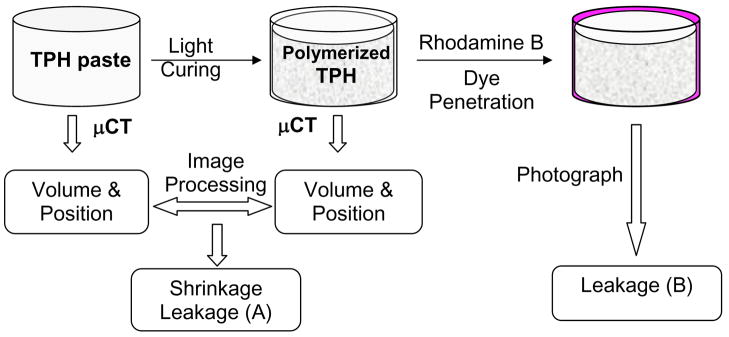
The general procedures for determining the polymerization shrinkage and corresponding microleakage are illustrated in Scheme 1. μCT was used to measure the composite volumes before and after photopolymerization and shrinkage was calculated based on the percentage of volume change upon polymerization. The current study examines the effect of C-factor and sample volume on polymerization shrinkage and the corresponding microleakage, which was determined by assessing the distribution of polymerization shrinkage at the composite-cavity interface. A parallel experiment to characterize microleakage was carried out by dye penetration experiments to validate the μCT results.
Scheme 1.
Illustration of experimental design. The composites in model cavities were fixed to sample holders and measured before and after photopolymerization. The polymerization shrinkage was determined by comparing the volume and position of composites before and after polymerization. The possible leaking areas/regions were predicted after analysis. The same sample was subsequently immersed in a Rhodamine B dye solution. Dye penetration provided visual assessment of leakage position as supplemental information to compare to microleakage results derived from μCT.
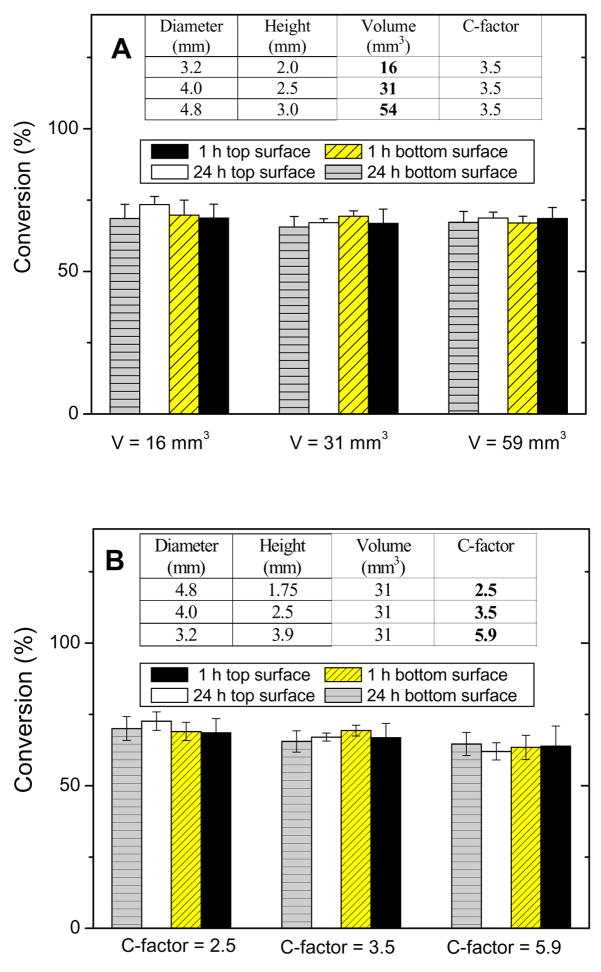
To obtain a meaningful comparison of shrinkage and leakage results when evaluating composites placed in cavities of differing C-factors and volumes, it is imperative for all samples to have an identical DC; therefore, DC of composites was examined using FTIR-RM [22]. Figure 1 illustrates the DC of composites at the top and bottom surfaces 1 h and 24 h post-cure. All samples reached approximately 69 % conversion regardless of position and time after irradiation. The statistical analysis of variance indicates that there was no significant difference among samples that have the same C-factor but different volumes (Fig 1A) or have the same volume but different C-factors (Fig 1B). The same DC at the top and bottom of the samples suggests that the light irradiation was equally effective at all positions and polymerization kinetics were relatively uniform. The transparency of the PMMA sample holders allowed light to penetrate as far as 3.9 mm to produce evenly polymerized materials. These results confirm that the shrinkage and leakage results obtained by μCT in different model cavities can be compared directly.
Figure 1.
Degree of conversion of composites measured using FTIR-RM. A) DC of composite with the same C-factor but different volumes; B) DC of composites with the same volume but different C-factors. Results are an average of five measurements.
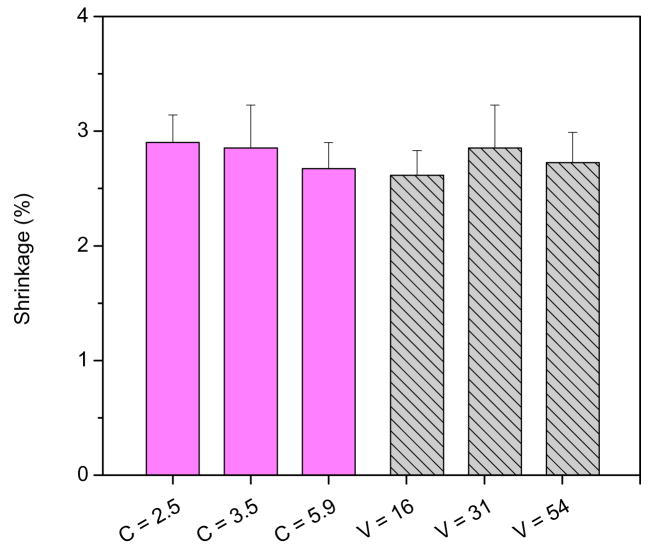
The composite shrinkage as a function of C-factor and sample volume was examined using μCT (Fig. 2). In previous studies, different shrinkage volumes were often observed for the same material using different test methods [23]. These variations in polymerization shrinkage have been attributed in part to differences in the test set-up, generally associated with the C-factor and sample volume. The current study separates the two parameters, holding one constant and examining the effect of each parameter independently. The shrinkage of the composite ranged between 2.6 % and 2.9 % for all configurations and the statistical analysis showed no significant differences (p-value < 0.05) in shrinkage among samples with different C-factors or volumes. These results indicate that neither C-factor nor sample volume affects polymerization shrinkage at a constant DC. Consequently, we attribute the observed differences in interfacial volume changes and subsequent microleakage to the sample geometry.
Figure 2.
Polymerization shrinkage (n = 6) determined for the same composite under constrained sample geometries as a function of C-factor and sample volume (mm3) using μCT.
In addition to measuring the shrinkage, the same samples were used to assess positional changes in order to predict sites for potential microleakage. One critical issue for achievement of reliable results is time-resolve image alignment. In other words, a direct data comparison of pre- and post-polymerization images requires the sample position to be stationary. Since minor position shifts can occur upon scanning, fiduciary markers were inserted into sample holders to correct for any sample shifts during the measurement. The centers of mass of fiduciary markers were determined and noted as reference positions. Images from before and after polymerization were shifted in the three principal axes such that the reference positions matched precisely.
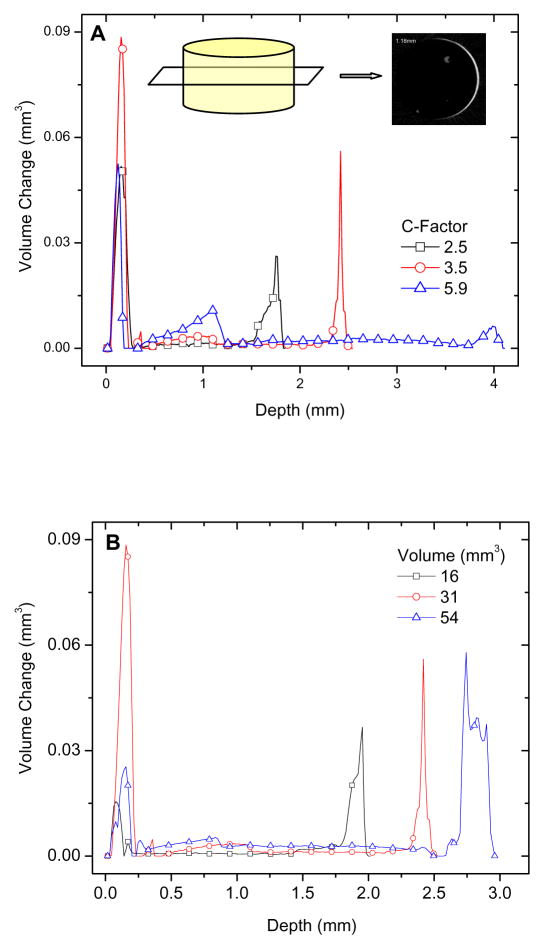
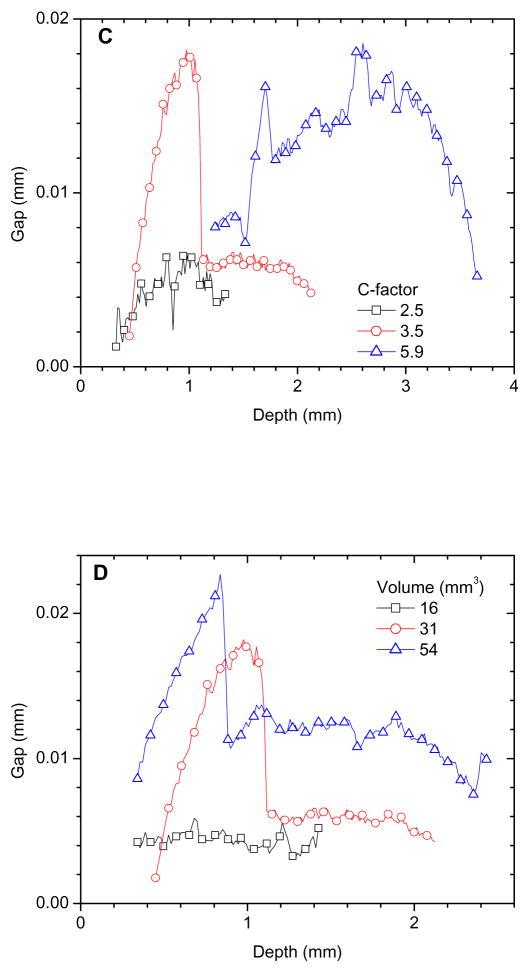
We first evaluate shrinkage as a function of sample depth using the following method. For each slice, we calculate an area difference (ΔA) of the composite before and after photopolymerization (Figure 3A, inset), from which the volume difference (ΔV) was determined (ΔV = ΔA × h, where h is the height of each slice, 16 μm). The volume difference is plotted as a function of sample depth (Fig. 3). For all samples, the majority of the shrinkage occurred at the top and bottom of the composites, but shrinkage was also observed in the mid-section of the samples, indicating sites for potential leakage. When comparing samples with the same volume but different C-factors, composites with the largest C-factor (5.9) exhibited the highest shrinkage in the mid-section (Fig. 3A), whereas composites in holders with lower C-factors showed a smaller volume change in the bulk of the sample. The percentage of total shrinkage in the midsection (approximately 54 % of the total height) was 9.3 %, 17.2 %, and 43.6 % of total volume change for C-factors of 2.5, 3.5, and 5.9, respectively. Since overall shrinkage is the same for all samples and occurs predominately at the top, geometries with lower C-factors can accommodate a greater shrinkage volume at the free surfaces and thus reduce shrinkage distributed throughout the constrained sample surfaces. For samples with the same C-factor (3.5) but different volumes, shrinkage was directly correlated with sample volume (Fig. 3B). The percentage of the volume changes of the mid-section increased as the volume increased, i.e., 12.1 %, 17.2 %, and 24.3 % of total volume changes for cavity volume of 16 mm3, 31 mm3, and 54 mm3, respectively. These results are expected since a larger composite volume results in a greater overall volume change, which should lead to greater stress and leakage. Another way to correlate microleakage with volume change is to calculate a gap (distance between delaminated composite and cavity wall) using the volume difference between cured and uncured composite as a function of depth. (Gap = volume/area of the cavity-composite interface). The calculated gaps in the mid-section of samples listed in Fig. 3A and 3B are shown in Fig. 3C and 3D, respectively, and confirm that a larger C-factor or volume results in a larger gap.
Figure 3.
Volume changes measured as a function of sample depth (at 16 μm intervals): (A) a series of samples with constant volume and varied C-factors, inset shows the area difference between polymerized and unpolymerized composite for one slice, from which the volume difference was calculated and plotted as one data point along the sample depth, and (B) a series of samples with constant C-factor and varied sample volumes; Gaps in the central portion as a function of depth:(C) a series of samples with constant volume but varied C-factors, and (D) a series of samples with constant C-factor but varied and sample volumes.
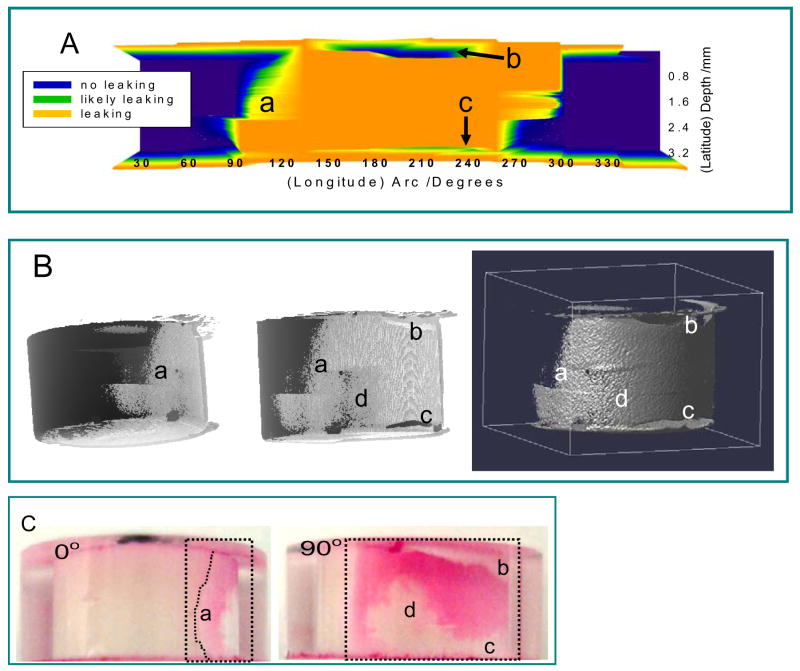
The data illustrated in Fig. 3 represent volume and average gaps at each slice. This is inadequate to predict the spatial distribution of microleakage. In the following, we use two analysis approaches to quantify the spatial distribution of microleakage and compare those results with images captured from dye penetration experiments. The first approach involves further sectioning the data (described in Fig 3) - each slice is divided into 12 equally spaced 30 ° arcs. The depth of the sample is analogous to latitude and the arcs are analogous to longitude on a map. The gaps are calculated as previously described but for a smaller area (1/12 of the unit area). A location is designated as “leaking” if the gap at a location is greater than 16 μm; likewise, designated as “likely leaking” if the gap is between 0 to 16 μm; and designated as “not leaking” if no gap is found. Based on these criteria, a microleakage map can be generated and presented in 2D. An example is shown in Fig. 4A (C-factor = 3.5 and volume = 54 mm3). The leakage map clearly indicates that the microleakage was highly non-uniform. For all the samples shown in Fig. 3, the analysis showed that one side of the composites delaminated from the sample holder while the other side remained in contact.
Figure 4.
(A) 2D leakage map determined by μCT evaluation where the circumference is plotted on the x-axis and the sample depth is plotted on the y-axis (refer to text for the definition of leaking); (B) the left two images are 3D leakage maps from different views where the leakage is in light gray and the composite is in dark gray; the right image is a 3D side view of the leakage only; the middle and right images share the same view point; and (C) Optical images of the same sample captured between 0° and 90°, corresponding to angles shown in Figure 4. The leakage regions are enclosed in dotted lines. Letters a, b, c, and d point to 4 identical locations for both image processing and dye penetration results.
The second analysis approach compares the composite before and after polymerization voxel-by-voxel. The analysis was performed with the aid of an image analysis macro written for ImageJ software that can rotate and translate the μCT reconstructions in 3D space. This capability allows for the comparison and calculation of pre- and post-polymerization 3D reconstructions, thus providing a 3D visualization for the microleakage. Fig. 4B illustrates three projection views of microleakage for the same sample from different viewing angles. The uneven distribution of microleakage can be clearly visualized.
The 2D and 3D leakage maps were compared with photographs of the same sample captured at different angles after dye penetration (Fig. 4C).. The same features are labeled as “a–d” for all 2D and 3D leakage maps, where “a” describes the curvature of leakage region at approximately 90°; “b” is a void region as indicated by the white color in Figure 4B (middle image), but can be misinterpreted as no leakage from other data presentations; “c” is a region with no leakage; “d” denotes a complex region where a reticular leakage pattern consisted of discontinuous islands is expected from the dye penetration and pixel-by-pixel calculation, similar to previously observed nanoleakage structures [24]. However, more crude 2D leakage map cannot provide the leakage pattern and simply indicate this region as non-leaking. In general, the leakage information predicted by μCT agreed well with results from dye penetration in terms of the depth and overall spatial distribution. These results highlight the complexity of leakage patterns and the advantages of 3D leakage mapping, which better correlate with dye penetration (true) leakage results. The composite with the largest C-factor and the composite with the largest volume had complete dye penetration from the top to the bottom. All other samples showed appreciable dye penetration.
Each of the two μCT analysis approaches has its advantages and deficiencies. The first approach that uses sectioning followed by gap calculation provides a reasonable spatial distribution, although an improved spatial resolution is attainable if the sample is sectioned into more arcs. The gap values calculated based on a sufficiently large number of data points can be used to reasonably predict the magnitude of large gaps. The second approach that involves voxel-to-voxel comparison gives good spatial resolution and provides a visualization tool. However, the results maybe more qualitative in term of the gap dimension as the magnitude of any predicted leakage cannot be accurately evaluated. Dye penetration experiments provide spatial resolution in model PMMA cavities, but provide relatively little information in actual teeth without laborious sectioning and imaging. μCT analyses can provide an equal amount of information without destroying the sample. The microleakage maps presented in this work are an improvement over previous quantification methods that typically present microleakage only in terms of depth.
4. Conclusions
X-ray microcomputed tomography is effective in determining the precise volume and position of polymeric dental composites in model cavities, from which polymerization shrinkage and microleakage may be determined. At the same DC, polymerization shrinkage results in model cavities of different C-factors and volumes were statistically identical. In all model cavities, the composite contracted predominantly from the top and bottom surfaces, although shrinkage was found throughout the entire depth of the sample. Microleakage characterized as gaps between the cavity wall and the composite was highly dependent on C-factor as well as composite volume, with higher C-factors and larger volumes leading to greater probability of microleakage. Microleakage results predicted by μCT analysis combined with 3D image analysis agreed well with those obtained by dye penetration. For all samples evaluated, the microleakage was not uniform, highlighting the need for a comprehensive evaluation. The primary advantages of the methods presented in this study include the ability to characterize microleakage regardless of sample geometry and the nondestructive nature of these measurements, which permit further evaluation on intact samples.
Acknowledgments
Financial support was provided through an NIDCR/NIST Interagency Agreement Y1-DE-7005-01. We would like to thank Drs. Gary E. Schumacher, Joseph M. Antonucci, Marcus T. Cicerone, Martin Chiang, Diana N. Zeiger, and Nancy J. Lin for their helpful discussions.
Footnotes
Official contribution of the National Institute of Standards and Technology; not subject to copyright in the United States
Certain equipment, instruments or materials are identified in this paper to adequately specify the experimental details. Such identification does not imply recommendation by the National Institute of Standards and Technology or the American Dental Association, nor does it imply the materials are necessary the best available for the purpose.
Publisher's Disclaimer: This is a PDF file of an unedited manuscript that has been accepted for publication. As a service to our customers we are providing this early version of the manuscript. The manuscript will undergo copyediting, typesetting, and review of the resulting proof before it is published in its final citable form. Please note that during the production process errors may be discovered which could affect the content, and all legal disclaimers that apply to the journal pertain.
Reference List
- 1.Manhart J, Chen HY, Hamm G, Hickel R. Review of the clinical survival of direct and indirect restorations in posterior teeth of the permanent dentition. Operative Dentistry. 2004;29:481–508. [PubMed] [Google Scholar]
- 2.Turkun LS, Aktener O, Ates M. Clinical evaluation of different posterior resin composite materials: A 7-year report. Quintessence International. 2003;34:418–26. [PubMed] [Google Scholar]
- 3.Mjor IA, Toffenetti OF. Secondary caries: A literature review with case reports. Quintessence International. 2000;31:165–79. [PubMed] [Google Scholar]
- 4.Hashimoto M, Ohno H, Sano H, Kaga M, Oguchi H. In vitro degradation of resin-dentin bonds analyzed by microtensile bond test, scanning and transmission electron microscopy. Biomaterials. 2003;24:3795–803. doi: 10.1016/s0142-9612(03)00262-x. [DOI] [PubMed] [Google Scholar]
- 5.Camps J, Dejou J, Remusat M, About I. Factors influencing pulpal response to cavity restorations. Dental Materials. 2000;16:432–40. doi: 10.1016/s0109-5641(00)00041-5. [DOI] [PubMed] [Google Scholar]
- 6.Alani AH, Toh CG. Detection of microleakage around dental restorations: A review. Operative Dentistry. 1997;22:173–85. [PubMed] [Google Scholar]
- 7.Dejou J, Sindres V, Camps J. Influence of criteria on the results of in vitro evaluation of microleakage. Dental Materials. 1996;12:342–9. doi: 10.1016/s0109-5641(96)80044-3. [DOI] [PubMed] [Google Scholar]
- 8.Raskin A, Tassery H, D’Hoore W, Gonthier S, Vreven J, Degrange M, Dejou J. Influence of the number of sections on reliability of in vitro microleakage evaluations. American Journal of Dentistry. 2003;16:207–10. [PubMed] [Google Scholar]
- 9.Kalender WA. X-ray computed tomography. Physics in Medicine and Biology. 2006;51:R29–R43. doi: 10.1088/0031-9155/51/13/R03. [DOI] [PubMed] [Google Scholar]
- 10.Stock SR, Barss J, Dahl T, Veis A, Almer JD. X-ray absorption microtomography (microCT) and small beam diffraction mapping of sea urchin teeth. Journal of Structural Biology. 2002;139:1–12. doi: 10.1016/s1047-8477(02)00500-2. [DOI] [PubMed] [Google Scholar]
- 11.Ruegsegger P, Koller B, Muller R. A microtomographic system for the nondestructive evaluation of bone architecture. Calcified Tissue International. 1996;58:24–9. doi: 10.1007/BF02509542. [DOI] [PubMed] [Google Scholar]
- 12.Plotino G, Grande NM, Pecci R, Bedini R, Pameijer CN, Somma F. Three-dimensional imaging using microcomputed tomography for studying tooth macromorphology. Journal of the American Dental Association. 2006;137:1555–61. doi: 10.14219/jada.archive.2006.0091. [DOI] [PubMed] [Google Scholar]
- 13.Landis FA, Stephens JS, Cooper JA, Cicerone MT, Lin-Gibson S. Tissue engineering scaffolds based on photocured dimethacrylate polymers for in vitro optical Imaging. Biomacromolecules. 2006;7:1751–7. doi: 10.1021/bm0600466. [DOI] [PubMed] [Google Scholar]
- 14.Ho ST, Hutmacher DW. A comparison of micro CT with other techniques used in the characterization of scaffolds. Biomaterials. 2006;27:1362–76. doi: 10.1016/j.biomaterials.2005.08.035. [DOI] [PubMed] [Google Scholar]
- 15.De Santis R, Mollica F, Prisco D, Rengo S, Ambrosio L, Nicolais L. A 3D analysis of mechanically stressed dentin-adhesive-composite interfaces using X-ray micro-CT. Biomaterials. 2005;26:257–70. doi: 10.1016/j.biomaterials.2004.02.024. [DOI] [PubMed] [Google Scholar]
- 16.Efeoglu N, Wood DJ, Efeoglu C. Thirty-five percent carbamide peroxide application causes in vitro demineralization of enamel. Dental Materials. 2007;23:900–4. doi: 10.1016/j.dental.2006.06.032. [DOI] [PubMed] [Google Scholar]
- 17.Kakaboura A, Rahiotis C, Watts D, Silikas N, Eliades G. 3D-marginal adaptation versus setting shrinkage in light-cured microhybrid resin composite. Dental Materials. 2007;23:272–8. doi: 10.1016/j.dental.2006.01.020. [DOI] [PubMed] [Google Scholar]
- 18.Magne P. Efficient 3D finite element analysis of dental restorative procedures using micro-CT data. Dental Materials. 2007;23:539–48. doi: 10.1016/j.dental.2006.03.013. [DOI] [PubMed] [Google Scholar]
- 19.Sun J, Lin-Gibson S. X-ray microcomputed tomography for measuring polymerization shrinkage of polymeric dental composites. Dental Materials. 2007 doi: 10.1016/j.dental.2007.05.001. in press. [DOI] [PubMed] [Google Scholar]
- 20.Tesch W, Eidelman N, Roschger P, Goldenberg F, Klaushofer K, Fratzl P. Graded microstructure and mechanical properties of human crown dentin. Calcified Tissue International. 2001;69:147–57. doi: 10.1007/s00223-001-2012-z. [DOI] [PubMed] [Google Scholar]
- 21.Reffner JA, Wihlborg WT. Microanalysis by Reflectance Ftir Microscopy. American Laboratory. 1990;22:26. [Google Scholar]
- 22.Lin NJ, Drzal PL, Lin-Gibson S. Two-dimensional gradient platforms for rapid assessment of dental polymers: A chemical, mechanical and biological evaluation. Dental Materials. 2007;23:1211–20. doi: 10.1016/j.dental.2006.11.020. [DOI] [PubMed] [Google Scholar]
- 23.Sakaguchi RL, Wiltbank BD, Shah NC. Critical configuration analysis of four methods for measuring polymerization shrinkage strain of composites. Dental Materials. 2004;20:388–96. doi: 10.1016/j.dental.2003.11.002. [DOI] [PubMed] [Google Scholar]
- 24.Tay FR, Pashley DH, Yiu C, Cheong C, Hashimoto M, Itou K, Yoshiyama M, King NM. Nanoleakage types and potential implications: Evidence from unfilled and filled adhesives with the same resin composition. American Journal of Dentistry. 2004;17:182–90. [PubMed] [Google Scholar]


