

Abstract
We sought to examine the relations between age, gender and brain volumes in an elderly population; we also sought to examine ways of measuring these relations. Three sets of analyses were used: correlational analyses, in which correlations between independent variables and brain volumes were calculated without correction for intracranial volume (ICV); covariational analyses, in which ICV was used as a covariate in regression equations; and ratio analyses, in which the dependent variable was the ratio of brain volume to ICV. These analyses yielded similar results, except that (as expected) adjusting for ICV altered estimates of gender differences. Analyses of age showed decreases in left caudate, putamen, and right hippocampus and an increase in CSF, a result generally in accord with previous findings. However, we also found a significant decrease of white-matter volumes and no significant decrease in total gray-matter volumes. Correlational analyses showed that men did not always have larger volumes despite their larger head size; women generally had larger volumes after adjusting for ICV. We found no age-gender interactions.
Keywords: gray matter, white matter, volumetry, morphometry, aging, gender, sex, hippocampus, putamen, caudate, cerebrospinal fluid
1. Introduction
Numerous studies have documented the ways in which the healthy adult brain changes with age. In general, brain parenchyma atrophies as a result of aging, while cerebrospinal fluid (CSF) and white-matter lesions correspondingly increase in volume [1-3, 7, 8, 15, 18, 21, 22, 23, 28, 29, 35, 41, 43, 46, 49, 51, 55-57]. This decrease in parenchymal volume has generally been attributed to atrophy of gray matter [5, 8, 21, 28, 35, 41, 43, 45, 48; but see [23] for an exception], particularly cortical thinning [50], and may result from cell-body atrophy or the outright death of cells [44]. Gray matter atrophy is in turn thought to enable the increase in CSF volume [28, 35, 41, 43]. The effects of aging on white matter are not as clear, however. Many studies have found a decrease in white-matter volume [2, 16, 23, 29, 33, 34, 45, 48, 49, 57], perhaps because of demyelination [44]. Several of these studies have reported nonlinear rates of decline, particularly in the elderly, with studies reporting significant quadratic [16, 57] or cubic [2]. Other studies, however, report no age-related change in total white matter volume [18, 28, 35, 41, 43, 55], and some even report an increase [8, 21].
Aging also affects specific cortical and subcortical brain structures. The basal ganglia shrink with age [55, 59; for an exception, see 33]. Structures within the basal ganglia also show age-related atrophy, including the caudate [14, 20, 24, 25, 28, 31, 32, 38, 39, 40, 47, 52, 57], the lentiform nucleus (comprised of the putamen and the globus pallidus) [28, 39], and the putamen itself [24, 25, 37, 40, 47, 52, 57]. One study reported a small age-related decrease in the basal ganglia involving only the head of the caudate and the putamen; the body of the caudate showed no decline [21]. Many studies of the hippocampus have found that it shrinks with age as well [2, 10, 13, 29, 33, 38, 46, 48, 57; for exceptions, see 18, 34, 54].
Other investigations have examined gender differences in brain volumes; in particular, they have tried to determine if age-related changes are gender-dimorphic. Previous reports of gender differences have generally indicated smaller gray matter structures in males after controlling for whole-brain volume or body size. Some studies have reported age-sex interactions, with atrophy of the male brain beginning at an earlier age and progressing more rapidly [11, 22, 38, 46, 47, 52, 59]. More recent studies, however, tend to find no interactions [2, 16, 18, 33, 34, 49, 50, 58].
There have been numerous reports of hemispheric differences in the brain, some of which report aging and gender differences that are more substantial on one side of the brain than the other. In many studies, the right hemisphere is found to be larger than the left [22, 45, 59, 46]. For specific brain regions, this relation may not be as consistent, with some structures larger in the left hemisphere and others larger in the right [45, 46, 48, 54, 56, 58]. Studies of the basal ganglia have been particularly contradictory; 2 studies report a larger right caudate [27, 47] and 2 report a larger left caudate [20, 25]. One longitudinal study has reported that gray matter atrophy is more substantial in the right hemisphere [49]. Two studies have suggested that patterns of hemispheric atrophy differ between genders, finding that hemispheric atrophy was symmetric in women, but more severe in the left hemisphere in men [11, 22; but see [59] for a contrary finding]. Females have smaller hippocampi than males, even after adjusting for body size [45]; moreover, the female hippocampus is thought to shrink more rapidly [21, 38], though there have been some contradictory studies [17, 46].
Most of the studies cited above had a small number of subjects; of those that had a sample size over 140, almost all included subjects ranging in age from 15 – 93, with only a smaller number of elderly. Moreover, many of these studies did not provide quantitative estimates of the rate of atrophy, instead presenting correlations or analyses of variance that compared different age groups; others have used relatively imprecise rating scales, particularly when measuring white-matter hyperintensities. Given previous findings of an increase in the rate of decline among the elderly [1], we decided to focus on an elderly population. We investigated the rate of volume change in gray and white matter tissue, cerebrospinal fluid, and lesions, as well as the caudate, putamen, and hippocampus. We sought to address several issues (for a similar approach, see [4]): Can we provide precise, quantitative estimates of brain atrophy, laterality, and gender differences? In particular, what is the relation between white-matter decline and aging in an older population? To what extent do these estimates change depending on the kind of analyses and covariates that are used?
Based on previous results, we predicted that gray-matter volumes, including those of smaller gray-matter structures, would be negatively correlated with age while CSF volumes would be positively correlated. Furthermore, given that we were focusing on an elderly population, we predicted that white-matter volumes would be negatively correlated with age as well. We also predicted that the choice of covariate would not substantially change the results of these analyses [4]. For the gender analyses, we predicted that the use of the covariates would make a difference: uncorrected volumes were expected to be larger in men than in women; corrected volumes were expected to be larger in women than in men, with the exception of the hippocampus.
2. Materials and methods
2.1. Study population
The study population was recruited from a pool of normal elderly used as controls for studies on depression. MRI data on these controls have been used in several previous studies [42, 53]. Eligible controls had a non-focal neurological examination, no self-report of neurologic or depressive illness, and no evidence of depression. Eligibility for this study was restricted to those aged 60 yrs or older who could speak and write English. Exclusion criteria included (1) another major psychiatric illness, such as bipolar disorder, schizophrenia, and schizoaffective disorder; (2) active alcohol or drug dependence; (3) primary neurologic illness, such as dementia, stroke, Parkinson's disease, seizure disorder and multiple sclerosis; (4) medications or medical illness that may affect cognitive function; (5) physical disability which precludes cognitive testing; and (6) metal in the body which precludes magnetic resonance imaging (MRI).
The experimental design was approved by our Institutional Review Board. The purpose of the study and its procedures were explained to each subject, and those who provided written informed consent were enrolled. At baseline, all enrolled subjects underwent a magnetic resonance imaging scan of the brain using standardized procedures, which are described more fully below.
2.2. MRI acquisition
All subjects were screened for the presence of cardiac pacemakers, neurostimulators, metallic implants, metal in the orbit, aneurysm clips or any other condition where MRI was contraindicated. Subjects were imaged under an Institutional Review Board Approved protocol, with a 1.5 Tesla whole-body MRI system (Signa, GE Medical Systems, Milwaukee, WI) using the standard head (volumetric) radiofrequency coil. Padding was used to immobilize the head without causing discomfort. The scanner alignment light was used to adjust the head tilt and rotation so that the axial plane lights passed across the cantho-meatal line and the sagittal lights were aligned with the center of the nose. A rapid sagittal localizer scan was acquired to confirm the alignment.
2.2.1. MRI for lesion and brain-abnormality assessment
The first set of images were obtained with an axial, multisection, T1-weighted pulse sequence (TR = 500 ms, TE = 15 ms) with a 256 × 192 data acquisition matrix, 5-mm section thickness, a 20-cm field-of-view (FOV), 1 excitation per phase-encoding increment (1 Nex) and a 32 KHz (±16 KHz) full imaging bandwidth. This was followed by a long TR (2500 msec), double-echo (TE = 30 and 80 msec) spin-echo data-acquisition sequence using the same FOV, section thickness, bandwidth and spacing, 256 × 192 data acquisition matrix, and 1 Nex. Saturation of spins outside the imaging volume (standard gap 15 mm) and flow compensation (gradient moment nulling) was employed to eliminate artifacts due to flowing blood and cerebrospinal fluid. These images were obtained in two separate acquisitions with a 5-mm gap between sections for each acquisition. The second acquisition was offset by 5 mm from the first so that the resulting data set consisted of contiguous sections.
2.2.2. High-resolution imaging for volume measurements
Two sets of dual-echo fast spin-echo (FSE) acquisitions were obtained: one in the axial plane for morphometry of most cerebral structures and (for a subset of patients) a second in a coronal oblique plane for morphometry of the hippocampus. The pulse sequence parameters were TR = 4000 ms, TE = 30, 135 ms, 32 KHz (±16 KHz) full imaging bandwidth, echo train length = 16, a 256 × 256 matrix, 3-mm section thickness, 1 Nex and a 20-cm FOV. The images were acquired in two separate acquisitions with a 3-mm gap between sections for each acquisition. The second acquisition was offset by 3 mm from the first so that the resulting data set consisted of contiguous sections. For the near coronal acquisition, the localizer scan was used to identify the anterior commissure-posterior commissure (AC-PC) line. Oblique, near-coronal images were prescribed perpendicular to this line, covering the entire brain from just anterior of the temporal lobe to a plane posterior to the lateral ventricles.
2.3. MR image processing for brain volumes
The MR images were transferred to our laboratory for processing on SUN workstations, and secondary archive. Two computer programs were used to make volume measurements. Putamenal and hippocampal volumes were determined using the GRID Program which was developed in-house. All other volume measurements used a locally-modified version of MrX Software, which was created by GE Corporate Research and Development (Schenectady, NY) and originally modified by Brigham and Women's Hospital for image segmentation (Boston, MA).
2.3.1. MrX procedures (for whole brain, cerebral hemispheres, caudate, lateral ventricles, and gray and white matter lesions)
The segmentation protocol used was a modified version of that developed by Kikinis and colleagues [30] and Byrum and colleagues [6]. This was a supervised, semiautomated method that used the multiple MR contrasts available to identify different tissue classifications through a ‘seeding’ process wherein a trained analyst manually selected pixels in each tissue type that was to be identified (gray matter, white matter, CSF, lesions, background).
Once the brain was segmented into tissue types and the non-brain tissue stripped away through a masking procedure, specific regions of interest (ROI) were assessed using tracing and connectivity functions. The final step was to run a summarizing program that calculated the volume of each tissue type within the specific ROI defined by the analyst [42].
2.3.2. GRID procedures (for putamen and hippocampus)
The GRID Program allowed for semi-automated determination of ROI volumes and was based upon a manual point-counting method [36, 53]. A combination of tissue classification with manual tracing allowed for rapid determination of ROI volumes.
Tracing of the putamen began on the most inferior slice on which the putamen was separable from the caudate. Hyperintensities were included if they appeared within the body of the putamen; they were excluded if they appeared along the border. The globus pallidus and the claustrum were both excluded. If the lateral border of the putamen appeared to be fused with the insular cortex, the most posterior point at which they were separable was connected to the most anterior point at which they were separable. The superior border of the putamen was defined as the most superior slice on which it was visible. If motion, poor contrast, or other factors rendered any one slice unreadable, the subject was excluded from analysis.
We measured the hippocampus using existing methods [53].
2.3.3. Training and reliability
All image analysis technicians received extensive training by experienced analysts. Reliability was established by repeated measurements on multiple MR scans before raters were approved to process study data. Intraclass correlation coefficients were as follows: total brain = 0.998, left cerebral hemisphere = 0.996, right cerebral hemisphere = 0.997, left lateral ventricle = 0.988, right lateral ventricle = 0.991, total cerebrum = 0.997, left hippocampus = 0.8, right hippocampus = 0.9, left caudate = 0.9, right caudate = 0.9, left putamen = 0.8, right putamen = 0.7, left cerebral gray matter lesions = 0.995, right cerebral gray matter lesions = 0.996, left cerebral white matter lesions = 0.988, and right cerebral white matter lesions = 0.994.
2.4. Statistical analysis
We conducted multivariate, mixed-model and regression analyses using the SAS 8.1 software package for PCs (SAS Institute, Cary, NC). We recentered the age and education variables about their respective means. White-matter lesion volumes were log-transformed to adjust for non-normality; the distribution of all other volumes was sufficiently close to normal to allow for analysis without transformation.
We began by conducting a power analysis to determine the magnitude of effects we could detect given our sample size [51]. For age, previous studies have reported an effect size of approximately r = 0.3, with a range from 0.19 to 0.57 depending on the structure being measured (see [44] for a review). For most of these analyses, we have 140 participants. This sample size provides a power of 0.85 to detect an effect size of 0.3 at an alpha level of 0.01. For the analysis of the hippocampus, we have 82 participants, which provides a power of 0.87 to detect a correlation of 0.4 or greater, again at an alpha level of 0.01. Therefore, our sample size has sufficient statistical power to detect moderate effects of age on brain volumes.
Researchers currently disagree on the most useful way to analyze brain volume data. Some researchers use structure volume as the dependent variable, while others use volume ratios; some advocate using intracranial volume (ICV) as a covariate, while others do not. We conducted analyses on age and gender using each of these methods, and report them all in order to facilitate comparisons (see [3, 4 for similar approaches).
3. Results
3.1. Demographics and group differences
Table 1 presents the demographics of our sample and the number of scans that were available for each brain structure. Independent-samples t tests (two-tailed) showed that there were no significant differences in education or age between males and females, and effect sizes as measured by ω2 were minimal. (For age, t(1,138) = -0.69, p<0.49, ω2 = 0.003; for education, t(1,138) = 1.44, p<0.15, ω2 = 0.01.)
Table 1.
Demographics
| Overall | Men | Women | |
|---|---|---|---|
| N | 140 | 39 | 101 |
| Putamen (n) | 138 | 38 | 99 |
| Hippocampus (n) | 82 | 16 | 66 |
| All other volumes (n) | 140 | 39 | 101 |
| Age | |||
| Mean±SD | 71±6 | 70±6 | 71±6 |
| Range | 60-85 | 62-85 | 60-83 |
| Between 60-69 (n) | 63 | 21 | 42 |
| Between 70-79 (n) | 65 | 14 | 51 |
| 80+ (n) | 12 | 4 | 8 |
| Education (mean±SD) | 15±2 | 16±2 | 15±2 |
| Race (n) | |||
| White | 115 | 29 | 86 |
| Black | 23 | 9 | 14 |
| Other | 2 | 1 | 1 |
SD=standard deviation.
3.2. Analysis 1: laterality
We tested for hemispheric differences in brain volumes using a mixed-models approach. Structure volume was the dependent variable; age and gender were entered as independent variables, and hemisphere was treated as a repeated measure. For the age × hemisphere, gender × age, and age × hemisphere × gender interactions, two of the interactions for ventricular CSF just missed significance (age × gender × hemisphere: F[1,136]=5.11, p < 0.0254; gender × age: F[1,136]=3.37, p < 0.0687) but all others were not near significance (all F < 2.03; all p > 0.1569). Significant hemispheric differences were observed for the gray matter, the white matter, and the caudate; significant hemisphere × gender interactions were observed for the gray matter and the white matter (see Table 2). The left caudate was significantly larger than the right, and further analyses of the hemisphere × gender interaction revealed several relationships that were near statistical significance. In males, right gray matter was somewhat larger than left gray matter (F[1,38]= 6.92, p=0.0123), but in females, left gray matter was larger (F[1,100]=5.27, p < 0.0237). In males, left white matter was somewhat larger than right white matter (F[1,38]=7.24, p < 0.0105) but in females, right white matter was larger (F[1,100]=4.84, p < 0.0301). In Table 2, all results for hemisphere and the hemisphere × gender interaction are reported; the simple effects of gender are reported in Analysis 3.
Table 2.
Laterality Differences
| Vol. (mean ± SD) | Hemisphere | Hemisphere × gender | ||||
|---|---|---|---|---|---|---|
| Structure | Left | Right | F | p | F | p |
| Gray matter | 241.84 ± 32.56 | 241.91 ± 34.34 | 11.45 | 0.0009 | 15.38 | 0.0001 |
| White matter | 186.70 ± 36.65 | 186.43 ± 33.24 | 12.08 | 0.0007 | 15.46 | 0.0001 |
| Parenchyma | 428.54 ± 50.04 | 428.34 ± 49.56 | 0.28 | 0.5993 | 0.21 | 0.6507 |
| Ventricular CSF | 16.73 ± 8.24 | 15.32 ± 7.09 | 5.31 | 0.0228 | 0.44 | 0.5083 |
| Nonventricular CSF | 121.40 ± 31.17 | 118.95 ± 32.26 | 2.02 | 0.1579 | 0.49 | 0.4836 |
| Lesions (log-transformed) | 0.23 ± 0.34 | 0.21 ± 0.34 | 5.71 | 0.0183 | 0.23 | 0.6293 |
| Caudate | 3.56 ± 0.64 | 3.82 ± 0.64 | 11.95 | 0.0007 | 0.61 | 0.4368 |
| Putamen | 3.56 ± 0.62 | 3.58 ± 0.67 | 0.00 | 0.9543 | 0.06 | 0.8148 |
| Hippocampus | 2.92 ± 0.45 | 3.09 ± 0.44 | 2.38 | 0.1267 | 0.00 | 0.9885 |
SD=standard deviation; CSF=cerebrospinal fluid.
The absence of age × hemisphere and age × gender × hemisphere interactions technically permit us to combine left and right structure volumes and perform analyses on total volumes instead. For the caudate, putamen, and hippocampus, however, we chose to analyze left and right volumes independently so that we could compare our results to those of previous studies, which have tended to use this strategy.
3.3. Analysis 2: effects of age
First, we calculated correlations between age and brain volumes, which are presented in Table 3. We also report beta weights, which in this case are estimates of the change in volume per year. Significant correlations were observed in all variables except the gray matter, right caudate, right putamen, and left hippocampus; aside from the gray matter, each of these variables just missed the threshold of statistical significance. We also used t tests to compare participants in their 60s to those in their 70s. These comparisons yielded essentially identical results, except that the left caudate was significant in the correlational analyses and not the decade-by-decade comparison.
Table 3.
Relations between age and brain volumes
| Age alone | Age with covariates | |||||||||
|---|---|---|---|---|---|---|---|---|---|---|
| Structure | Vol. (mean ± SD) | r | t | p | B | SE | t | p | B | SE |
| Gray matter | 483.75 ± 66.03 | -0.12 | -1.44 | 0.1509 | -1.34 | 0.92 | -2.13 | 0.0352 | -1.44 | 0.68 |
| White matter | 373.13 ± 68.99 | -0.34 | -4.23 | <0.0001 | -3.87 | 0.92 | -5.01 | <0.0001 | -3.69 | 0.74 |
| Parenchyma | 856.88 ± 99.36 | -0.32 | -3.92 | <0.0001 | -5.21 | 1.33 | -7.18 | <0.0001 | -5.13 | 0.72 |
| Ventricular CSF | 32.04 ± 15.07 | 0.39 | 4.93 | <0.0001 | 0.97 | 0.20 | 5.24 | <0.0001 | 0.95 | 0.18 |
| Nonventricular CSF | 240.35 ± 63.00 | 0.37 | 4.71 | <0.0001 | 3.89 | 0.83 | 5.63 | <0.0001 | 3.83 | 0.68 |
| Lesions (log-transformed) | 0.52 ± 0.34 | 0.45 | 5.97 | <0.0001 | 0.04 | <0.01 | 6.00 | <0.0001 | 0.03 | <0.01 |
| Left caudate | 3.56 ± 0.64 | -0.24 | -2.89 | 0.0045 | -0.03 | 0.01 | -3.02 | 0.0030 | -0.03 | 0.01 |
| Right caudate | 3.82 ± 0.64 | -0.19 | -2.26 | 0.0254 | -0.02 | 0.01 | -2.58 | 0.0112 | -0.02 | 0.01 |
| Left putamen | 3.56 ± 0.62 | -0.37 | -4.66 | <0.0001 | -0.04 | 0.01 | -5.18 | <0.0001 | -0.04 | 0.01 |
| Right putamen | 3.58 ± 0.67 | -0.22 | -2.57 | 0.0112 | -0.02 | 0.01 | -3.01 | 0.0031 | -0.03 | 0.01 |
| Left hippocampus | 2.92 ± 0.45 | -0.27 | -2.48 | 0.0151 | -0.02 | 0.01 | -1.98 | 0.0510 | -0.02 | 0.01 |
| Right hippocampus | 3.09 ± 0.44 | -0.36 | -3.44 | 0.0009 | -0.03 | 0.01 | -3.11 | 0.0026 | -0.02 | 0.01 |
SD=standard deviation; CSF=cerebrospinal fluid; SE=standard error.
Second, we conducted a set of regression analyses that used structure volumes as dependent variables. We covaried for ICV, education, and gender by entering them into the regression equation first. Next, the recentered age variable was entered; finally, the square of the recentered age variable was entered so that we could test for a quadratic trend. The quadratic term was never significant (all |t| < 2.5; all p > 0.01), so we recalculated the model without this term. Table 3 presents the results of this analysis, and Figures 1-11 plot the data for all structures measured. Significant associations between age and volume were observed in all variables except the total gray matter, the right caudate, and the left hippocampus.
Figures 1-11.

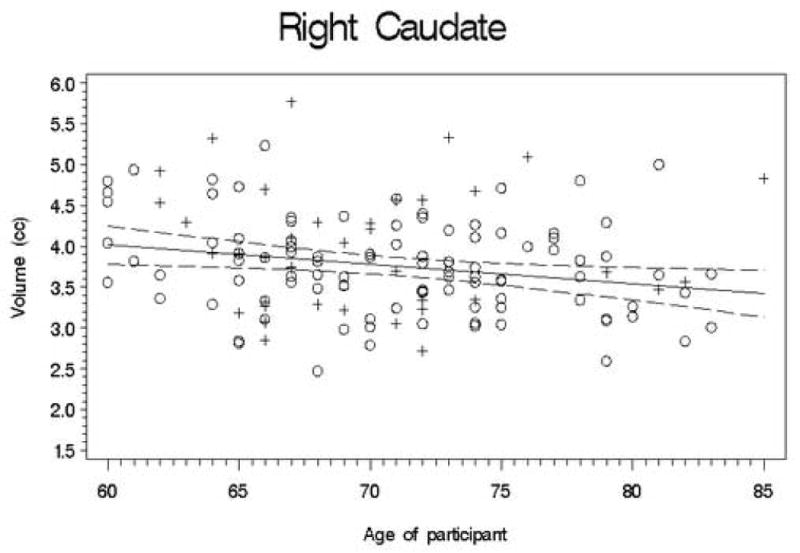
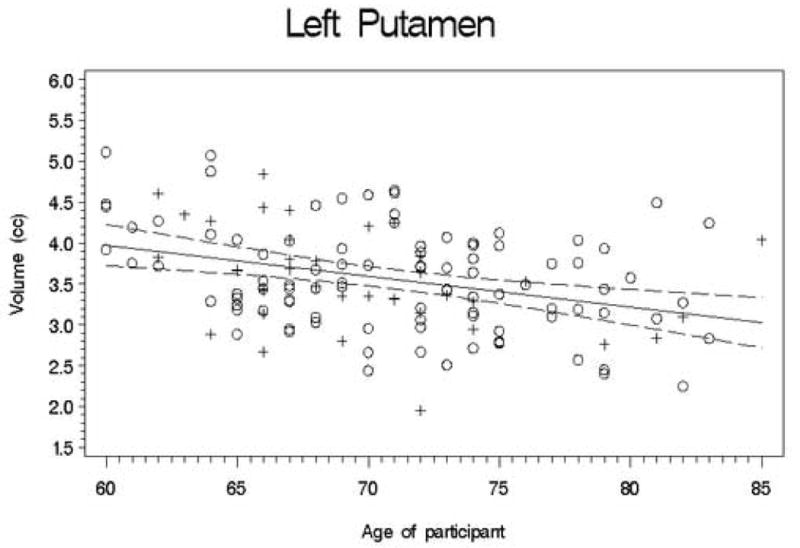


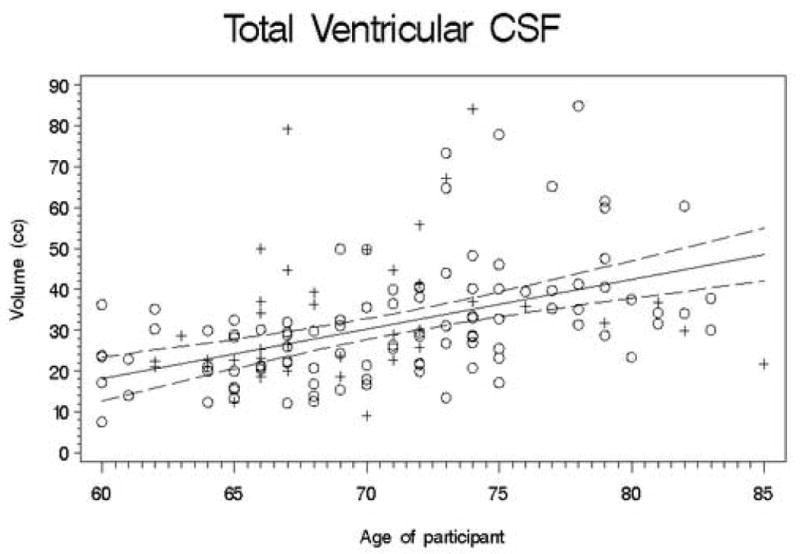
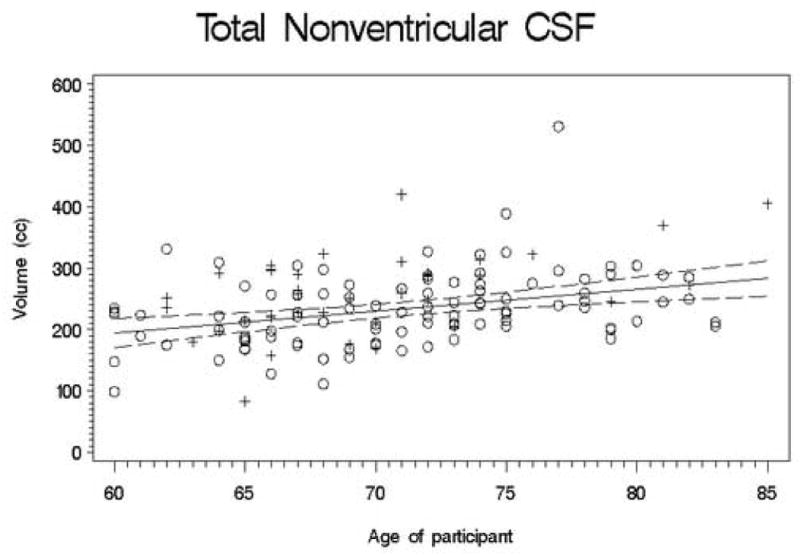
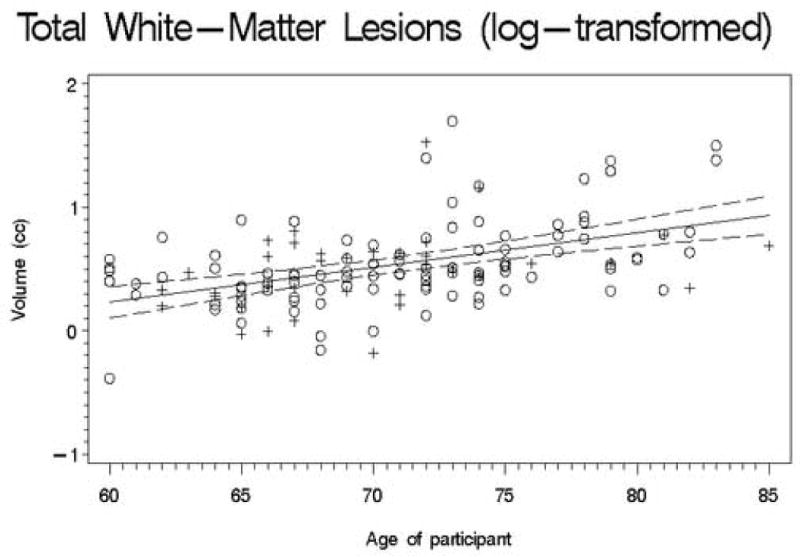
Scatterplots of the unadjusted volumes of brain structures vs. age. Crosses indicate males and circles indicate females. The solid line indicates the regression line for all participants; dotted lines indicate 95% confidence intervals.
Third, we conducted analyses using volume ratios instead of structure volumes. These ratios were calculated by dividing the structure volume by the ICV, then multiplying by 100; thus, they represent percentages of the ICV. As in the previous analyses, education and gender were included as covariates, and a polynomial term was entered to test for a quadratic effect. Once again, the polynomial term was never significant (all |t| < 2.5; all p > 0.01) and we recalculated the models without this term. The results are presented in Table 4. Note that in this case, we report transformed beta weights. In these analyses, the usual calculation of beta weights would provide estimates of the change per year in volume ratios, not in the absolute volume. To make these figures comparable to those in the last two analyses, we transformed these weights (and their standard errors) by multiplying them by the mean ICV, then dividing by 100. In this analysis, a significant association between age and volume ratio was observed in all variables except the gray matter and the left hippocampus. Again, decade-by-decade comparisons yielded similar results, except that the right putamen ratio and right hippocampus ratio were not significant.
Table 4.
Effects of Age on Volume Ratios (with education and gender as covariates)
| Age | |||||
|---|---|---|---|---|---|
| Structure | Ratio (mean ± SD) | t | p | B | SE |
| Gray matter | 43.70 ± 4.31 | -2.10 | 0.0378 | -1.38 | 0.66 |
| White matter | 32.93 ± 5.11 | -5.16 | <0.0001 | -3.76 | 0.74 |
| Parenchyma | 75.63 ± 5.19 | -7.30 | <0.0001 | -5.13 | 0.71 |
| Ventricular CSF | 2.81 ± 1.23 | 5.55 | <0.0001 | 0.98 | 0.18 |
| Nonventricular CSF | 0.78 ± 8.52 | 5.73 | <0.0001 | 3.79 | 0.67 |
| Lesions (log-transformed) | 0.03 ± 0.02 | 6.23 | <0.0001 | <0.01 | <0.01 |
| Left caudate | 0.32 ± 0.06 | -3.20 | 0.0017 | -0.02 | 0.01 |
| Right caudate | 0.34 ± 0.05 | -2.84 | 0.0052 | -0.02 | 0.01 |
| Left putamen | 0.32 ± 0.06 | -5.04 | <0.0001 | -0.03 | 0.01 |
| Right putamen | 0.32 ± 0.06 | -3.11 | 0.0023 | -0.02 | 0.01 |
| Left hippocampus | 0.26 ± 0.04 | -1.69 | 0.0950 | -0.01 | 0.01 |
| Right hippocampus | 0.27 ± 0.04 | -2.75 | 0.0074 | -0.02 | 0.01 |
3.4. Analysis 3: gender differences
We first calculated t-tests to examine gender differences in uncorrected brain volumes; Table 5 presents the results of this analysis. In these analyses, the betas are simply equal to equivalent to difference between the means, and positive betas indicate larger values in women. As expected, men had larger ICVs than women (men=1234.530; women=1095.760; t=-7.22; p < 0.0001); however, the volumes of individual structures were not always larger in males. Males did have larger volumes of gray matter, white matter, total parenchyma, left hippocampus, and right hippocampus, but no significant differences were seen in the other comparisons. Therefore, as our second analysis, we conducted regression analyses. We began by entering ICV, education, and age into the model. We then entered the gender variable (coded as men=0 and women=1). The results are also presented in Table 5. Positive betas indicate larger volumes in women after covariation. Females had larger volumes of gray matter, left putamen, and right putamen; males had larger volumes of white matter.
Table 5.
Gender Differences in Brain Volumes
| Volume (mean ± SD) | Gender alone | Gender with covariates | ||||||||
|---|---|---|---|---|---|---|---|---|---|---|
| Structure | Male | Female | t | p | B | SE | t | p | B | SE |
| Gray matter | 507.43 ± 66.26 | 474.60 ± 63.94 | -2.70 | 0.0079 | -32.82 | 12.18 | 2.54 | 0.0123 | 26.96 | 10.63 |
| White matter | 427.61 ± 74.73 | 352.10 ± 53.75 | -6.65 | <0.0001 | -75.52 | 11.36 | -3.69 | 0.0003 | -42.89 | 11.61 |
| Parenchyma | 935.04 ± 96.30 | 826.70 ± 83.05 | -6.61 | <0.0001 | -108.34 | 16.38 | -1.42 | 0.1590 | -15.94 | 11.25 |
| Ventricular CSF | 33.75 ± 16.45 | 31.38 ± 14.53 | -0.83 | 0.4056 | -2.37 | 2.84 | 1.54 | 0.1254 | 4.40 | 2.85 |
| Nonventricular CSF | 261.23 ± 66.11 | 232.28 ± 60.17 | -2.48 | 0.0142 | -28.95 | 11.66 | 0.87 | 0.3853 | 9.32 | 0.01 |
| Lesions (log-transformed) | 0.48 ± 0.31 | 0.54 ± 0.34 | 0.97 | 0.3359 | 0.06 | 0.06 | 2.56 | 0.0117 | 0.17 | 0.06 |
| Left caudate | 3.75 ± 0.73 | 3.49 ± 0.58 | -2.22 | 0.0279 | -0.26 | 0.12 | -0.02 | 0.9880 | -0.01 | 0.13 |
| Right caudate | 3.96 ± 0.75 | 3.76 ± 0.58 | -1.72 | 0.0884 | -0.20 | 0.12 | 1.33 | 0.1844 | 0.17 | 0.13 |
| Left putamen | 3.54 ± 0.62 | 3.56 ± 0.63 | 0.15 | 0.8839 | 0.02 | 0.12 | 2.85 | 0.0051 | 0.34 | 0.12 |
| Right putamen | 3.54 ± 0.76 | 3.59 ± 0.64 | 0.43 | 0.6688 | 0.06 | 0.13 | 3.21 | 0.0017 | 0.43 | 0.14 |
| Left hippocampus | 3.21 ± 0.52 | 2.85 ± 0.41 | -2.99 | 0.0037 | -0.36 | 0.12 | -1.26 | 0.2120 | -0.17 | 0.13 |
| Right hippocampus | 3.40 ± 0.44 | 3.01 ± 0.41 | -3.35 | 0.0012 | -0.39 | 0.12 | -0.82 | 0.4165 | -0.10 | 0.12 |
Third, we conducted analyses using the volume ratio as the dependent variable; we entered education and age into the equation as covariates, followed by the gender variable. We again report transformed beta weights. Table 6 presents the results of these analyses. Differences in ratios were significant for the white matter and the left and right putamen.
Table 6.
Gender Differences in Structure Ratios
| Ratio (mean ± SD) | Gender | |||||
|---|---|---|---|---|---|---|
| Structure | Male | Female | t | p | B | SE |
| Gray matter | 41.19 ± 4.70 | 43.29 ± 4.02 | 2.95 | 0.0037 | 26.23 | 8.96 |
| White matter | 34.68 ± 5.31 | 32.25 ± 4.90 | -2.61 | 0.0100 | -25.72 | 9.93 |
| Parenchyma | 75.87 ± 5.23 | 75.54 ± 5.19 | 0.05 | 0.9576 | 0.51 | 9.58 |
| Ventricular CSF | 2.70 ± 1.19 | 2.85 ± 1.24 | 0.53 | 0.5970 | -3.11 | 2.40 |
| Nonventricular CSF | 21.07 ± 4.83 | 21.12 ± 4.55 | -0.35 | 0.7285 | 1.41 | 9.02 |
| Lesions (log-transformed) | 0.04 ± 0.02 | 0.05 ± 0.03 | 1.72 | 0.0973 | 0.01 | <0.01 |
| Left caudate | 0.31 ± 0.06 | 0.32 ± 0.05 | 1.52 | 0.1312 | 0.17 | 0.11 |
| Right caudate | 0.32 ± 0.06 | 0.34 ± 0.05 | 2.34 | 0.0205 | 0.25 | 0.11 |
| Left putamen | 0.29 ± 0.05 | 0.33 ± 0.06 | 4.32 | <0.0001 | 0.45 | 0.11 |
| Right putamen | 0.29 ± 0.06 | 0.33 ± 0.06 | 4.21 | <0.0001 | 0.49 | 0.12 |
| Left hippocampus | 0.26 ± 0.04 | 0.26 ± 0.04 | 0.13 | 0.8965 | 0.02 | 0.13 |
| Right hippocampus | 0.28 ± 0.04 | 0.27 ± 0.04 | 0.34 | 0.7368 | 0.04 | 0.11 |
4. Discussion
The aging brain changes in many ways, some of which are thought to be lateralized or gender-dimorphic. To date, however, the results of previous studies have often been inconsistent. We sought to address these discrepancies by providing precise estimates of atrophy and applying multiple models to the data.
Overall, we replicated the common finding that, within an elderly population, brain parenchyma decreases with increasing age while CSF and lesion volumes increase. However, examination of specific structures yielded some unexpected findings. In our sample, parenchymal atrophy was attributable to white-matter decline, not gray-matter decline, and the white-matter decline was linear, not quadratic or cubic. Along the same lines, males did not generally have larger uncorrected volumes than females did, even though males had larger heads. We review these findings below and suggest some possible reasons for the differences among studies.
4.1. Laterality
Previous studies have generally reported that the right hemisphere is larger than the left [22, 45, 46, 59]. The source of this asymmetry is unclear. Our results cannot shed any light on this question, as we found no significant differences in parenchyma size.
4.1.1. Gray and white matter; CSF
We found no significant differences in CSF volumes. We did, however, find that there was more gray matter in the right hemisphere but more white matter in the left (see [48] for a similar result). Thus, the hemispheric asymmetries in gray and white matter may cancel each other out, resulting in no observable differences in overall parenchyma volume.
4.1.2. Subcortical structures and the hippocampus
Previous studies of asymmetries of the basal ganglia have been inconclusive. Some studies have reported a larger right caudate [27, 47]; others have reported a larger left caudate [20, 25]. Some studies report a larger right putamen [20], while others report a larger left putamen [25]. Left hippocampi tend to be larger than right hippocampi [7, 45, 54; see 56, 58 for exceptions]. In our study, we found that the right caudate was larger; however, we found no significant differences in the putamen or hippocampus.
4.1.3. Interactions with age and gender
Previous studies have reported that age-related atrophy is more severe in one hemisphere [49]; however, we found no such interaction in our study. We found a trend towards an interaction between gender and hemisphere.
4.2. Age
Age-related decrease in brain volume is well-documented. Brain weight begins to substantially decline in the 5th to 7th decade of life [26]. Several studies have estimated the rate of annual parenchymal decline, finding rates that range from 0.23% [7] to 0.4% per year [15]. Resnick and colleagues [49] reported a rate of decline of 5.4 cc/year. These estimates are generally consistent with our own estimate of parenchymal decline of about 5.1 cc per year, or 0.5%.
4.2.1. Gray matter
Total gray matter volumes decrease significantly with age, even within an elderly sample [2, 3, 8, 16, 18, 21, 28, 29, 33, 34, 41, 43, 45, 48, 49, 55, 57]. Some studies have reported nonlinear decline in gray-matter volume [1, 2, 45]. A decline in gray-matter volumes with age is one of the most consistent findings in MRI morphometry.
Nevertheless, our results supported neither our hypothesis nor these previous results; we found no significant linear or quadratic relation between total gray matter volumes and age. The reasons for this discrepant result are unclear. Differences in methods often bring about differences in results, yet our semiautomated segmentation method is not particularly unusual in this field, and the nearest-neighbor algorithm is not biased towards any particular tissue type. Moreover, to obscure a decline in gray matter with age, our method would have to systematically overestimate gray-matter volumes in older brains but not younger ones. A second possibility involves our sample, which consisted of well-educated and very healthy adults. Perhaps this sample was less likely to experience gray-matter decline; alternatively, perhaps our inclusion criteria led to selective dropout, such that participants with smaller gray-matter volumes were more likely to drop out because of neurological or cognitive difficulties. A third possibility involves white-matter lesions. Jernigan and colleagues [29] have noted that white-matter signal values generally shift towards (and beyond) the values for gray matter, resulting in white matter being misclassified as gray matter. In our semiautomated method, though, white matter hyperintensities were treated as a separate tissue type, so this confound seems unlikely.
4.2.2. White matter
Examinations of white-matter atrophy have generally reported decreases (often nonlinear) [2, 16, 23, 29, 33, 34, 45, 48, 49, 57], though some studies have reported increases [8, 21] or no changes at all [18, 28, 35, 41, 43, 55]. We observed an overall linear decrease in white matter of about 3.8 cc/yr, which is somewhat higher than most studies that report linear decreases [33, 49; see [34] for an exception]. Moreover, this decrease in white matter was coupled with an increase in gray matter, thus contradicting the previous findings that parenchymal atrophy is more attributable to gray-matter loss than white-matter loss (though see [24] for for results in accord with our own).
Raz [44] has suggested that a limitation of MRI volumetry may account for the discrepancies across studies. Specifically, myelinated axons from the outer cortical layers pass through the inner cortical layers on their way to other destinations in the brain. If the cell bodies in an inner cortical layer shrink while the axons remain unchanged, then that region will appear more like white matter, even though functional cell bodies are still present [44]. Thus, gray-matter atrophy may produce an apparent increase in white-matter volume depending on the method that is used to measure it. Still, our method seems just as likely as any other to be susceptible to this confound, yet we observed neither gray-matter atrophy nor white-matter expansion.
Discrepancies could also stem from the way we measured white-matter lesions. Most studies have used ratings instead of volumetric measures to assess lesions, and it is often unclear whether they count lesions as part of white matter, gray matter, CSF, or something else entirely. Our separation of white-matter lesions from white matter could account for the differences between this and other studies. To examine this possibility, we summed the white-matter and white-matter lesion volumes and recalculated the models. The results were not substantially different; the Bs differed by a few tenths of a cc, ts differed by a few tenths, and the pattern of significance levels was the same. Thus, the source of this difference across studies remains unclear.
4.2.3. Cerebrospinal fluid
The decrease in brain parenchyma volume is associated with an increase in CSF volume, which is also well-documented. One study estimated that overall CSF volume increased by 3.6 cc/yr (33), while another estimated annual declines of 1.9 cc/yr [18]. Other studies have broken down CSF into ventricular and nonventricular components. Studies of ventricular CSF have reported increases of 0.3 ml/yr [43], 1.4 cc/yr (49), and 2.2 cc/yr (57). Studies of nonventricular CSF have reported increases of 0.6 ml/yr [43]. Our analyses of elderly participants yielded larger estimates; we found that nonventricular CSF increased by 3.8 cc/yr, while ventricular CSF increased by 0.9 cc/yr.
4.2.4. White-matter lesions
The increase in cerebrospinal fluid does not entirely account for the decrease in gray and white matter volumes; some brain tissue, particularly in the periventricular white matter, changes from healthy parenchyma to lesion. One previous study, which estimated volumes from rating scales, found that white-matter lesions grow more frequent with age by about 0.2 cc/yr [12]. Similarly, our volumetric calculations showed that white-matter lesions were larger in older participants.
4.2.5. Subcortical and allocortical structures
Previous studies have shown that age-related volume decreases in the basal ganglia begin at age 60 [1]. The caudate shrinks by about 3.3% per decade [20]; the putamen has been reported to atrophy at 3.6% per decade [20] or 40 mm3 per year [52], and one study has found a cubic rate of decline [57]. We found that the caudate shrank by about 0.02cc/yr (0.7%), a bit more quickly than Gunning-Dixon and colleagues' estimate. Along the same lines, we found that the putamen shrank by about 0.03 cc/yr (1%), again more rapidly than Gunning-Dixon and colleagues reported but more slowly than Schulz and colleagues reported. The hippocampus has been reported to decrease by 0.30% per year [7], 1-2% per year [13], or 2% per decade [45]; one study used a bi-linear fit model to show that the hippocampus shrank at 6.4% per decade in adults over 50 [46]. One study reported that a quadratic model best fit the data [57], while another reported that a cubic model was best [2]. We found a slightly more rapid rate of linear decline in our elderly sample, estimating that the hippocampus shrinks by 0.02 cc/yr (0.7%).
4.3. Gender differences
4.3.1. Correlational analysis
One might expect these analyses to show that men have larger volumes than women, given that the correlational analysis does not correct for head size and that men have larger heads on average than women do. Contrary to expectations, however, the caudate, putamen, white-matter lesions, and cerebrospinal fluid were not significantly larger in men (see 16, for a similar finding in white-matter volumes). The caudate did exhibit a trend in the expected direction, but the putamen was actually slightly larger in women (although this difference only amounts to a few hundredths of a cubic centimeter and is nowhere near statistical significance). Similarly, ventricular CSF showed a very weak trend in the expected direction; however, nonventricular CSF was larger in women, and in this case the difference technically fell just short of statistical significance. Although these results suggest that CSF formed a larger proportion of the intracranial contents in females than in males, this possibility was not borne out by the ratio analyses (to which we return later in this section). Some researchers have suggested that absence of differences between males and females may be attributable to different rates of atrophy; that is, if male brains start out larger than female brains but shrink more rapidly, they may eventually “catch up” with their female counterparts [5, 38]. Our study offered no support for this idea, as we found no gender differences in rates of atrophy; however, our study only used adults over the age of 60, so we cannot tell if atrophy at earlier ages had progressed at different rates.
4.3.2. Covariational analysis
The apparent relations between gender and brain volumes change substantially after covarying for the volume of the intracranial contents. If all else were equal, one would expect to find that volumes did not differ between the genders, though in practice results have been mixed (e. g. [19]). In our data set, no significant differences were observed in the caudate, hippocampus, lesions, cerebrospinal fluid, or parenchyma. The latter result, however, obscures an important difference between the sexes: Males had significantly more white matter than females did. Females had more gray matter than males, but this trend just missed statistical significance. In addition, females had a larger left and right putamen.
4.3.3. Ratio analyses
The ratio analyses help to clarify the gender differences in gray and white matter volumes. Gray matter made up a larger percentage of the ICV in females (43% vs. 41%), but white matter comprised a larger percentage of the ICV in males (35% vs. 32%); the parenchymal ratios did not differ. This difference could conceivably stem from limitations of MRI volumetry; as we noted previously, Raz [44] has suggested that atrophy of cell bodies in the gray matter may produce an apparent increase in white matter. Thus, if the cell bodies of males were shrinking more rapidly than that of females, one might well observe larger gray-matter proportions in women, but larger white-matter proportions in men. Still, this explanation seems unlikely, given that rates of atrophy were the same in men and women.
4.3.4. Interactions with age
Many studies report that age-related changes are gender-dimorphic. In general, men fare worse in aging than women do: male CSF volumes tend to increase more rapidly [5, 22; but see 18], and male parenchyma tend to shrink more quickly [5, 7, 18, 38, 59], as do noncortical structures [46, 47]. Moreover, atrophy may begin earlier in males [7]. There have, however, been several exceptions [2, 7, 16, 26, 28, 33, 49, 50]. Two studies reported that in males, the age-related decline in caudate volumes was significantly greater for the left caudate, but for females the rate of decline was steeper (although not by as much) for the right caudate [20, 38]. In our study, however, we found no interactions between age and gender, a result in accord with some earlier studies. As Raz and colleagues [46] have observed, however, this conclusion comes with a caveat. Males may be more vulnerable to the neurological and psychiatric conditions that served as exclusion factors for our study. Thus, our sample of males may be less representative than our sample of females.
5. Conclusions
There has been substantial debate over the most useful way to measure differences in brain volumes. Many researchers choose to correct for variation in head size by controlling for the intracranial volume (ICV) or another similar measure. Some researchers use this measure to calculate structure ratios, which are then used as the dependent variable [e. g. 1]; others use it as a covariate in an analysis of covariance or multiple regression analysis [22]. Raz and colleagues [45] argued that the use of head size as a covariate results in an underestimate of the actual brain variance, thereby inflating Type II error and potentially obscuring real differences. Bigler and colleagues [2; see also 3] noted the debate on this issue, and chose to report results for uncorrected and corrected volumes.
Our results provide a way to address this debate over analysis techniques because we analyzed our age and gender data using three separate methods: a correlational analysis, in which we calculated correlations between the regions of interest and the independent variables without any covariates; a covariational analysis, in which we covaried for ICV and other relevant variables; and a ratio analysis, in which our dependent variable was the region-of-interest volume divided by the ICV.
For the examination of the effects of age on brain volumes, the three methods yielded virtually identical results, which was not what we had expected given the current debate over analysis strategies. As shown in Tables 2, 3, and 4, the only major differences across analysis methods were seen in the right caudate (significant in the ratio analysis, but not in the others), and the right putamen (significant in the ratio and covariational analyses, but not in the correlational analysis). Even these differences are minimal (the p-values for the non-significant results are quite close to our chosen significance level of 0.01) and are attributable in part to differences in the degrees of freedom that arise from varying the numbers of covariates. Furthermore, the beta weights, which estimate the change in brain volume per year, differ only minimally across the three analyses. Therefore, the analysis strategy one uses can depend on how one wishes to view one's data: researchers who prefer volumes can use covariational or correlational analyses, while those who prefer percentages can use ratio analyses.
For the analysis of gender differences, the use of covariates does make a difference, which is to be expected given the regular and substantial differences in ICV between men and women. The covariational and ratio analyses are roughly similar, though not as similar as the age analyses; in particular, some of the beta weights differ substantially. Also, gray matter was significant in the ratio analysis, but just missed significance in the covariational analysis.
Our analyses have several limitations. First, our sample consisted of adults 60 and older, which limits the conclusions we can draw about the aging process; we cannot generalize beyond this age range. Second, our sample had over twice as many females as males. This distribution is common in aging studies and arises because women live longer than men on average; nevertheless, it may skew our results. Third, our sample had on average received a college education, which is above the average for the population as a whole. Increased education is known to be protective; therefore, our results may underestimate the degree of neurodegeneration in the general population. Fourth, our sample was generally healthy and was free of neurodegenerative disorders; therefore, our results may not generalize to more heterogenous samples that more accurately represent the elderly population as a whole. Fifth, this is a cross-sectional study, and its estimates of annual rates of decline may be affected by cohort effects.
In this study, we used multiple regression to examine the relations between age, gender, and brain volumes. As with other statistical techniques, such as the analysis of covariance, multiple regression can be used to test whether two groups (say, men and women) have significantly different brain volumes; more importantly, however, it can also be used to estimate the amount by which they differ. These estimates have often been omitted from previous studies, which tended to examine differences in means, differences in ratios, or correlations between brain volumes and independent variables of interest.
The correlational analyses, covariational analyses, and ratio analyses yielded similar results, with one exception: the correlational analyses of gender dimorphisms differed from the covariational and ratio analyses—an unsurprising result given the substantial differences in ICV between men and women. Thus, for similar datasets, either the covariational or the ratio analyses could be used—indeed, one could use both, as they provide different ways of visualizing the same dataset. In some cases, however, one model may be superior to the other; since ICV necessarily contains the independent variable of interest, a simultaneity bias may make covariational analyses problematic. In other cases, the fitting of multiple models can help illuminate the factors that affect variability within a particular dataset.
Acknowledgments
The authors would like to thank Tim Blitchington for the development of the GRID program, Dr. Chris Byrum for assistance in developing neuroanatomical guidelines, and Dr. Carl Pieper for statistical advice.
This study was supported by NIMH grants P50 MH60451, P30 MH40159, R01 MH54846, and K07 MH01367.
Footnotes
Disclosure Statement: The authors hereby declare that they have no current, past, or anticipated conflicts of interest, whether real or potential. All research with human participants was reviewed and approved by the Duke University Institutional Review Board, and informed consent was obtained for all participants.
Publisher's Disclaimer: This is a PDF file of an unedited manuscript that has been accepted for publication. As a service to our customers we are providing this early version of the manuscript. The manuscript will undergo copyediting, typesetting, and review of the resulting proof before it is published in its final citable form. Please note that during the production process errors may be discovered which could affect the content, and all legal disclaimers that apply to the journal pertain.
References
- 1.Akiyama H, Meyer JS, Mortel KF, Terayama Y, Thornby JI, Konno S. Normal human aging: factors contributing to cerebral atrophy. J Neurol Sci. 1997;152:39–49. doi: 10.1016/s0022-510x(97)00141-x. [DOI] [PubMed] [Google Scholar]
- 2.Allen J, Bruss J, Brown CK, Damasio H. Normal neuroanatomical variation due to age: The major lobes and a parcellation of the temporal region. Neurobiol Aging. 2005;26:1245–60. doi: 10.1016/j.neurobiolaging.2005.05.023. [DOI] [PubMed] [Google Scholar]
- 3.Bigler ED, Johnson SC, Anderson CV, Blatter DD, Gale SD, Russo AA, Ryser DK, Macnamara SE, Bailey BJ, Hopkins RO, Abildskov TJ. Traumatic brain injury and memory: the role of hippocampal atrophy. Neuropsychology. 1996;10:333–42. [Google Scholar]
- 4.Bigler ED, Neeley ES, Miller MJ, Tate DF, Rice SA, Cleavinger H, Wolfson L, Tschanz J, Welsh-Bohmer K. Cerebral volume loss, cognitive deficit and neuropsychological performance: Comparative measures of brain atropy: I. Dementia. Journal of the International Neuropsychological Society. 2004;10:442–52. doi: 10.1017/S1355617704103111. [DOI] [PubMed] [Google Scholar]
- 5.Blatter DD, Bigler ED, Gale SD, Johnson SC, Anderson CV, Burnett BM, Parker N, Kurth S, Horn SD. Quantitative volumetric analysis of brain MR: normative database spanning 5 decades of life. AJNR Am J Neuroradiol. 1995;16:241–51. [PMC free article] [PubMed] [Google Scholar]
- 6.Byrum CE, MacFall JR, Charles HC, Chitilla VR, Boyko OB, Upchurch L, Smith JS, Rajagopalan P, Passe T, Kim D, Xanthakos S, Krishnan KR. Accuracy and reproducibility of brain and tissue volumes using a magnetic resonance segmentation method. Psychiatry Res. 1996;67:215–34. doi: 10.1016/0925-4927(96)02790-4. [DOI] [PubMed] [Google Scholar]
- 7.Coffey CE, Lucke JF, Saxton JA, Ratcliffe G, Unitas LJ, Billig B, Bryan RN. Sex differences in brain aging: a quantitative magnetic resonance imaging study. Arch Neurol. 1998;55:169–79. doi: 10.1001/archneur.55.2.169. [DOI] [PubMed] [Google Scholar]
- 8.Cohen G, Andreasen NC, Alliger R, Arndt S, Kuan J, Yuh WT, Ehrhardt J. Segmentation techniques for the classification of brain tissue using magnetic resonance imaging. Psychiatry Res. 1992;45:33–51. doi: 10.1016/0925-4927(92)90012-s. [DOI] [PubMed] [Google Scholar]
- 9.Cohen J, Cohen P. Applied multiple regression/correlation analysis for the behavioral sciences. New York: Lawrence Erlbaum Associates; 1984. [Google Scholar]
- 10.Convit A, de Leon MJ, Hoptman MJ, Tarshish C, De Santi S, Rusinek H. Age-related changes in brain: I. Magnetic resonance imaging measures of temporal lobe volumes in normal subjects. Psychiatr Q. 1995;66:343–55. doi: 10.1007/BF02238754. [DOI] [PubMed] [Google Scholar]
- 11.Cowell PE, Turetsky BI, Gur RC, Grossman RI, Shtasel DL, Gur RE. Sex differences in aging of the human frontal and temporal lobes. J Neurosci. 1994;14:4748–55. doi: 10.1523/JNEUROSCI.14-08-04748.1994. [DOI] [PMC free article] [PubMed] [Google Scholar]
- 12.de Leeuw FE, de Groot JC, Achten E, Oudkerk M, Ramos LM, Heijboer R, Hofman A, Jolles J, van Gijn J, Breteler MM. Prevalence of cerebral white matter lesions in elderly people: a population-based magnetic resonance imaging study. The Rotterdam Scan study. J Neurol Neurosurg Psychiatry. 2001;70:9–14. doi: 10.1136/jnnp.70.1.9. [DOI] [PMC free article] [PubMed] [Google Scholar]
- 13.Du AT, Schuff N, Chao LL, Kornak J, Jagust WJ, Kramer JH, Reed BR, Miller BL, Norman D, Chui HC, Weiner MW. Age-effects on atrophy rates of entorhinal cortex and hippocampus. Neurobiol Aging. 2006;27:733–40. doi: 10.1016/j.neurobiolaging.2005.03.021. [DOI] [PMC free article] [PubMed] [Google Scholar]
- 14.Doraiswamy PM, Patterson L, Na C, Husain MM, Boyko O, McDonald WM, Krishnan KRR. Bicaudate index on magnetic resonance imaging: effects of normal aging. J Geriatr Psychiatry Neurol. 1994;7:13–7. [PubMed] [Google Scholar]
- 15.Enzinger C, Fazekas F, Matthews PM, Ropele S, Schmidt H, Smith S, Schmidt R. Risk factors for progression of brain atrophy in aging: Six-year follow-up of normal subjects. Neurology. 2005;64:1704–11. doi: 10.1212/01.WNL.0000161871.83614.BB. [DOI] [PubMed] [Google Scholar]
- 16.Ge Y, Grossman RI, Babb JS, Rabin ML, Mannon LJ, Kolson D. Age-related total gray matter and white matter changes in normal adult brain. Part I: volumetric MR imaging analysis. AJNR Am J Neuroradiol. 2002;23:1327–33. [PMC free article] [PubMed] [Google Scholar]
- 17.Golomb J, de Leon MJ, Kluger A, George AE, Tarshish C, Ferris SH. Hippocampal atrophy in normal aging. An association with recent memory impairment. Arch Neurol. 1993;50:967–73. doi: 10.1001/archneur.1993.00540090066012. [DOI] [PubMed] [Google Scholar]
- 18.Good CD, Johnsrude IS, Ashburner J, Henson RNA, Friston CJ, Frackowiak RSJ. A voxel-based morphometric study of ageing in 465 normal adult human brains. Neuroimage. 2001a;14:21–36. doi: 10.1006/nimg.2001.0786. [DOI] [PubMed] [Google Scholar]
- 19.Good CD, Johnsrude I, Ashburner J, Henson RNA, Friston KJ, Frackowiak RSJ. Cerebral asymmetry and the effects of sex and handedness on brain structure: a voxel-based morphometric analysis of 465 normal adult human brains. NeuroImage. 2001b;14:685–700. doi: 10.1006/nimg.2001.0857. [DOI] [PubMed] [Google Scholar]
- 20.Gunning-Dixon FM, Head D, McQuain J, Acker JD, Raz N. Differential aging of the human striatum: a prospective MR imaging study. AJNR Am J Neuroradiol. 1998;19:1501–7. [PMC free article] [PubMed] [Google Scholar]
- 21.Gur RC, Gunning-Dixon FM, Turetsky BI, Bilker WB, Gur RE. Brain region and sex differences in age association with brain volume: a quantitative MRI study of healthy young adults. Am J Geriatr Psychiatry. 2002;10:72–80. [PubMed] [Google Scholar]
- 22.Gur RC, Mozley PD, Resnick SM, Gottlieb GE, Kohn MI, Zimmerman RA, Herman GT, Atlas SW, Grossman RI, Berretta D, Erwin RJ, Gur RE. Gender differences in age effect on brain atrophy measured by magnetic resonance imaging. Proc Natl Acad Sci U S A. 1991;88:2845–9. doi: 10.1073/pnas.88.7.2845. [DOI] [PMC free article] [PubMed] [Google Scholar]
- 23.Guttmann CR, Jolesz FA, Kikinis R, Killiany RJ, Moss MB, Sandor T, Albert MS. White matter changes with normal aging. Neurology. 1998;50:972–8. doi: 10.1212/wnl.50.4.972. [DOI] [PubMed] [Google Scholar]
- 24.Harris GJ, Schlaepfer TE, Peng LW, Lee S, Federman EB, Pearlson GD. Magnetic resonance imaging evaluation of the effects of ageing on grey- white ratio in the human brain. Neuropathol Appl Neurobiol. 1994;20:290–3. doi: 10.1111/j.1365-2990.1994.tb00971.x. [DOI] [PubMed] [Google Scholar]
- 25.Hokama H, Shenton ME, Nestor PG, Kikinis R, Levitt JJ, Metcalf D, Wible CG, O'Donnell BF, Jolesz FA, McCarley RW. Caudate, putamen, and globus pallidus volume in schizophrenia: a quantitative MRI study. Psychiatry Res. 1995;61:209–29. doi: 10.1016/0925-4927(95)02729-h. [DOI] [PubMed] [Google Scholar]
- 26.Hubbard BM, Anderson JM. Sex differences in age-related brain atrophy. Lancet. 1983;1(8339):1447–8. doi: 10.1016/s0140-6736(83)92397-8. [DOI] [PubMed] [Google Scholar]
- 27.Ifthikharuddin SF, Shrier DA, Numaguchi Y, Tang X, Ning R, Shibata DK, Kurlan R. MR volumetric analysis of the human basal ganglia: normative data. Acad Radiol. 2000;7:627–34. doi: 10.1016/s1076-6332(00)80579-6. [DOI] [PubMed] [Google Scholar]
- 28.Jernigan TL, Archibald SL, Berhow MT, Sowell ER, Foster DS, Hesselink JR. Cerebral structure on MRI, Part I: Localization of age-related changes. Biol Psychiatry. 1991;29:55–67. doi: 10.1016/0006-3223(91)90210-d. [DOI] [PubMed] [Google Scholar]
- 29.Jernigan TL, Archibald SL, Fennema-Notestine C, Gamst AC, Stout JC, Bonner J, Hesselink JR. Effects of age on tissues and regions of the cerebrum and cerebellum. Neurobiol Aging. 2001;22:581–94. doi: 10.1016/s0197-4580(01)00217-2. [DOI] [PubMed] [Google Scholar]
- 30.Kikinis R, Shenton ME, Gerig G, Martin J, Anderson M, Metcalf D, Guttman CR, McCarley RW, Lorensen W, Cline H, Jolesz FA. Routine quantitative analysis of brain and cerebrospinal fluid spaces with MR imaging. J Magn Reson Imaging. 1992;2:619–29. doi: 10.1002/jmri.1880020603. [DOI] [PubMed] [Google Scholar]
- 31.Krishnan KR, Husain MM, McDonald WM, Doraiswamy PM, Figiel GS, Boyko OB, Ellinwood EH, Nemeroff CB. In vivo stereological assessment of caudate volume in man: effect of normal aging. Life Sci. 1990;47:1325–9. doi: 10.1016/0024-3205(90)90196-x. [DOI] [PubMed] [Google Scholar]
- 32.Krishnan KR, McDonald WM, Escalona PR, Doraiswamy PM, Na C, Husain MM, Figiel GS, Boyko OB, Ellinwood EH, Nemeroff CB. Magnetic resonance imaging of the caudate nuclei in depression. Preliminary observations. Arch Gen Psychiatry. 1992;49:553–7. doi: 10.1001/archpsyc.1992.01820070047007. [DOI] [PubMed] [Google Scholar]
- 33.Lemaître H, Crivello F, Grassiot B, Alpérovitch A, Tzourio C, Bazoyer B. Age- and sex-related effects on the neuroanatomy of healthy elderly. NeuroImage. 2005;26:900–11. doi: 10.1016/j.neuroimage.2005.02.042. [DOI] [PubMed] [Google Scholar]
- 34.Liu RSN, Lemieux L, Bell GS, Sisodiya SM, Shorvon SD, Sander JWAS, Duncan JS. A longitudinal study of brain morphometrics using quantitative magnetic resonance imaging and difference image analysis. NeuroImage. 2003;20:22–33. doi: 10.1016/s1053-8119(03)00219-2. [DOI] [PubMed] [Google Scholar]
- 35.Lim KO, Zipursky RB, Watts MC, Pfefferbaum A. Decreased gray matter in normal aging: an in vivo magnetic resonance study. J Gerontol. 1992;47:B26–30. doi: 10.1093/geronj/47.1.b26. [DOI] [PubMed] [Google Scholar]
- 36.MacFall JR, Byrum CE, Parashos I, Early B, Charles HC, Chittilla V, Boyko OB, Upchurch L, Krishnan KR. Relative accuracy and reproducibility of regional MRI brain volumes for point-counting methods. Psychiatry Res. 1994;55:167–77. doi: 10.1016/0925-4927(94)90024-8. [DOI] [PubMed] [Google Scholar]
- 37.McDonald WM, Husain M, Doraiswamy PM, Figiel G, Boyko O, Krishnan KR. A magnetic resonance image study of age-related changes in human putamen nuclei. Neuroreport. 1991;2:57–60. doi: 10.1097/00001756-199101000-00014. [DOI] [PubMed] [Google Scholar]
- 38.Murphy DG, DeCarli C, McIntosh AR, Daly E, Mentis MJ, Pietrini P, Szczepanik J, Schapiro MB, Grady CL, Horwitz B, Rapoport SI. Sex differences in human brain morphometry and metabolism: an in vivo quantitative magnetic resonance imaging and positron emission tomography study on the effect of aging. Arch Gen Psychiatry. 1996;53:585–94. doi: 10.1001/archpsyc.1996.01830070031007. [DOI] [PubMed] [Google Scholar]
- 39.Murphy DG, DeCarli C, Schapiro MB, Rapoport SI, Horwitz B. Age-related differences in volumes of subcortical nuclei, brain matter, and cerebrospinal fluid in healthy men as measured with magnetic resonance imaging. Arch Neurol. 1992;49:839–45. doi: 10.1001/archneur.1992.00530320063013. [DOI] [PubMed] [Google Scholar]
- 40.Parashos IA, Tupler LA, Blitchington T, Krishnan KR. Magnetic-resonance morphometry in patients with major depression. Psychiatry Res. 1998;84:7–15. doi: 10.1016/s0925-4927(98)00042-0. [DOI] [PubMed] [Google Scholar]
- 41.Passe TJ, Rajagopalan P, Tupler LA, Byrum CE, MacFall JR, Krishnan KR. Age and sex effects on brain morphology. Prog Neuropsychopharmacol Biol Psychiatry. 1997;21:1231–7. doi: 10.1016/s0278-5846(97)00160-7. [DOI] [PubMed] [Google Scholar]
- 42.Payne ME, Fetzer DL, MacFall JR, Provenzale JM, Byrum CE, Krishnan KR. Development of a semi-automated method for quantification of MRI gray and white matter lesions in geriatric subjects. Psychiat Res: Neuroim. 2002;115:63–77. doi: 10.1016/s0925-4927(02)00009-4. [DOI] [PubMed] [Google Scholar]
- 43.Pfefferbaum A, Mathalon DH, Sullivan EV, Rawles JM, Zipursky RB, Lim KO. A quantitative magnetic resonance imaging study of changes in brain morphology from infancy to late adulthood. Arch Neurol. 1994;51:874–87. doi: 10.1001/archneur.1994.00540210046012. [DOI] [PubMed] [Google Scholar]
- 44.Raz N. Aging of the brain and its impact on cognitive performance: integration of structural and functional findings. In: Craik FIM, Salthouse TA, editors. Handbook of Aging and Cognition. Mahwah, NJ: Lawrence Erlbaum; 2000. pp. 1–90. [Google Scholar]
- 45.Raz N, Gunning FM, Head D, Dupuis JH, McQuain JM, Briggs SD, Thornton AE, Loken WJ, Acker JD. Selective aging of the human cerebral cortex observed in vivo: differential vulnerability of the prefrontal gray matter. Cereb Cortex. 1997;7:268–82. doi: 10.1093/cercor/7.3.268. [DOI] [PubMed] [Google Scholar]
- 46.Raz N, Gunning-Dixon F, Head D, Rodrigue KM, Williamson A, Acker JD. Aging, sexual dimorphism, and hemispheric asymmetry of the cerebral cortex: replicability of regional differences in volume. Neurobiol Aging. 2004;25:377–96. doi: 10.1016/S0197-4580(03)00118-0. [DOI] [PubMed] [Google Scholar]
- 47.Raz N, Torres IJ, Acker JD. Age, gender, and hemispheric differences in human striatum: a quantitative review and new data from in vivo MRI morphometry. Neurobiol Learn Mem. 1995;63:133–42. doi: 10.1006/nlme.1995.1013. [DOI] [PubMed] [Google Scholar]
- 48.Resnick SM, Goldszal AF, Davatzikos C, Golski S, Kraut MA, Metter EJ, Bryan RN, Zonderman AB. One-year age changes in MRI brain volumes in older adults. Cereb Cortex. 2000;10:464–72. doi: 10.1093/cercor/10.5.464. [DOI] [PubMed] [Google Scholar]
- 49.Resnick SM, Pham DL, Kraut MA, Zonderman AB, Davatzikos C. Longitudinal magnetic resonance imaging studies of older adults: A shrinking brain. J Neurosci. 2003;23:3295–3301. doi: 10.1523/JNEUROSCI.23-08-03295.2003. [DOI] [PMC free article] [PubMed] [Google Scholar]
- 50.Salat DH, Buckner RL, Snyder AZ, Greve DN, Desikan RSR, Busa E, Morris JC, Dale AM, Fischl B. Thinning of the cerebral cortex in aging. Cereb Cortex. 2004;14:721–30. doi: 10.1093/cercor/bhh032. [DOI] [PubMed] [Google Scholar]
- 51.Schmidt R, Hayn M, Fazekas F, Kapeller P, Esterbauer H. Magnetic resonance imaging white matter hyperintensities in clinically normal elderly individuals. Correlations with plasma concentrations of naturally occurring antioxidants. Stroke. 1996;27:2043–47. doi: 10.1161/01.str.27.11.2043. [DOI] [PubMed] [Google Scholar]
- 52.Schulz JB, Skalej M, Wedekind D, Luft AR, Abele M, Voigt K, Dichgans J, Klockgether T. Magnetic resonance imaging-based volumetry differentiates idiopathic Parkinson's syndrome from multiple system atrophy and progressive supranuclear palsy. Ann Neurol. 1996;45:65–74. [PubMed] [Google Scholar]
- 53.Steffens DC, Byrum CE, McQuoid DR, Greenberg DL, Payne ME, Blitchington TF, MacFall JR, Krishnan KR. Hippocampal volume in geriatric depression. Biol Psychiatry. 2000;48:301–9. doi: 10.1016/s0006-3223(00)00829-5. [DOI] [PubMed] [Google Scholar]
- 54.Szentkuti A, Guderian S, Schiltz K, Kaufmann J, Münte TF, Heinze HJ, Düzel E. Quantitative MR analyses of the hippocampus: Unspecific metabolic changes in aging. J Neurol. 2004;251:1345–53. doi: 10.1007/s00415-004-0540-y. [DOI] [PubMed] [Google Scholar]
- 55.Taki Y, Goto R, Evans A, Zijdenbos A, Neelin P, Lerch J, Sato K, Ono S, Kinomura S, Nakagawa M, Sugiura M, Watanabe J, Kawashima R, Fukuda H. Voxel-based morphometry of human brain with age and cerebrovascular risk factors. Neurobiol Aging. 2004;25:455–63. doi: 10.1016/j.neurobiolaging.2003.09.002. [DOI] [PubMed] [Google Scholar]
- 56.Van Petten C, Plante E, Davidson PSR, Kuo TY, Bajuscak L, Glisky EL. Memory and executive function in older adults: relationships with temporal and prefrontal gray matter volumes and white matter hyperintensities. Neuropsychologia. 2004;42:1313–35. doi: 10.1016/j.neuropsychologia.2004.02.009. [DOI] [PubMed] [Google Scholar]
- 57.Walhovd KB, Fjell AM, Reinvang I, Lundervold A, Dale AM, Eilertsen DE, Quinn BT, Salat D, Makris N, Fischl B. Effects of age on volumes of cortex, white matter and subcortical structures. Neurobiol Aging. 2005;26:1261–70. doi: 10.1016/j.neurobiolaging.2005.05.020. [DOI] [PubMed] [Google Scholar]
- 58.Wolf H, Hensel A, Kruggel F, Riedel-Heller SG, Arendt T, Wahlund LO, Gertz HJ. Structural correlates of mild cognitive impairment. Neurobiol Aging. 2004;25:913–24. doi: 10.1016/j.neurobiolaging.2003.08.006. [DOI] [PubMed] [Google Scholar]
- 59.Xu J, Kobayashi S, Yamaguchi S, Iijima K, Okada K, Yamashita K. Gender effects on age-related changes in brain structure. AJNR Am J Neuroradiol. 2000;21:112–8. [PMC free article] [PubMed] [Google Scholar]