

Abstract
In New England, groundwater arsenic occurrence has been linked to bedrock geology on regional scales. To ascertain and quantify this linkage at intermediate (100-101 km) scales, 790 groundwater samples from fractured bedrock aquifers in the greater Augusta, Maine area are analyzed. 31% of the sampled wells have arsenic >10 μg/L. The probability of [As] exceeding 10 μg/L mapped by indicator kriging is highest in Silurian pelite-sandstone and pelite-limestone units (~40%). This probability differs significantly (p<0.001) from those in the Silurian-Ordovician sandstone (24%), the Devonian granite (15%) and the Ordovician-Cambrian volcanic rocks (9%). The spatial pattern of groundwater arsenic distribution resembles the bedrock map. Thus, bedrock geology is associated with arsenic occurrence in fractured bedrock aquifers of the study area at intermediate scales relevant to water resources planning. The arsenic exceedance rate for each rock unit is considered robust because low, medium and high arsenic occurrences in 4 cluster areas (3-20 km2) with a low sampling density of 1-6 wells per km2 are comparable to those with a greater density of 5-42 wells per km2. About 12,000 people (21% of the population) in the greater Augusta area (~1135 km2) are at risk of exposure to >10 μg/L arsenic in groundwater.
Introduction
Widespread occurrence of geogenic arsenic (As) in groundwater in the world (1) is of great public health concern in the developing countries such as Bangladesh, India and China and the industrialized countries such as the United States of America. In the US, private wells, the source of drinking water for 16% of the US population mostly in rural areas (2), are not subjected to the same regulation as public water supplies with a requirement to meet a recently established drinking water Maximum Contaminant Level (MCL) of 10 μg/L for As by US EPA. As a consequence, people relying on private wells are expected to be subject to a greater risk of exposure to As. Because of the geogenic nature of As in groundwater (3), the linkage between geology and As occurrence needs to be better understood to manage the risk and to reduce exposure.
Large scale surveys of As in groundwater in the US (3, 4) have shown that geology influences As occurrence in groundwater in both unconsolidated sedimentary and bedrock aquifers on the regional scales of 102 km or greater despite strong spatial heterogeneity at very local scales of ≤10-1 km. The spatial pattern has been used for risk assessment. A compilation of As concentrations in 18,850 groundwater samples in the US (5) has identified high risk areas in the West (6-8) for alluvial, glacial and volcanic basin-fill sedimentary aquifers, parts of Midwest for glacial deposits, shale and sandstone aquifers (8, 9), and in the Northeast for fractured crystalline bedrock aquifers (4, 10, 11). To the best of our knowledge, the population at risk of As exposure in the West and the Midwest has not been assessed except in Michigan (12). Approximately 103,000 people in eastern New England were estimated to be at risk of exposure to >10 μg/L As from private water supplies based on a survey of 878 mostly public wells in the New England Coastal Basins of 59,600 km2 (13), where approximately 10% of groundwater samples had As concentrations exceeding 10 μg/L. The As problem is especially acute in New Hampshire (14) and Maine (15) where domestic drilled wells are used for drinking in about 30% of households (16), and where the probability of finding a well exceeding MCL of As is estimated to be high (17). In New Hampshire, 25% of the 474,606 households use domestic bedrock wells, and 12% of these wells are estimated to exceed the MCL using data from 2,273 wells from an area of 24,200 km2 (14). The analysis of several sets of groundwater As data indicated that 12%-13% of the bedrock wells had >10 μg/L As in Maine (18), which could subject as many as 160,000 people to risk. Because increased health risks have been attributed to chronic exposure to As in drinking water in New Hampshire (19), it is imperative that such risk be reduced in New England.
An uncertainty in risk assessment of As exposure in New England where about 877,000 housing units, 15.7% of the housing stock, rely on private wells for drinking (16) is whether the spatial distribution of As in groundwater at the intermediate scale of 100-101 km is entirely random or systematic. This is a relevant question because such knowledge is needed for outreach by government agencies, for remediation by homeowners, and for housing development planning by municipalities. Geochemical heterogeneity in fractured bedrock aquifers can be enormous (20). The complexity of water flow and chemical transport in fractured bedrock aquifers may result in entirely random spatial distribution of groundwater As at the scale of 100-101 km. Indeed, at the very local scale of ≤10-1 km, As distribution in fractured bedrock aquifers consisting of sulfidic schist with granitic to dioritic intrusions was largely affected by fracture characteristics, hydrogeology and water chemistry (21).
In order to examine to what extent the bedrock geology determines the probability of As occurrence in fractured bedrock aquifers at an intermediate scale of 100-101 km, groundwater samples from domestic bedrock wells in the greater Augusta, Maine area were collected and analyzed in 2006 and 2007. Geostatistical analyses were performed to illustrate the difference of As occurrence rates in the major bedrock units of the study area. Finally, the population at risk of high As exposure is estimated using a Geographic Information System analysis. Our results provide the basis to further investigate the source and mobilization mechanisms of As in the fractured bedrock aquifer of the greater Augusta area, and have implications on water resources management and planning in New England, and regions where drinking water are drawn from aquifers of meta-sedimentary bedrock formed under similar tectonic settings.
Materials and Methods
Study Area
Regional studies of As occurrence in groundwater in New England have identified a number of units with calcareous and calc-silicate lithogeochemistry (4) that span from central Massachusetts, southeastern New Hampshire to eastern Maine and have greater probability of encountering groundwater with > 10 μg/L As. The study area in the greater Augusta, Maine area is chosen because ~70% of the area is composed of bedrock units that are at least partially calcareous or calc-silicate. The bedrock units from west to east in the study area (Figure 1-A) are Silurian interbedded calcareous pelite and sandstone (Ss, Sangerville Formation), Silurian interbedded calcareous pelite and sandstone/limestone (Sw, Waterville Formation), and Silurian-Ordovician slightly to noncalcareous sandstone with limited cal-silicate lenses (SOv, Vassalboro Formation) (22). The sediment of these meta-sedimentary units was thought to be deposited in marine basins during Silurian (443-417 Ma) and contains abundant sulfide minerals (23). In addition to these NE-SW trending belts of meta-sedimentary rocks and several thin Silurian limestone and dolostone units, to the very eastern part of the study area lies the much older Ordovician-Cambrian mafic to felsic volcanic rocks (OZc, Cushing Formation). These formations underwent regional metamorphism from greenschist facies to amphibolites facies during the last significant tectonic event, the Acadian orogeny (420-360 Ma), and contact metamorphism by the intrusion of Devonian (417-360 Ma) plutons of granite, granodiorite, quartz monzonite and syenite (D) located in the center of the study area. These formations are nearly vertical with 80 to 89 degree dip.
Figure 1. Bedrock geology and groundwater As distribution in the greater Augusta, Maine area.

The star symbol in all panels indicates downtown Augusta.
A. Simplified bedrock geology. See text for description of the bedrock units. Insert is a map of Maine with rectangle representing the study area.
B. Discrete groundwater As distribution based on 2006 sampling. The rectangles indicate the four clusters sampled at greater density in 2007.
C. Log-normal kriged groundwater [As] distribution.
D. Probability of groundwater [As] >10μg/L by indicator kriging.
The study area, 1,135 km2, encompasses thirteen towns: Sidney, Vassalboro, China, Readfield, Manchester, Augusta, Windsor, Winthrop, Hallowell, Chelsea, Farmingdale, West Gardiner and Litchfield of Kennebec County (Figure 1-C). The U.S. census data of 2000 reports 57,330 residents in 23,773 households. Approximately 70% of these households use private wells. Most of these wells are installed in bedrock to draw water from fractures with variable yields, with wells generally installed to greater depth to compensate for low yields. The homeowner self-reported well depth ranges from 9 to 366 meter, with a mean of 66 meter (n=539), but 72% of the wells have depth ranging from 30 to 90 meter (Supporting Information Figure S5).
Groundwater Sampling and Analysis
From May to September 2006, consent to sample wells (n=790) using an outside faucet, was obtained from the homeowners who volunteered to participate in this study. Groundwater samples were collected without filtration into an acid-cleaned HDPE vial after the temperature, conductivity and pH readings stabilized in a flow-through cell, usually after 20 minutes of pumping. The sample was acidified to 1% HNO3 (Fisher Optima) on the same day after returning to the lab. The concentrations of As and 32 other elements, were measured by High Resolution Inductively Coupled Plasma Mass Spectrometry at Lamont-Doherty Earth Observatory. NIST standard reference material 1643e “trace elements in water” with 60.45 μg/L of As was used for QA/QC standard. An average of 56.1±1.6 μg/L As from tested NIST samples (n=10) suggested the analysis was relatively accurate (7%) and precise (RSD=2.9%). Only 12 out of 790 samples (1.5%) show As concentrations between 9.3 and 10 μg/L when the concentrations could be ≥ 10 μg/L._Homeowners completed a questionnaire about the well history, type and depth, and received a report of well water chemistry data. A brochure from the Maine Center for Disease Control was included with the report to provide information on As remediation. This dataset is used to assess the magnitude and probability of As occurrence in domestic bedrock wells.
To validate the statistical analysis and to determine sampling density appropriate to capture the spatial variability of As, from June to August in 2007, 331 additional groundwater samples were collected similarly from 4 cluster areas in the towns of Chelsea (n=107), Sidney (n=62), Litchfield (n=49) and Manchester (n=113), representing low, medium to high As occurrence based on the 2006 data. The sampling density was increased from 1-6 per km2 in 2006 to 5-42 per km2 in 2007.
Geostatistical Analysis
Kriging has become a standard method for spatial interpolation of limited data in environmental science (24). Different kriging forms are developed to estimate environmental variables at unknown locations based on the weighted sums of neighboring samples considering the spatial pattern and other variables of interest. Kriging estimates are considered as the most accurate linear unbiased estimator (25).
Log-normal ordinary kriging (ArcGIS 9, Geostatistical Analyst) was used to estimate the As distribution in the study area. Indicator kriging was used to estimate the probability of As concentrations exceeding 10 μg/L. The kriged As distribution and exceedance rate were exported into the raster maps with cell size 150 m × 150 m (Figure 1-C, D). The variance for both ordinary and indicator kriging was not mapped because the dense and even sampling made it not very informative (24).
Estimation of Population at Risk
The population at risk of exposure to unsafe levels of As in drinking water in the greater Augusta area was estimated using the spatial pattern of the probability calculated from indicator kriging. The mean values of the probability of As exceeding 10 μg/L were calculated for each census block. This arsenic exceedance rate for each census block was multiplied by the population using bedrock wells to arrive at the estimate of population at risk. The analysis excludes urban areas on public water supply.
Statistical Tests
The Kruskal-Wallis test by ranks (26) was used to compare the observed As concentrations among different bedrock groups without normality assumption. The nonparametric Mann-Whitney U test (27) was used to compare the observed As concentrations in each pair of bedrock units.
Results and Discussion
Groundwater Arsenic Concentration
In the 2006 dataset of 790 groundwater samples, the maximum As concentration was 325 μg/L, found in a well located in Litchfield (Figure 1-B). The dataset has a high positive skewness of 6.36, thus the median value of 3.8 μg/L is more appropriate than the mean value of 12.2 μg/L to describe the groundwater As concentrations (Table 1). Thirty-one percent of wells have As concentrations > 10 μg/L. The 2006 dataset also identifies clusters of wells with distinct difference in As occurrence. For example, the probability of finding a well with > 10 μg/L As was 6%, 14%, 48% and 75% for clusters located in Chelsea (n=16), Sidney (n=14), Manchester (n=21), and Litchfield (n=12), respectively (Figure 1-B and Table 2). These areas were selected for high density sampling in 2007 that increased the sampling density by a factor of about 6. The area of the 4 clusters ranged from 2.6 km2 for Chelsea and Sidney, to 10 km2 for Litchfield and 20 km2 for Manchester (Table 2). The probability of finding a well with > 10 μg/L As was 7%, 29%, 78% and 57% for Chelsea (n=107), Sidney (n=62), Manchester (n=113), and Litchfield (n=49), respectively for the 2007 dataset (Table 2). In the 2007 dataset of 331 groundwater samples, the maximum As concentration was 478 μg/L in Litchfield. The high density sampling of 2007 confirmed the order of low, medium to high As median values from Chelsea, Sidney, Litchfield to Manchester, as in 2006, although the median As concentrations for each cluster differ between two datasets. The probability of As exceedance gave the same order of ranking as the As median values in 2007 dataset. The only exception from the probability in Litchfield may be due to the large variance of As concentration in Litchfield, reflected in the inter-quartile range (0.75 quartile - 0.25 quartile) in 2006 and 2007 datasets (Table 2).
Table 1.
Summary Statistics of Groundwater Arsenic from the greater Augusta, Maine area in 2006
| As in simplified bedrock unit |
|||||||
|---|---|---|---|---|---|---|---|
| As | Ln(As) | Ss | Sw | SOv | D | OZc | |
| number of observations (n) | 790 | 790 | 163 | 259 | 249 | 87 | 32 |
| mean (μg/L) | 12.2 | 0.9 | 16.3 | 14.4 | 10 | 7.7 | 3 |
| standard deviation (μg/L) | 25.9 | 2.2 | 27.5 | 22.7 | 31.1 | 15.6 | 8.6 |
| median (μg/L) | 3.8 | 1.3 | 6.8 | 6.1 | 2.0 | 2.5 | 0.2 |
| Maximum (μg/L) | 325 | 5.8 | 200 | 199 | 325 | 95 | 41 |
| skewness | 6.4 | -0.5 | |||||
| observed probability of >10μg/L | 31% | 42% | 39% | 24% | 15% | 9% | |
| kriged probability of >10μg/L | 40(±3)% | 38(±2)% | 25(±2)% | 21(±4)% | 7(±3)% | ||
a Values in the parenthesis indicate 95% confidence interval.
b The well depth analysis shows no significant difference in the 5 bedrock units (see Supporting Information Table S2)
Table 2.
Summary Statistics of Groundwater As in Four Clusters in greater Augusta area
| clusters | Manchester | Litchfield | Sidney | Chelsea | |
|---|---|---|---|---|---|
| sampling area (km2) | 20 | 10 | 2.6 | 2.6 | |
| 2007 | sample size (n) | 113 | 49 | 62 | 107 |
| sampling density (n/km2) | 6 | 5 | 24 | 42 | |
| median As (μg/L) | 22.2 | 14.6 | 4.1 | 0.9 | |
| inter-quartile range (μg/L) | 31.4 | 37.5 | 10.2 | 4.3 | |
| probability of As >10μg/L | 78% | 57% | 29% | 7% | |
| 2006 | sample size (n) | 21 | 12 | 14 | 16 |
| sampling density (n/km2) | 1 | 1 | 5 | 6 | |
| median As (μg/L) | 31.1 | 22.7 | 0.2 | ND | |
| probability of As >10μg/L | 48% | 75% | 14% | 6% | |
| kriged probability of As >10μg/L | 53% | 70% | 17% | 13% |
Spatial Distribution of Groundwater Arsenic
Towns in the western part of the study area, and in particular, Manchester, Litchfield, Readfield, and Winthrop, display higher median As concentrations as well as higher probability of encountering a well with >10μg/L As than towns in the eastern part (Table 3). When As concentrations of individual wells were plotted (Figure 1B), a heterogeneous distribution can be observed. This large spatial variability is reflected by high nugget effects in semi-variograms (Supporting Information Figure S1). The nugget effect for As concentration is 3.48, which is 66% of the total variance of 5.26. The nugget effect for probability of As exceeding MCL is 0.135, which is 65% of the total variance of 0.209. These suggest that ordinary kriging and indicator kriging models capture only one third of As variability in bedrock aquifers at 100-101 km scales. The Root Mean Square values of predicted error of As concentration (31 μg/L) and probability (0.43) were also high due to this heterogeneity. Despite these errors, the west to east spatial pattern of groundwater As distribution in the study area is evident in the As concentration map (Figure 1C) and the probability map (Figure 1D). The spatial distribution of groundwater arsenic in the study area is more systematic than random.
Table 3.
Population at Risk in 13 Towns in Greater Augusta
| town | bedrock unit | median As (μg/L) | total population (n) | population at risk (n) | probability of As>10 μg/L |
|---|---|---|---|---|---|
| Augusta | D, SOv, Sw | 3.01 | 18,560 | 1,017 | 5.5% |
| Chelsea | SOv,D | 0.51 | 2,559 | 398 | 15.5% |
| China | SOv, D, Sw, OZc | 1.88 | 4,106 | 1,012 | 24.6% |
| Farmingdale | SOv, Sw | 3.13 | 2,804 | 181 | 6.5% |
| Hallowell | SOv, D, Sw | 2.62 | 2,467 | 154 | 6.2% |
| Litchfield | SOv, Sw, D | 4.28 | 3,110 | 1,367 | 44.0% |
| Manchester | Sw,D | 9.16 | 2,465 | 1,346 | 54.6% |
| Readfield | Ss, Sw | 8.51 | 2,360 | 914 | 38.7% |
| Sidney | Sw, Ss, SOv | 3.40 | 3,514 | 1,078 | 30.7% |
| Vassalboro | SOv, Sw, D | 3.87 | 4,047 | 854 | 21.1% |
| West Gardiner | SOv, Sw, D, OZc | 3.42 | 2,902 | 773 | 26.6% |
| Windsor | OZc, SOv, D | 0.60 | 2,204 | 296 | 13.4% |
| Winthrop | Ss, Sw | 8.80 | 6,232 | 2,658 | 42.7% |
| total | 57,330 | 12,047 | 21.0% |
a Only population in rural area using private bedrock wells as water supply is used for calculation.
Population at Risk
A total of 12,047 people in the study area, or 21.0% of the total population of 57,330 (28), are estimated to be at risk of exposure to > 10 μg/L As in groundwater. Due to the spatial heterogeneity of As occurrence and population distribution, the percentages of population at risk in 13 towns varied from as low as 6% in Augusta, Farmingdale and Hallowell to as high as 55% in Manchester (Table 3). The actual population at risk might be lower due to the use of bottled water and water treatment systems (13). This estimate does not account for the increase of population since 2000.
Association with Bedrock
The 2006 dataset allows for quantitative assessment of As occurrence in each bedrock unit in the greater Augusta area. It is important to note that the source for the bedrock units is a highly generalized map at the scale of 1:500,000 (22). The spatial accuracy of unit contacts on this map may be on the order of 1 km and introduces considerable uncertainty to the designation of the bedrock unit for each well in the dataset. However, this uncertainty does not affect the spatial analysis of arsenic distribution at the 10 km scale in the study area. Both median values of As and the probability of [As] > 10 μg/L give consistent ranking of As occurrence from low, medium to high in the order of OZc, D/SOv, and Ss/Sw (Figure 2 and Table 1). The Ss and Sw units have the highest median [As] and also the highest percentage (~40%) of wells with [As] > 10μg/L. The much older OZc unit has the lowest median [As] and the lowest percentage (~10%) of wells with [As] >10μg/L. The ranking of As occurrence based on observed [As] among different bedrock groups was statistically significant based on Kruskal-Wallis test (Chi-square value = 75.32, p-value < 0.0001). Statistical values of the Mann-Whitney U test showed that there was no significant difference between the Ss and Sw units, neither between D and SOv unit. Except these two pairs, all other pairs of bedrock units showed significantly different As concentrations (Supporting Information Table S1).
Figure 2. Groundwater As occurrence in simplified bedrock units.
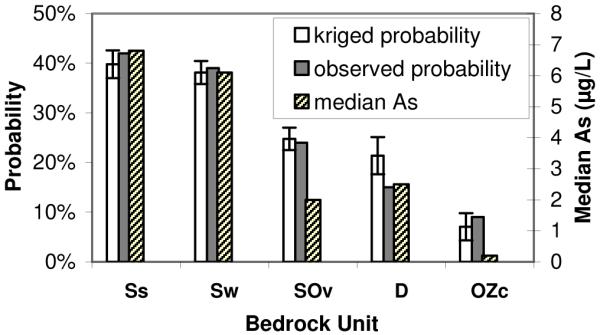
The Error bars stand for 95% confidence interval.
The bedrock of the study area is currently being mapped by the Maine Geological Survey at the 1: 24,000 scale so that the spatial As pattern recognizable in the 4 cluster areas and their association with lithogeochemistry can be compared in the future. This will also help assess the uncertainty introduced by using regional scale maps for these analyses.
Association between Bedrock and Groundwater As: Regional vs. Intermediate Scale
On a regional scale of 102-103 km in New England, Ayotte et al (17) applied a logistic regression model to data including 2,470 bedrock wells at a sampling density of 1 per 70 km2 and showed that groundwater As distribution was controlled primarily by bedrock lithogeochemistry, with the highest occurrence rate found in units of calcareous and calc-silicate lithogeochemsitry (4, 29). In New Hampshire, no apparent geographic relationship between bedrock As concentrations (n=307) and groundwater As concentrations from bedrock wells (n=2,273) can be identified (14). This suggests that aqueous geochemistry and groundwater flow path other than As concentrations in bedrocks play significant roles on groundwater As distribution.
Studies conducted at the intermediate scale of 100-101 km appear to suggest a linkage between bedrock type and groundwater As occurrence. In Hillsborough, Rockingham, and Strafford Counties of southeastern New Hampshire, Montgomery et al (30) found that high groundwater As concentrations were related to geologic units such as the Ayer granodiorite, Eliot Formation, Rangeley Formation and Berwick Formation, the last three units showing calcareous to calc-silicate lithogeochemistry. In Maine, Marvinney et al (15) found a mean value of 2.7 μg/L As in 1,111 domestic bedrock wells from the Buxton and Hollis area of 192 km2 in Southwestern Maine Plain, with 42% containing > 10 μg/L of As. As occurrence in bedrock wells in the granites in the southern Buxton-Hollis area was apparently lower than in the meta-sedimentary rock units composed of sandstone, shale, and limestone with weathered rusty sulfide-bearing rocks.
How do the distinctly different groundwater As occurrence rates among bedrock units in the study area compare to those found in regional studies of New England? In the decreasing rank of order, the percentages of groundwater [As] > 10 μg/L were the calcareous and calc-silicate units (21%), the noncalcareous and nonsulfidic units (15%), the mafic/felsic igneous units (6-9%) to the sulfidic units (3%) in the entire New England region (4). At the intermediate scale (100-101km), the present study identified two bedrock units, the Ss and Sw (both calcareous and calc-silicate units), that have higher percentage of wells with As exceedance than that in the regional study (Table 1). The Ss and Sw units rank the highest in groundwater As occurrence, with 42% and 39% of wells in exceedance of MCL, respectively. Future surveys at sufficient spatial sampling density should target bedrock units similar to Ss and Sw first. The As exceedance rate of 24% in the SOv unit is comparable to its regional counterpart, but it is unclear whether this is a coincidence or whether this group in the regional study included more samples from other rock units similar to SOv. Highly heterogeneous OZc unit has an As exceedance rate of 9%, which is slightly higher than the percentage in regional study. Again, more studies at the local scale are needed to confirm the significance of the similarity of the two estimates.
The higher As exceedance in the Devonian granite unit (D, 15%) compared to the corresponding regional group of felsic igneous rocks (6%) may be related to pegmatite formation during granitic intrusion. In central New Hampshire, the Concord granite and pegmatite (felsic igneous rock in regional scale) showed a higher percentage of groundwater As >10 μg/L than Rangeley Formation and Smalls Falls Formation (as sulfidic unit in regional study) (31). Especially noteworthy is the observation that the wells with elevated As tended to be within 5 km of the boundary where the granite plutons intrude to the metasedimentary rocks. In our study area, the Devonian granite intrudes the metasedimentary units where groundwater As exceedance rates are high. However, probably due to the small size of granite plutons (short axis <3 km) and that shallow plutons are closer to water sample points vertically than horizontally, this relationship was not evident (Supporting Information Figure S3).
The different groundwater As occurrence rates found in bedrock units at intermediate scale in the greater Augusta, Maine area, likely reflect in part bedrock geochemical composition differences. At the regional scale of 102-103 km, geochemical composition of bedrock plays a dominant role on bedrock well water As distribution in New England, among many other factors (17). Further work to characterize the composition of the bedrock samples at the intermediate scale (100-101 km) is much needed.
Consideration of Sampling Density
Our results suggest that a sampling density of 1-5 per km2 is sufficient to capture the spatial pattern of groundwater As distribution in fractured bedrock aquifers of New England at the intermediate scale (100-101 km) using interpolation methods. In addition to the statistically meaningful differences of As occurrence in each bedrock unit, a 6 times higher sampling density in four representative cluster areas did not change the ranking of the As occurrence significantly (Table 2). Furthermore, the kriged probability is consistent with the observed As occurrence from low, median to high in these clusters at km scales.
At local scales (≤ 10-1 km), the spatial variance of groundwater As distribution is very large, and generally increases with increasing median As concentrations (Table 1). The inter-quartile range of As distribution based on high density sampling in 2007 was 31 and 38 μg/L for Manchester and Litchfield, respectively, while median [As] was 22 μg/L and 15 μg/L, respectively. The inter-quartile range was 10 μg/L in Sidney with a median [As] of 4.1 μg/L. and is only 4.3 μg/L in Chelsea with a median [As] of 0.9 μg/L. The higher sampling density of 24-42 per km2 in Sidney and Chelsea may result in the smaller inter-quartile range compared to Manchester and Litchfield with lower sampling density of 5-6 per km2. This possibility can only be tested if the sampling density in Manchester or Litchfield is further increased. This is presently not possible because of the absence of wells (also housing) in this area. Nevertheless, our results suggest that to identify the As spatial pattern at local scales of ≤10-1 km, higher sampling density of tens of wells per km2 is desirable.
This large As variability at local scales was also seen in unconsolidated sedimentary aquifers because of the heterogeneity of aquifer media and complicated geochemical mechanisms controlling As mobilization. In fractured bedrock aquifers, this variance could be further enlarged by the anomalous flow paths of ground water as well as the poor connectivity and magnitude of fractures that water flows through at scales of 100 meters. Considering this, the spatial dependence of As concentrations in fractured bedrock aquifers at scales of ≤ 10-1 km should not be used to interpolate As distribution at intermediate scales.
Limitations
The study did not evaluate temporal variations. However, the temporal change of As concentrations have previously been found to be insignificant or at least much lower than the spatial variation (13, 19, 32). No significant vertical trend of As concentration was found (Supporting Information Table S2).
One-sentence synopsis
The spatial pattern of groundwater arsenic distribution in fractured bedrock aquifers from central Maine and its association with bedrock geology is examined.
Supplementary Material
Acknowledgments
Funding for this work is provided by the US National Institute of Environmental Health Sciences Superfund Basic Research Program 2 P42 ES10349 to Y. Zheng. We thank Z. Cheng of LDEO, Columbia for assistance with ICP-MS analyses, F. Ren of SPH, Columbia for performing the statistical tests, A. Ludman of Queens College and J. Ayotte of USGS for helpful discussions. Finally, we thank the families in the study area for their cooperation and for providing well information.
Footnotes
Supporting Information Available To protect the privacy of the homeowners, the tabulated As concentration data are not included but available to researchers upon request for usage in accordance of IRB rules. Semivariograms of kriging, statistical analysis, groundwater As distribution in relation to the granite pluton boundary, and well depth analysis are available free of charge via the Internet at http://pubs.acs.org.
Literature Cited
- 1.Smedley PL, Kinniburgh DG. A review of the source, behaviour and distribution of arsenic in natural waters. Applied Geochemistry. 2002;17(5):517–568. [Google Scholar]
- 2.Solley WB, Pierce RR, Perlman HA. Estimated Use of Water in the United States in 1995. U.S. Geological Survey Circular. 1998;1200 [Google Scholar]
- 3.Welch AH, Westjohn DB, Helsel DR, Wanty RB. Arsenic in Ground Water of the United States: Occurrence and Geochemistry. Ground Water. 2000;38(4):589–604. [Google Scholar]
- 4.Ayotte JD, Nielsen MG, Robinson GR, Moore RB. Relation of Arsenic, Iron, and Manganese in Ground Water to Aquifer Type, Bedrock Lithogeochemistry, and Land Use in the New England Coastal Basins. U.S. Geological Survey, Water-Resources Investigations Report 99-4162. 1999:P70. [Google Scholar]
- 5.Ryker SJ. Mapping arsenic in groundwater. Geotimes. 2001;46(11):34–36. [Google Scholar]
- 6.Robertson FN. Arsenic in ground-water under oxidizing conditions, south-west United States. Environmental Geochemistry and Health. 1989;11(3):171–185. doi: 10.1007/BF01758668. [DOI] [PubMed] [Google Scholar]
- 7.Welch AH, Lico MS, Hughes JL. Arsenic in Ground Water of the Western United States. Ground Water. 1988;26(3):333–347. [Google Scholar]
- 8.Roberts K, Stearns B, Francis RL. Investigation of arsenic in southeastern North Dakota ground water. A Superfund Remedial Investigation Report. North Dakota State Department of Health. 1985 [Google Scholar]
- 9.Schreiber ME, Gotkowitz MB, Simo JA, Freiberg OG. Mechanisms of arsenic release to ground water from naturally occurring sources, eastern Wisconsin. In: Welch AH, Stollenwerk KG, editors. Arsenic in Ground Water. Kluwer Academic Publishers; Dordrecht: 2003. pp. 259–280. [Google Scholar]
- 10.Peters SC. Arsenic in groundwaters in the Northern Appalachian Mountain belt: A review of patterns and processes. Journal of Contaminant Hydrology. 2008;99(14):8–21. doi: 10.1016/j.jconhyd.2008.04.001. [DOI] [PubMed] [Google Scholar]
- 11.Peters SC, Blum JD, Klaue B, Karagas MR. Arsenic Occurrence in New Hampshire Drinking Water. Environ. Sci. Technol. 1999;33(9):1328–1333. [Google Scholar]
- 12.Meliker JR, AvRuskin GA, Slotnick MJ, Goovaerts P, Schottenfeld D, Jacquez GM, Nriagu JO. Validity of spatial models of arsenic concentrations in private well water. Environmental Research. 2008;106(1):42–50. doi: 10.1016/j.envres.2007.09.001. [DOI] [PMC free article] [PubMed] [Google Scholar]
- 13.Ayotte JD, Montgomery DL, Flanagan SM, Robinson KW. Arsenic in groundwater in eastern New England: occurrence, controls, and human health implications. Environmental Science and Technology. 2003;37(10):2075–2083. doi: 10.1021/es026211g. [DOI] [PubMed] [Google Scholar]
- 14.Peters SC, Blum JD, Karagas MR, Chamberlain CP, Sjostrom DJ. Sources and exposure of the New Hampshire population to arsenic in public and private drinking water supplies. Chemical Geology. 2006;228(13):72–84. [Google Scholar]
- 15.Marvinney RG, Loiselle MC, Hopeck JT, Braley D, Krueger JA. Arsenic in Maine ground water - An example from Buxton, Maine. The 1994 Focus Conference on Eastern Regional Ground Water Issues; Burlington, Vermont. pp. 701–715. [Google Scholar]
- 16.U.S.Bureau-of-the-Census Historical Census of Housing Tables-Sources of Water. http://www.census.gov/hhes/www/housing/census/historic/water.html
- 17.Ayotte JD, Nolan BT, Nuckols JR, Cantor KP, Robinson GR, Baris D, Hayes L, Karagas M, Bress W, Silverman DT, Lubin JH. Modeling the Probability of Arsenic in Groundwater in New England as a Tool for Exposure Assessment. Environ. Sci. Technol. 2006;40(11):3578–3585. doi: 10.1021/es051972f. [DOI] [PubMed] [Google Scholar]
- 18.Loiselle MC, Marvinney RG, Smith AE. Spatial distribution of arsenic in groundwater in Maine. GSA Annual Meeting.2001. [Google Scholar]
- 19.Karagas MR, Stukel TA, Tosteson TD. Assessment of cancer risk and environmental levels of arsenic in New Hampshire. International Journal of Hygiene and Environmental Health. 2002;205(12):85–94. doi: 10.1078/1438-4639-00133. [DOI] [PubMed] [Google Scholar]
- 20.Day-Lewis FD, Hsieh PA, Gorelick SM. Identifying fracture-zone geometry using simulated annealing and hydraulic-connection data. Water Resources Research. 2000;36(7):1707–1721. [Google Scholar]
- 21.Lipfert G, Reeve AS, Sidle WC, Marvinney R. Geochemical patterns of arsenic-enriched ground water in fractured, crystalline bedrock, Northport, Maine, USA. Applied Geochemistry. 2006;21(3):528–545. [Google Scholar]
- 22.Osberg PH, Hussey AM, Boone GM. Bedrock geologic map of Maine. Maine Geological Survey; Augusta, Maine: 1985. [Google Scholar]
- 23.Hanson LS, Bradley DC. Sedimentary facies and tectonic interpretation of the Lower Devonian Carrabassett Formation, north-central Maine. In: Tucker RD, Marvinney RG, editors. Studies in Maine geology: Volume 2 - structure and stratigraphy. Maine Geological Survey; 1989. pp. 101–126. [Google Scholar]
- 24.Gaus I, Kinniburgh DG, Talbot JC, Webster R. Geostatistical analysis of arsenic concentration in groundwater in Bangladesh using disjunctive kriging. Environmental Geology. 2003;44:939–948. [Google Scholar]
- 25.Lin Y-P, Chang T-K, Shih C-W, Tseng C-H. Factorial and indicator kriging methods using a geographic information system to delineate spatial variation and pollution sources of soil heavy metals. Environmental Geology. 2002;42(8):900–909. [Google Scholar]
- 26.Kruskal WH, Wallis WA. Use of ranks in one-criterion variance analysis. Journal of the American Statistical Association. 1952;47(260):583–621. [Google Scholar]
- 27.Mann HB, Whitney DR. On a test of whether one of two random variables is stochastically larger than the other. Annals of Mathematical Statistics. 1947;18:50–60. [Google Scholar]
- 28.United-States-Census-2000. http://www.census.gov/main/www/cen2000.html
- 29.Robinson JGR, Ayotte JD. The influence of geology and land use on arsenic in stream sediments and ground waters in New England, USA. Applied Geochemistry. 2006;21(9):1482–1497. [Google Scholar]
- 30.Montgomery DL, Ayotte JD, Carroll PR, Hamlin P. Arsenic concentrations in private bedrock wells in southeastern New Hampshire, U.S. Geological Survey Fact Sheet 051-03. 2003. [Google Scholar]
- 31.Peters SC, Blum JD. The source and transport of arsenic in a bedrock aquifer, New Hampshire, USA. Applied Geochemistry. 2003;18(11):1773–1787. [Google Scholar]
- 32.Colt JS, Baris D, Clark SF, Ayotte JD, Ward M, Nuckols JR, Cantor KP, Silverman DT, Karagas M. Sampling private wells at past homes to estimate arsenic exposure: A methodological study in New England. Journal of Exposure Analysis and Environmental Epidemiology. 2002;12(5):329–334. doi: 10.1038/sj.jea.7500235. [DOI] [PubMed] [Google Scholar]
Associated Data
This section collects any data citations, data availability statements, or supplementary materials included in this article.