Abstract
A group of post-natal neurodevelopmental disorders collectively referred to as MeCP2 disorders are caused by aberrations in the gene encoding methyl-CpG-binding protein 2 (MECP2). Loss of MeCP2 function causes Rett syndrome (RTT), whereas increased copy number of the gene causes MECP2 duplication or triplication syndromes. MeCP2 acts as a transcriptional repressor, however the gene expression changes observed in the hypothalamus of MeCP2 disorder mouse models suggest that MeCP2 can also upregulate gene expression, given that the majority of genes are downregulated upon loss of MeCP2 and upregulated in its presence. To determine if this dual role of MeCP2 extends beyond the hypothalamus, we studied gene expression patterns in the cerebellum of Mecp2-null and MECP2-Tg mice, modeling RTT and MECP2 duplication syndrome, respectively. We found that abnormal MeCP2 dosage causes alterations in the expression of hundreds of genes in the cerebellum. The majority of genes were upregulated in MECP2-Tg mice and downregulated in Mecp2-null mice, consistent with a role for MeCP2 as a modulator that can both increase and decrease gene expression. Interestingly, many of the genes altered in the cerebellum, particularly those increased by the presence of MeCP2 and decreased in its absence, were similarly altered in the hypothalamus. Our data suggest that either gain or loss of MeCP2 results in gene expression changes in multiple brain regions and that some of these changes are global. Further delineation of the expression pattern of MeCP2 target genes throughout the brain might identify subsets of genes that are more amenable to manipulation, and can thus be used to modulate some of the disease phenotypes.
INTRODUCTION
MECP2, the gene that encodes methyl-CpG-binding protein 2, is located on chromosome Xq28. MECP2 mutations and copy number variations cause a number of neurodevelopmental disorders including Rett syndrome (RTT, MIM # 312750), autism, X-linked mental retardation and the MeCP2 duplication/triplication syndromes (1–6). RTT primarily affects females at a frequency of ∼1:10 000 live births and is characterized by a period of cognitive regression after a 6–12 months period of apparently normal development (7). The phenotype of affected girls includes stereotypic hand movements, severe mental retardation with loss of language, seizures and microcephaly. In addition, affected individuals display autism-like behaviors, anxiety, breathing irregularities, sleep disturbances and autonomic dysfunction (8). MECP2 mutations can be detected in up to 96% of girls with classic RTT, and include nonsense, missense and frameshift mutations, as well as large deletions (9,10). The fact that truncating mutations and early nonsense mutations cause RTT implies that the disease is typically caused by loss of function of MeCP2. Given that affected females are mosaic for MECP2 mutant and wild-type (WT) alleles, it is not surprising that males hemizygous for MECP2 mutations are born with severe infantile encephalopathy and die early (11). Hypomorphic alleles (missense mutations and late truncating mutations) are associated with mental retardation and other neuropsychiatric features in males. These mutations, however, hardly cause a phenotype in mosaic carrier females (12,13). Different mouse models resulting in either a null allele or Mecp2 truncating mutations recapitulate RTT-like phenotypes (14–16).
Increased dosage of MECP2 is associated with a distinct neurological phenotype as well. Males with functional disomy of chromosome Xq28, in the region spanning MECP2, present with hypotonia, mental retardation and seizures, whereas females carrying the duplication have mild psychiatric symptoms owing to favorable X-chromosome inactivation (XCI) patterns (Ramocki, Tavyev and Zoghbi, unpublished data). Although the size of the duplication varies among different patients and includes several genes, the minimal critical region in all of the affected cases includes MECP2. Transgenic mice expressing either 2X or 3X MeCP2 levels from the endogenous promoter (MECP2-Tg) show significant neurological impairment, including motor dysfunction, seizures and stereotypic behaviors (17). The data from MECP2-Tg mice provide evidence that it is the duplication of MECP2 on chromosome Xq28 that causes the abnormal neurological phenotypes in human patients. Neurophysiological studies on Mecp2-null and MECP2-Tg mice have demonstrated that loss and gain of the protein have opposite effects on the number of synapses in glutamatergic neurons (18). These findings, together with data showing opposite expression patterns of the same genes in Mecp2-null and MECP2-Tg mice (19), support the conclusion that MECP2 duplication causes disease by a gain of function (hyperfunction) mechanism.
Previous studies showed that MeCP2 acts as transcriptional repressor by recruiting histone deacetylases to DNA containing methylated cytosines (20,21). Thus, it was expected that girls with RTT, as well as mouse models of RTT, would have an overexpression of genes due to loss of MeCP2 function. However, only a handful of MeCP2 target genes have been identified. Transcriptional profiling studies using whole brain from Mecp2-null mice revealed only subtle gene expression changes (22), and studies investigating cerebellar gene expression changes identified very few alterations that did not withstand a correction for false discovery rate (FDR) (23). A recent study profiling three different brain regions in Mecp2-null mice (cortex, midbrain and cerebellum) found a handful of significant gene expression changes after correcting for FDRs (24). Furthermore, the exact effect of MeCP2 on the handful of putative targets was often unclear. For example, whereas lack of MeCP2 was associated with increased levels of brain-derived neurotrophic factor (Bdnf) in neuronal cell cultures (25,26), in vivo studies revealed that BDNF protein levels were actually reduced in brains of Mecp2-null mice (27), and that Bdnf appears to be activated by MeCP2 in mouse models of MeCP2 disorders (19).
Recently we explored whether some phenotypes of RTT can be attributed to hypothalamic dysfunction. To this end, we analyzed hypothalamic gene expression patterns in Mecp2-null and MECP2-Tg mice. To our surprise, we found thousands of significant gene expression changes in the hypothalamus. Even more interestingly, we found that most of the altered genes were downregulated in Mecp2-null and upregulated in MECP2-Tg mice. These results provided new insight about MeCP2 function and suggested that MeCP2 might actually act as a transcriptional modulator that can both activate and repress gene expression (19). Furthermore, a recent study using chromatin immunoprecipitation (ChIP)–chip analysis found that MeCP2 associates more frequently with activated promoters (28). The finding that the expression of 2582 genes was altered in the hypothalamus, in contrast to a handful of genes from whole brain, raised at least two possibilities: first, that these changes are specific to the hypothalamus and secondly, that investigating a discrete brain region (rather than whole brain) is a good strategy to uncover candidate MeCP2 target genes. Because hypothalamic dysfunction does not solely explain the complex phenotypes observed in MeCP2 disorders, we proposed that gene expression alterations do occur in other brain regions but that they might be difficult to detect because they are subtle. Hence, we chose to investigate gene expression changes in other brain regions in mouse models of MeCP2 disorders, and to compare the patterns across regions.
To this end, we evaluated gene expression alterations resulting from MeCP2 dysfunction in the cerebellum. We found that indeed MeCP2 affects the expression of hundreds of genes in the cerebellum. Moreover, using quantitative reverse transcriptase–PCR (QRT–PCR) and in situ hybridization (ISH), we found that several of the gene alterations observed in mouse models of MeCP2 disorders are not region-specific, but are altered in two brain regions demonstrating that MeCP2 has both global and region-specific effects on neuronal gene expression.
RESULTS
Cerebellar gene expression changes in mouse models of MeCP2 disorders
To investigate the effect of MeCP2 on gene expression in the cerebellum, we analyzed cerebellar RNA using a microarray platform that utilizes multiple probes along the different exons of each gene (Affymetrix GeneChip mouse exon 1.0 ST array). The use of these arrays potentially enables reliable detection of even small fold changes due to the existence of multiple probes for most transcripts. We analyzed RNA extracted from whole cerebella of five FVB MECP2-Tg male mice (17) and their WT littermates, and five B6C57 (N7) Mecp2-null male mice (14) and their WT littermates, at 6 weeks of age. MECP2-Tg mice have increased expression of human MECP2, whereas Mecp2-null male mice lack MeCP2 protein. We studied the expression profiles in male mice to avoid the confounding effect of variable XCI patterns in females. Using a FDR-corrected P-value <0.05 and a fold change cutoff of ± 0.2, we found that 1180 genes are altered in cerebella of MECP2-Tg mice compared with WT, whereas 1102 genes are altered in cerebella of Mecp2-null mice compared with WT (Fig. 1).
Figure 1.
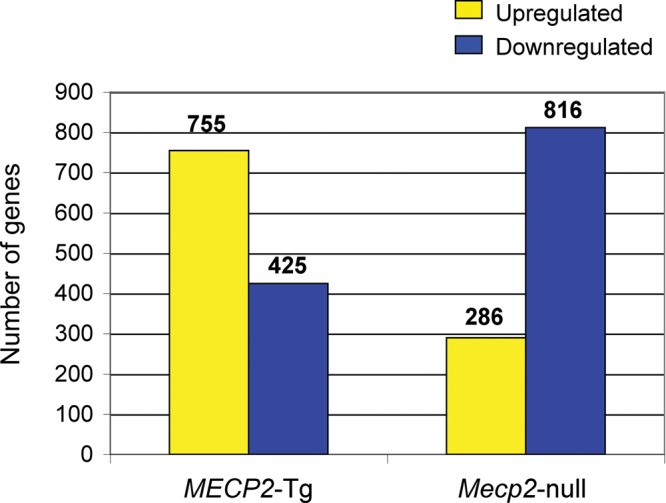
Studies of cerebellar gene expression changes in MECP2-Tg and Mecp2-null mice. Most of the genes altered in both mouse models are upregulated in the presence of MeCP2 and downregulated in its absence.
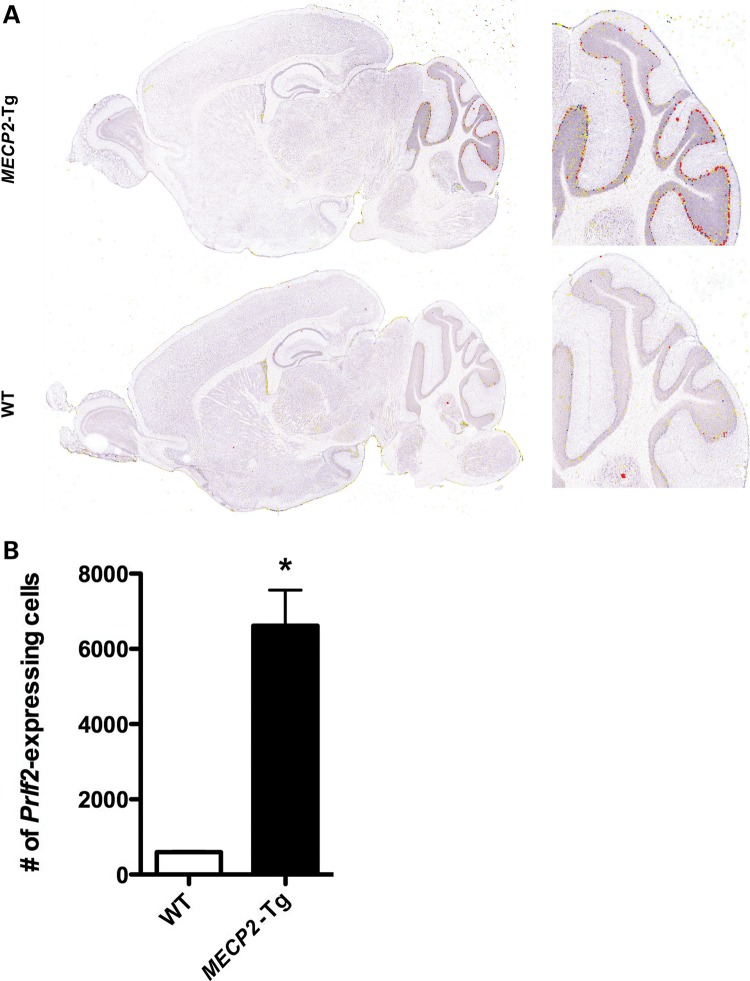
In order to confirm the microarray results and to obtain an independent measurement of fold changes between mutants and controls, we used QRT–PCR. For these analyses, we used cerebellar RNA from an independent set of MECP2-Tg mice, Mecp2- null mice and their WT littermate controls. For each animal, we tested 31 genes using one probe per gene. We were able to confirm alterations in 87% of the genes tested in MECP2-Tg mice and in 68% of the genes tested in Mecp2-null mice (P < 0.05) (Table 1). The fold changes detected by QRT–PCR in both models were similar to those observed for the microarray data; typically 1.2–2-fold in either direction. The changes were, in general, smaller in Mecp2-null compared with MECP2-Tg mice based on both the microarray result and the QRT–PCR. This difference may explain the lower confirmation rates in Mecp2-null mice. The magnitudes of fold changes detected in the cerebellum were similar to those previously reported in the hypothalamus (19). Interestingly, there was one exception where a gene was overexpressed in MECP2-Tg mice 18 times more than WT levels. The gene encodes proliferin 2 (Prlf2), a prolactin-like protein also known as prolactin family 2, subfamily c, member 2 (Prl2c2), and is located ∼8 Mb distal to the prolactin gene on mouse chromosome 13. The gene is reported to be rodent-specific and likely generated by duplication of the prolactin gene. Prlf2 expression was not altered in hypothalami of MECP2-Tg or Mecp2-null mice, thus alterations in expression of this gene are not global in the brain (19). In order to confirm the magnitude of the observed fold change, we analyzed the expression of Prlf2 by RNA ISH using sagittal brain sections from 6-week-old MECP2-Tg mice and their WT littermate controls, and the images were pseudocolored using the Celldetekt protocol to determine the relative expression level on a per cell basis (29) (Fig. 2A). To quantify the expression levels, the total number of Prlf2-expressing cells was counted throughout the cerebellum from two to three mice per genotype. We found that there is 11 times more Prlf2 expression in cerebellar cells of MECP2-Tg mice compared with WT (P < 0.004) (Fig. 2B). Although this gene does not exist in humans, the magnitude of the fold change seen in this case demonstrates that MeCP2 dysfunction can lead to marked alterations in the expression of select transcripts.
Table 1.
Confirmation of cerebellar gene expression changes by QRT–PCR in MECP2-Tg and Mecp2-null mice compared with WT littermate controls (P < 0.05)
| Gene |
MECP2-Tg |
Mecp2-null |
||
|---|---|---|---|---|
| Fold change | P-value | Fold change | P-value | |
| Prlf2 | 18.23 | 4.42E−06 | −1.68 | 3.85E−02 |
| Rcor2 | 2.97 | 4.85E−05 | −1.03 | NS |
| Gdf11 | 2.25 | 3.64E−05 | −2.07 | 9.07E−06 |
| Alpk2 | 2.13 | 3.59E−03 | −2.36 | 1.06E−03 |
| Cyp4f15 | 2.07 | 3.01E−03 | −1.39 | 2.80E−02 |
| Gpr26 | 1.90 | 5.93E−03 | −1.75 | 3.30E−02 |
| Apba2bp | 1.79 | 9.27E−04 | −1.46 | 7.43E−03 |
| Gpr165 | 1.68 | 8.29E−05 | −1.52 | 3.09E−04 |
| Nxph4 | 1.63 | 7.22E−03 | −1.58 | 4.06E−04 |
| Gprk5 | 1.62 | 9.34E−04 | −1.45 | 2.05E−04 |
| Hdc | 1.60 | 6.99E−03 | −1.27 | 1.87E−02 |
| Gamt | 1.59 | 2.33E−03 | −1.37 | 1.71E−02 |
| Paqr6 | 1.55 | 2.73E−03 | −1.18 | NS |
| Ephb6 | 1.53 | 1.90E−03 | −1.16 | NS |
| Cacng4 | 1.46 | 2.96E−03 | −1.35 | 1.83E−03 |
| Erbb3 | 1.43 | 9.75E−04 | −1.65 | 2.23E−03 |
| Zcchc12 | 1.43 | NS | −1.21 | NS |
| Tgfb1 | 1.41 | 1.30E−02 | −1.18 | 7.71E−03 |
| Gabra3 | 1.39 | 2.14E−03 | −1.34 | 3.37E−02 |
| Coch | 1.38 | 1.84E−02 | −1.18 | NS |
| Pcsk1 | 1.30 | 2.90E−02 | −1.39 | 1.01E−02 |
| Ngef | 1.18 | NS | −1.61 | 4.52E−02 |
| Lrp1b | −1.62 | 2.37E−02 | 1.15 | 3.04E−02 |
| Cep72 | −1.22 | 4.55E−02 | 1.29 | 1.12E−02 |
| Robo2 | −1.25 | NS | 1.20 | NS |
| Pcolce2 | −1.28 | 3.99E−03 | 1.39 | NS |
| Robo1 | −1.33 | 9.40E−03 | 1.24 | 1.13E−02 |
| Auts2 | −1.36 | NS | 1.33 | NS |
| Pygm | −1.63 | 5.24E−05 | 1.36 | 1.38E−02 |
| Ntng1 | −1.77 | 1.99E−03 | 1.13 | NS |
| Kcnh7 | −1.97 | 2.76E−04 | 1.20 | NS |
NS, not significant; P ≥ 0.05.
Figure 2.
RNA ISH demonstrates that Prlf2 is highly upregulated in MECP2-Tg cerebellum compared with WT (A). Prlf2-expressing cells were counted on sections throughout the cerebellum (B) (*P < 0.004).
Gain and loss of MECP2 have opposite effects on multiple transcripts and most are increased by gain of MeCP2
Given that MeCP2 was originally identified as a transcriptional repressor (21) one would expect that overexpression of MeCP2 will result in reduced expression of multiple genes, whereas loss of MeCP2 will lead to overexpression of target genes. However, consistent with recent findings in the hypothalamus (19), we found that 64% of the genes altered in MECP2-Tg mice were upregulated compared with WT and that 74% of the genes altered in Mecp2-null mice were downregulated compared with WT (Fig. 1).
We found that 583 genes were commonly altered in cerebella of both MECP2-Tg and Mecp2-null mice (Fig. 3A). Most of these genes (95%) were altered in an opposite direction in the two models, and the majority (75%) was upregulated by the presence of MeCP2 and downregulated by lack of MeCP2 (Fig. 3B, Supplementary Material, Tables S1 and S2). On the other hand, 597 genes were only misregulated in MECP2-Tg cerebella, and 519 genes were only misregulated in Mecp2-null cerebella (Supplementary Material, Tables S3 and S4). Interestingly, a very small proportion of the 583 genes (32) was altered in the same direction in the two models (Supplementary Material, Tables S5 and S6). If indeed the overexpression and the lack of MeCP2 have opposite molecular effects, it may be that the genes that are uniquely altered in each model, or that are altered in the same direction in both models, represent secondary effects due to neuronal dysfunction. These results imply that MeCP2 is likely to act as a positive regulator of gene expression in the cerebellum as well. As the expression analysis cannot differentiate primary versus secondary changes associated with MeCP2, it is still possible that MeCP2 acts primarily as a repressor and that the main activation effect in the transgenic mice cerebella is a secondary change generated by repression of a primary MeCP2 target. However, our analysis did not reveal a bona fide repressor that is downregulated by MeCP2 and that can potentially cause a secondary repression in Mecp2-null mice and a secondary activation in MECP2-Tg mice.
Figure 3.
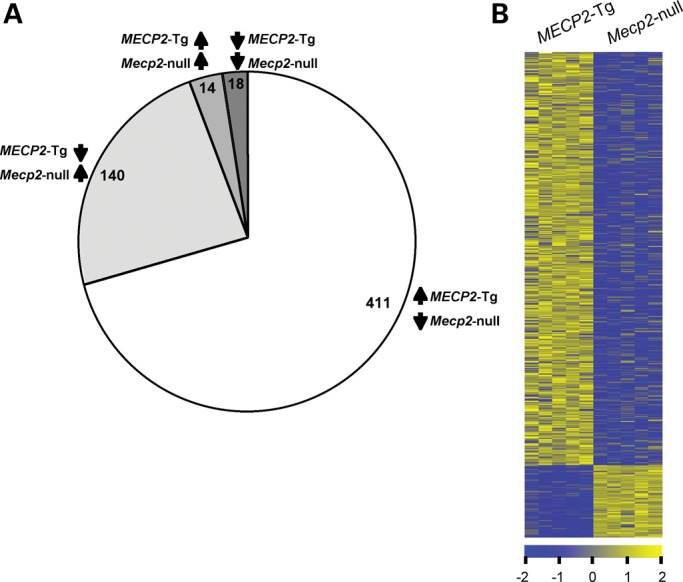
Cerebellar gene expression changes common to both MECP2-Tg and Mecp2-null mice. (A) The majority of genes altered in both mouse models (95%) show opposite direction of change, usually activation. (B) Heatmap showing cerebellar gene expression profiles in MECP2-Tg and Mecp2-null mice. Yellow and blue colors indicate increased and decreased expression, respectively, relative to WT. Each column represents one RNA sample from each genotype, and each row represents one gene. Expression levels are depicted according to the color scale at the bottom (FDR-corrected P < 0.05).
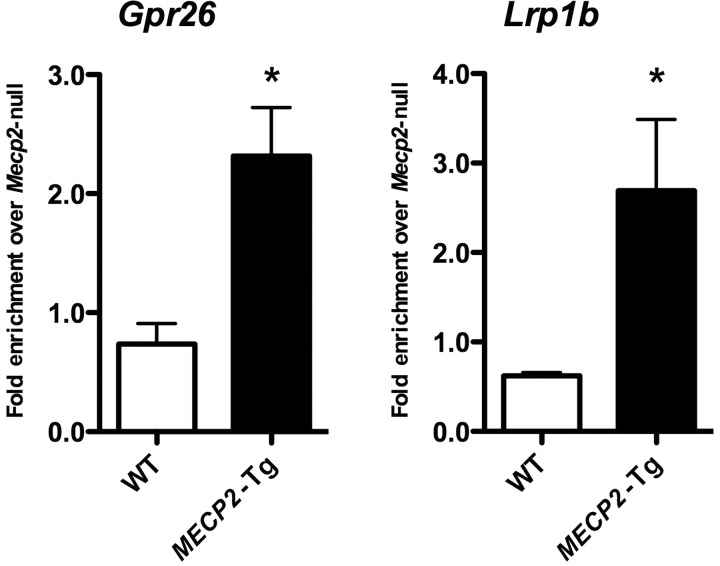
In order to distinguish primary versus secondary MeCP2 target genes, we performed ChIP on cerebella from three MECP2-Tg, Mecp2-null and WT mice. We found that MeCP2 binds to the promoter regions of the activated target Gpr26 and the repressed target Lrp1b (Fig. 4). Gpr26 encodes the G protein-coupled receptor (GPCR) 26, a constitutively active orphan GPCR that is predominantly expressed in the brain (30) and that has been shown to be downregulated in glioblastoma (31). In the hypothalamus, Gpr26 was activated by MeCP2 (upregulated in MECP2-Tg and downregulated in Mecp2-null mice) (19). Lrp1b encodes the low-density lipoprotein-related protein 1B (deleted in tumors). It is expressed in the adult brain and was originally described as a putative tumor suppressor in lung cancer cells. In addition, it can bind to amyloid precursor protein (APP) and decrease its processing to amyloid beta peptides (32). Lrp1b is also repressed by MeCP2 in the hypothalamus (19).
Figure 4.
MeCP2 binds to the promoter regions of an activated (Gpr26) and a repressed (Lrp1b) target gene. ChIP with antibody to MeCP2 detects MeCP2 binding to the promoter region of two novel targets. QPCR values were normalized to the input and plotted as relative enrichment over Mecp2-null (n = 3, *P < 0.05).
Gene ontology analysis revealed higher similarity in function and structure of genes that are upregulated than those downregulated by MeCP2
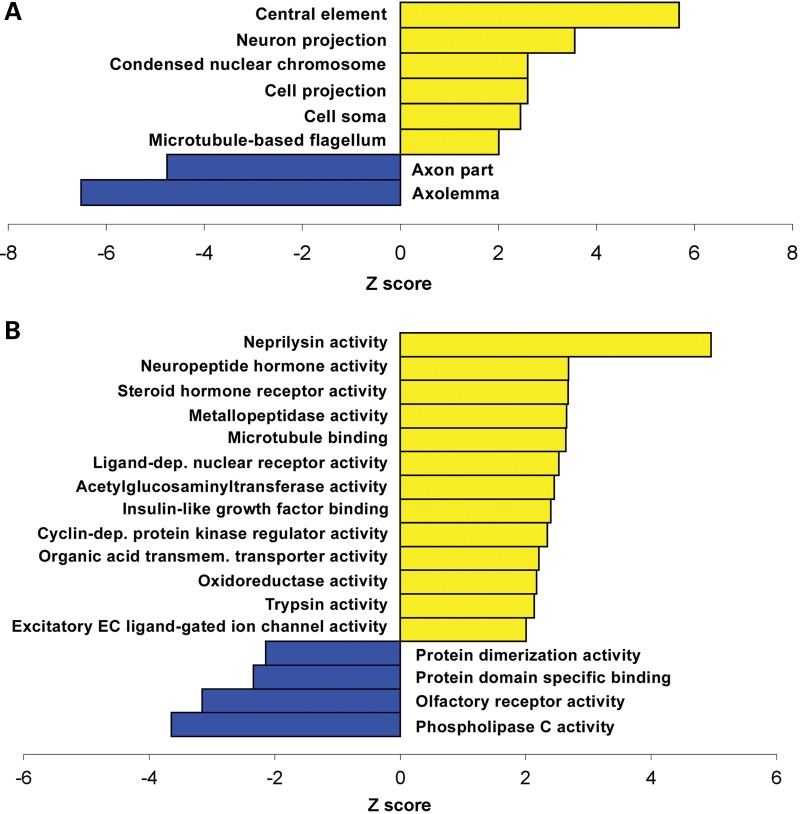
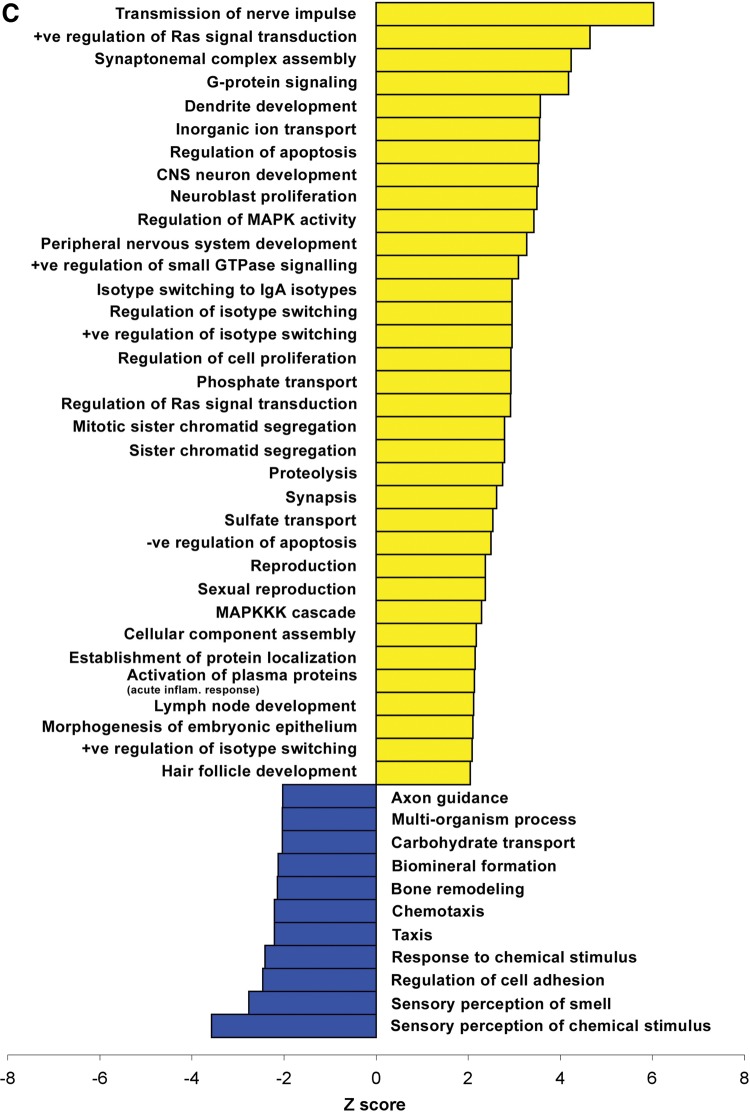
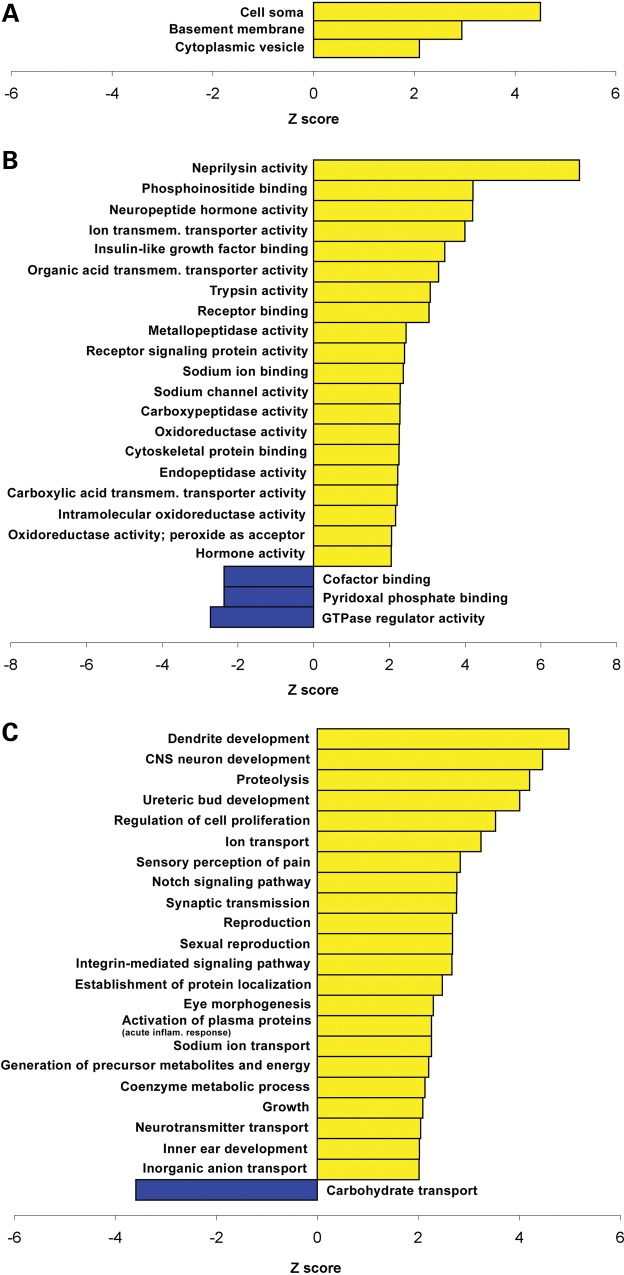
We analyzed the gene ontology (GO) of the transcripts altered in cerebella of models of MeCP2 disorders. The analysis included only the genes that were altered in both MECP2-Tg and Mecp2-null mice in opposite directions. Interestingly, on the basis of all of the categories (cellular component, biological process and molecular function), we found that genes upregulated by MeCP2 are more likely to be associated with specific processes and GO terms compared with downregulated genes, suggesting an increased structure or function relatedness between putatively activated target genes compared with repressed genes (Fig. 5A–C). Some of the categories specifically enriched in the list of upregulated targets include: transmission of nerve impulse, dendrite development and neuroblast proliferation.
Figure 5.
Gene ontology analysis performed on genes that are differentially expressed in cerebella of MECP2-Tg and Mecp2-null mice. Cellular component (A), molecular function (B) and biological process (C) categories that differ significantly between the genes activated by MeCP2 (yellow) and those repressed by MeCP2 (blue) are plotted. The standardized scores (Z values) are presented on the x-axis, and significance was determined by a Z-value of more than ± 2 and a count of at least two genes. +ve, positive; −ve, negative; CNS, central nervous system; inflam., inflammatory; dep., dependent; transmem., transmembrane; EC, extracellular.
Multiple gene expression changes in MeCP2 disorder mouse models are common to the hypothalamus and cerebellum
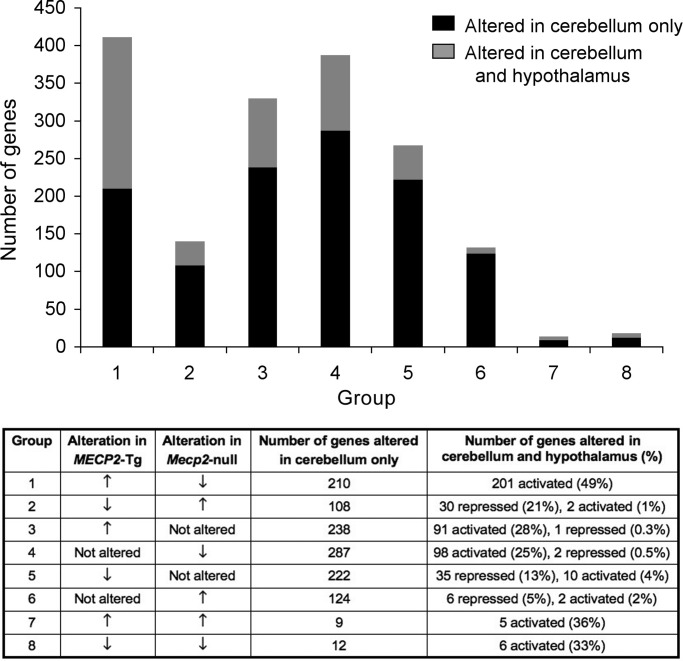
To determine if the altered genes are region-specific, we compared the changes observed in the cerebellum to those previously reported in the hypothalamus (19). We found that out of the 583 genes commonly altered in cerebella of both MECP2-Tg and Mecp2-null mice, 244 genes were also altered in the hypothalamus, suggesting that MeCP2 regulates or affects the expression of some genes in both brain regions. The degree of overlap between altered genes was significantly higher for those that are misregulated in opposite directions in the MECP2-Tg and Mecp2-null mice than for genes altered only in one disease model (Fig. 6). This finding suggests that genes that are inversely altered in both models may be more relevant to the disease in terms of their broader effect, possibly as a consequence of being direct targets of MeCP2. Moreover, we found that the degree of overlap between cerebellum and hypothalamus is higher (49%) for genes that are predicted to be activated in the presence of MeCP2 compared with genes that are predicted to be repressed (21%). This is consistent with the higher rate of activated genes and might suggest that among the activated genes there are candidates that may play an important role in the pathogenesis of MeCP2 disorders. GO analysis of genes misregulated in both the cerebellum and hypothalamus revealed that for all the categories (cellular component, biological process and molecular function), genes upregulated by MeCP2 are associated with specific GO terms, compared with those downregulated by MeCP2 (Fig. 7A–C). In addition, we compared our gene lists (Supplementary Material, Tables S1–S6) to those from various published studies (33–37), and found very little overlap between these genes, and the direction of change was not always consistent (Supplementary Material, Table S7). This is not surprising given that these studies used different analysis methods and were performed on different tissues: post-mortem brain tissue from RTT patients (33), single cell-derived WT and mutant MECP2 expressing fibroblast clones (34), patient T lymphocytes (35), Mecp2-null mouse whole brain (36) and SH-SY5Y neuronal cells induced to differentiate and in which MeCP2 binding to DNA was blocked (37).
Figure 6.
Gene expression changes common to the cerebellum and hypothalamus. Groups 1–8 in the top panel are described in the lower panel. For example, genes in Group 1 are upregulated in MECP2-Tg and downregulated in Mecp2-null mice, 201 such genes are altered in both the cerebellum and hypothalamus, and activated in the hypothalamus.
Figure 7.
Gene ontology analysis performed on genes that are differentially expressed in cerebella and hypothalami of MECP2-Tg and Mecp2-null mice. Cellular component (A), molecular function (B) and biological process (C) categories that differ significantly between the genes activated by MeCP2 (yellow) and those repressed by MeCP2 (blue) are plotted. The standardized scores (Z-values) are presented on the x-axis, and significance was determined by a Z-value of more than ± 2 and a count of at least two genes. CNS, central nervous system; inflam., inflammatory; transmem., transmembrane.
DISCUSSION
MeCP2 disorders comprise a wide variety of neurodevelopmental disorders including RTT, MeCP2 duplication/triplication syndromes and other isolated neurological phenotypes such as mental retardation, juvenile onset schizophrenia and autism. Several studies have pursued the identification of MeCP2 targets or gene expression changes in Mecp2-null mice. Very few significant changes were detected if one is to consider FDR correction in data analysis (22–24). Interestingly, the use of hypothalamic RNA uncovered thousands of gene expression changes in mouse models of MeCP2 disorders (19). The majority of changes had a magnitude of less than ± 1.5-fold, and only ∼2% of genes had changes in the 3–5-fold range. This low magnitude of gene expression changes could explain why one might need to use sensitive methods, such as the exon arrays (with multiple probes per gene), to detect gene expression differences. Although earlier attempts to detect gene expression alterations in whole brain, cerebellum and cortex of RTT mouse models only uncovered a few target genes (23), the fact that cerebellar function is essential for normal movement and coordination and because RTT mouse models have widespread morphological changes in the brain, including the cerebellum, (38), led us to evaluate the patterns of cerebellar gene expression in mouse models of MeCP2 disorders.
Our study detected hundreds of gene expression alterations in the cerebella of both Mecp2-null and MECP2-Tg mice, using a very stringent FDR-corrected P < 0.05. The majority of these changes demonstrated that there is transcriptional repression (rather than derepression) in the absence of MeCP2. As observed in the hypothalamus, the majority of the fold changes in the cerebellum were small, with one exception being the change observed for Prlf2. A similar small magnitude of change in MeCP2 target genes was also detected using ISH studies (39,40); suggesting that MeCP2 modulates gene expression and fine-tunes levels of its target genes rather than causing large fold changes. Although the fold changes in gene expression are mostly 50% more or less than WT, such changes are likely to be quite significant functionally. Human studies are teaching us that a 50% decrease or increase in gene copy number is sufficient to cause a variety of neuropsychiatric disorders that have overlapping symptoms with RTT and MeCP2 duplication syndrome. Interestingly, we identified genes that are altered in both the cerebellum and the hypothalamus. Furthermore, we found that the greatest overlap in gene expression profiles between the brain regions occurred with the group of genes that are activated rather than repressed. The genes putatively activated by MeCP2 in both the cerebellum and hypothalamus code for proteins involved in neuronal development, synaptic transmission and neurotransmitter transport; processes that are potentially disrupted in RTT and MeCP2 duplication syndrome, and could account for some of the phenotypes observed in MeCP2 disorders. Since MeCP2 is expressed in both brain regions, it is not surprising that it affects the levels of some genes in both regions. What is notable is that almost all of the gene expression changes that occur in both brain regions share directionality. We also compared our data with data generated from other gene expression studies (see Supplementary Material, Table S7). We found that six genes, Auts2, Enpp2, Fxyd7, Gpr56, Plcb1 and Stx1a, are consistently altered in our datasets and post-mortem RTT patient brain, and mutant fibroblasts and lymphocytes. This is quite interesting given the functions of these genes. Gpr56 is disrupted in patients with bilateral frontoparietal polymicrogyria, a disorder characterized by developmental delay, mental retardation, motor abnormalities, seizures and ataxia (41). Auts2 (autism susceptibility candidate 2) is associated with severe mental retardation with autistic features (42,43), and Stx1a is involved in synaptic vesicle fusion. Although the number of genes altered in the cerebellum (hundreds) was not as prominent as in the hypothalamus (thousands), our study demonstrates that MeCP2 levels affect the expression of hundreds of genes in the cerebellum. Genes that are altered in a region-specific manner in MeCP2 disorder mouse models, probably represent genes with region-specific expression and/or function. The fact that MeCP2-mediated gene expression changes extend beyond the hypothalamus, raises the possibility that genes commonly altered in more than one brain region may be better candidates for future therapeutic strategies in MeCP2 disorders.
MATERIALS AND METHODS
Microarray data analysis
We used the Affymetrix Mouse Exon 1.0 ST microarray, which carries 1.2 million probe sets that cover 1 million exon clusters, with an average of 40 probes per gene. The exon array data were analyzed as previously described (19). Briefly, raw data were processed in the R statistical programming environment using locally developed methods and the exonmap package. Robust multichip average (RMA) normalization was applied, and subsequently, linear models were calculated to analyze genotype effects for each gene. Genomic annotations were obtained from UCSC (http://genome.ucsc.edu). The normalized probe level data were then averaged within each exon to produce exon level data for each gene for each animal. A two-way ANOVA with main effects for genotype and exonic region was calculated for each gene. The ANOVA model was fit using weighted least squares analysis where the weights were determined according to the probe counts within each exon. Since separate WT littermates of different strains were used in the Mecp2-null (C57BL/6J) and MECP2-Tg (FVB) experiments, a separate linear model was estimated for each gene in each strain (one fit for each WT background). A linear contrast was calculated comparing the WT and mutant cross-exon means for each gene. The cutoff rule for determining genes regulated by MeCP2 was a fold change threshold of ± 0.2 in both the MECP2-Tg and the Mecp2-null lists, and a linear step up FDR of <0.05 value for the T-statistic corresponding to the linear contrast comparing each WT strain with its corresponding mutant. The gene set determined by this fold change and FDR multiplicity corrected cutoff, corresponds to a median raw marginal P-value of ∼0.00015 for the underlying T-statistics.
Post-processing of our gene lists was performed to determine their content using GO analysis. The GO vocabulary was obtained from the GO website (9 January 2007 build), and current mouse annotations were also downloaded. The mouse exon array was mapped to entrez identifiers, and these identifiers were mapped to the GO data structure using the available annotations. Using our local ontology analysis system (OntologyTraverser), we tabulated the genes annotated at or below each GO node for the entire exon array. We then used a hypergeometric sampling model to examine the statistical representation of each GO node for genes in our gene sets. In order to make comparisons between sets, we took differences between the standardized scores determined for each gene set. Because of the extreme overlapping structure of the GO, many GO nodes report duplicate or redundant information. To avoid this problem, we calculated the GO covariance structure and used this estimate to compute de-correlated GO scores.
Quantitative real-time RT–PCR
Total RNA was extracted from cerebella of 6-week-old male mice using TRIzol reagent (Invitrogen Corporation, Carlsbad, CA, USA), DNase I treated, and purified using the RNAeasy mini kit according to the manufacturer’s protocol (Qiagen, Valencia, CA, USA). Experiments were performed on three to five mice of each genotype. cDNA was synthesized from 1 µg of RNA using the RT2 First Strand Kit (SuperArray Bioscience Corporation, Frederick, MD, USA). Quantitative real-time PCR reactions were performed on 10 ng of cDNA using RT2 SYBR Green/ROX PCR master mix and commercially available primers (SuperArray Bioscience Corporation). All RNA samples were analyzed in triplicate and normalized relative to Gapdh levels.
Non-radioactive ISH
Sagittal sections from two to three mice of each geotype were analyzed. Tissue preparation and automated ISH were performed as previously described (44–46) and as described online at http://www.genepaint.org/RNA.htm. Prlf2 antisense probe was generated from a cDNA clone. The cDNA template was amplified by PCR and used for in vitro transcription of digoxygenin-labeled riboprobe. We performed quantitative analysis of the ISH signal on sections spanning the cerebellum using the Celldetekt protocol to determine cellular gene expression levels (29).
ChIP
ChIP was performed as previously described (19). Cerebella were dissected from three mice of each genotype at 6 weeks of age and incubated in 1% formaldehyde for 10 min at room temperature to cross-link DNA to associated proteins. Chromatin was prepared and sheared to generate fragments with an average length of ∼100–200 bp, as determined empirically by agarose gel electrophoresis. For immunoprecipitation, 200 µl of chromatin was diluted 1:10 in ChIP dilution buffer (Millipore Corporation, Billerica, MA, USA) and 1% of the diluted sample was set aside for input. The sample was first pre-cleared with protein A Dynabeads (Invitrogen Corporation), then incubated overnight with protein A Dynabeads that were pre-blocked with salmon sperm DNA and 5 µg of rabbit polyclonal anti-MeCP2 antibody (Millipore Corporation). Mock immunoprecipitation with 5 µg of non-specific rabbit immunoglobulin G was included as a control. After immunoprecipitation, the beads were washed sequentially at room temperature with low salt buffer, high salt buffer, LiCl buffer (Millipore Corporation) and TE buffer (10 mm Tris–HCl pH 7.4, 1 mm EDTA pH 8.0). Elution was performed twice in 250 µl of fresh elution buffer (1% SDS, 0.1 m NaHCO3) for 15 min at room temperature. The eluates were combined, the cross-links were reversed and DNA was recovered by standard methods in 30 µl of 10 mm Tris–HCl pH 8.0. One microliter of DNA was used for each quantitative real-time PCR. ChIP experiments were performed in triplicate, and all quantitative real-time PCR experiments were performed in triplicate. The quantitative real-time PCR data were analyzed as previously described (19). Relative proportions of immunoprecipitated DNA were determined on the basis of the threshold cycle value and normalized to the input. Primer and probe sequences used were as follows: Lrp1b: Forward 5′-TGGTGGCCCACAACTTTAATC-3′; Reverse 5′-CCTGGGCATAGAACTCAGATCTTC-3′; Probe FAM-TCTGCCTCTGCATCCTGACTGCTG-BHQ; Gpr26: Forward 5′-TGTCTGGGCACCCTCATGT-3′; Reverse 5′-CAGGTGGACTGGGTCAAGGT-3′; Probe FAM-CCAGTGCTGCTTGTCCCTGC-BHQ.
AUTHOR CONTRIBUTIONS
S.B. and M.C. contributed equally, designed and performed the experiments, and prepared the manuscript, C.T. performed the ISH, C.S. performed the microarray analysis, and H.Y.Z. designed experiments, reviewed the data, and provided input on the manuscript.
SUPPLEMENTARY MATERIAL
FUNDING
This work was funded by NIH/National Institute of Neurological Disorders and Stroke grant NS057819 (H.Z.), National Institute of Child Health and Human Development Mental Retardation and Developmental Disabilities Research Center HD024064 (H.Z.), the International Rett Syndrome Foundation and the Simons Foundation. H.Z. is a Howard Hughes Medical Institute investigator. The microarray data have been deposited in the National Center for Biotechnology Information Gene Expression Omnibus (GEO) (www.ncbi.nlm.nih.gov/geo) and are accessible through GEO Series accession number GSE15574. Funding to pay the Open Access charge was provided by the Howard Hughes Medical Institute.
Supplementary Material
ACKNOWLEDGEMENTS
We thank members of the Zoghbi laboratory for their thoughtful comments. The Baylor College of Medicine Microarray Core Facility performed the microarray experiments.
Conflict of Interest statement. None declared.
REFERENCES
- 1.Amir R.E., Van den Veyver I.B., Wan M., Tran C.Q., Francke U., Zoghbi H.Y. Rett syndrome is caused by mutations in X-linked MECP2, encoding methyl-CpG-binding protein 2. Nat. Genet. 1999;23:185–188. doi: 10.1038/13810. [DOI] [PubMed] [Google Scholar]
- 2.Chahrour M., Zoghbi H.Y. The story of Rett syndrome: from clinic to neurobiology. Neuron. 2007;56:422–437. doi: 10.1016/j.neuron.2007.10.001. [DOI] [PubMed] [Google Scholar]
- 3.Friez M.J., Jones J.R., Clarkson K., Lubs H., Abuelo D., Bier J.A., Pai S., Simensen R., Williams C., Giampietro P.F., et al. Recurrent infections, hypotonia, and mental retardation caused by duplication of MECP2 and adjacent region in Xq28. Pediatrics. 2006;118:e1687–e1695. doi: 10.1542/peds.2006-0395. [DOI] [PubMed] [Google Scholar]
- 4.Lugtenberg D., de Brouwer A.P., Kleefstra T., Oudakker A.R., Frints S.G., Schrander-Stumpel C.T., Fryns J.P., Jensen L.R., Chelly J., Moraine C., et al. Chromosomal copy number changes in patients with non-syndromic X linked mental retardation detected by array CGH. J. Med. Genet. 2006;43:362–370. doi: 10.1136/jmg.2005.036178. [DOI] [PMC free article] [PubMed] [Google Scholar]
- 5.Van Esch H., Bauters M., Ignatius J., Jansen M., Raynaud M., Hollanders K., Lugtenberg D., Bienvenu T., Jensen L.R., Gecz J., et al. Duplication of the MECP2 region is a frequent cause of severe mental retardation and progressive neurological symptoms in males. Am. J. Hum. Genet. 2005;77:442–453. doi: 10.1086/444549. [DOI] [PMC free article] [PubMed] [Google Scholar]
- 6.del Gaudio D., Fang P., Scaglia F., Ward P.A., Craigen W.J., Glaze D.G., Neul J.L., Patel A., Lee J.A., Irons M., et al. Increased MECP2 gene copy number as the result of genomic duplication in neurodevelopmentally delayed males. Genet. Med. 2006;8:784–792. doi: 10.1097/01.gim.0000250502.28516.3c. [DOI] [PubMed] [Google Scholar]
- 7.Hagberg B., Aicardi J., Dias K., Ramos O. A progressive syndrome of autism, dementia, ataxia, and loss of purposeful hand use in girls: Rett’s syndrome: report of 35 cases. Ann. Neurol. 1983;14:471–479. doi: 10.1002/ana.410140412. [DOI] [PubMed] [Google Scholar]
- 8.Mount R.H., Charman T., Hastings R.P., Reilly S., Cass H. The Rett syndrome behaviour questionnaire (RSBQ): refining the behavioural phenotype of Rett syndrome. J. Child Psychol. Psychiatry. 2002;43:1099–1110. doi: 10.1111/1469-7610.00236. [DOI] [PubMed] [Google Scholar]
- 9.Neul J.L., Fang P., Barrish J., Lane J., Caeg E.B., Smith E.O., Zoghbi H., Percy A., Glaze D.G. Specific mutations in methyl-CpG-binding protein 2 confer different severity in Rett syndrome. Neurology. 2008;70:1313–1321. doi: 10.1212/01.wnl.0000291011.54508.aa. [DOI] [PMC free article] [PubMed] [Google Scholar]
- 10.Christodoulou J., Grimm A., Maher T., Bennetts B. RettBASE: the IRSA MECP2 variation database-a new mutation database in evolution. Hum. Mutat. 2003;21:466–472. doi: 10.1002/humu.10194. [DOI] [PubMed] [Google Scholar]
- 11.Kankirawatana P., Leonard H., Ellaway C., Scurlock J., Mansour A., Makris C.M., Dure L.S., Friez M., Lane J., Kiraly-Borri C., et al. Early progressive encephalopathy in boys and MECP2 mutations. Neurology. 2006;67:164–166. doi: 10.1212/01.wnl.0000223318.28938.45. [DOI] [PubMed] [Google Scholar]
- 12.Meloni I., Bruttini M., Longo I., Mari F., Rizzolio F., D’Adamo P., Denvriendt K., Fryns J.P., Toniolo D., Renieri A. A mutation in the Rett syndrome gene, MECP2, causes X-linked mental retardation and progressive spasticity in males. Am. J. Hum. Genet. 2000;67:982–985. doi: 10.1086/303078. [DOI] [PMC free article] [PubMed] [Google Scholar]
- 13.Dotti M.T., Orrico A., De Stefano N., Battisti C., Sicurelli F., Severi S., Lam C.W., Galli L., Sorrentino V., Federico A. A Rett syndrome MECP2 mutation that causes mental retardation in men. Neurology. 2002;58:226–230. doi: 10.1212/wnl.58.2.226. [DOI] [PubMed] [Google Scholar]
- 14.Guy J., Hendrich B., Holmes M., Martin J.E., Bird A. A mouse Mecp2-null mutation causes neurological symptoms that mimic Rett syndrome. Nat. Genet. 2001;27:322–326. doi: 10.1038/85899. [DOI] [PubMed] [Google Scholar]
- 15.Dani V.S., Chang Q., Maffei A., Turrigiano G.G., Jaenisch R., Nelson S.B. Reduced cortical activity due to a shift in the balance between excitation and inhibition in a mouse model of Rett syndrome. Proc. Natl Acad. Sci. USA. 2005;102:12560–12565. doi: 10.1073/pnas.0506071102. [DOI] [PMC free article] [PubMed] [Google Scholar]
- 16.Shahbazian M., Young J., Yuva-Paylor L., Spencer C., Antalffy B., Noebels J., Armstrong D., Paylor R., Zoghbi H. Mice with truncated MeCP2 recapitulate many Rett syndrome features and display hyperacetylation of histone H3. Neuron. 2002;35:243–254. doi: 10.1016/s0896-6273(02)00768-7. [DOI] [PubMed] [Google Scholar]
- 17.Collins A.L., Levenson J.M., Vilaythong A.P., Richman R., Armstrong D.L., Noebels J.L., David Sweatt J., Zoghbi H.Y. Mild overexpression of MeCP2 causes a progressive neurological disorder in mice. Hum. Mol. Genet. 2004;13:2679–2689. doi: 10.1093/hmg/ddh282. [DOI] [PubMed] [Google Scholar]
- 18.Chao H., Zoghbi H.Y., Rosenmund C. MeCP2 controls excitatory synaptic strength by regulating glutamatergic synapse number. Neuron. 2007;56:1–8. doi: 10.1016/j.neuron.2007.08.018. [DOI] [PMC free article] [PubMed] [Google Scholar]
- 19.Chahrour M., Jung S.Y., Shaw C., Zhou X., Wong S.T., Qin J., Zoghbi H.Y. MeCP2, a key contributor to neurological disease, activates and represses transcription. Science. 2008;320:1224–1229. doi: 10.1126/science.1153252. [DOI] [PMC free article] [PubMed] [Google Scholar]
- 20.Nan X., Meehan R.R., Bird A. Dissection of the methyl-CpG binding domain from the chromosomal protein MeCP2. Nucleic Acids Res. 1993;21:4886–4892. doi: 10.1093/nar/21.21.4886. [DOI] [PMC free article] [PubMed] [Google Scholar]
- 21.Nan X., Campoy F.J., Bird A. MeCP2 is a transcriptional repressor with abundant binding sites in genomic chromatin. Cell. 1997;88:471–481. doi: 10.1016/s0092-8674(00)81887-5. [DOI] [PubMed] [Google Scholar]
- 22.Tudor M., Akbarian S., Chen R.Z., Jaenisch R. Transcriptional profiling of a mouse model for Rett syndrome reveals subtle transcriptional changes in the brain. Proc. Natl Acad. Sci. USA. 2002;99:15536–15541. doi: 10.1073/pnas.242566899. [DOI] [PMC free article] [PubMed] [Google Scholar]
- 23.Jordan C., Li H.H., Kwan H.C., Francke U. Cerebellar gene expression profiles of mouse models for Rett syndrome reveal novel MeCP2 targets. BMC Med. Genet. 2007;8:36. doi: 10.1186/1471-2350-8-36. [DOI] [PMC free article] [PubMed] [Google Scholar]
- 24.Urdinguio R.G., Lopez-Serra L., Lopez-Nieva P., Alaminos M., Diaz-Uriarte R., Fernandez A.F., Esteller M. Mecp2-null mice provide new neuronal targets for Rett syndrome. PLoS ONE. 2008;3:e3669. doi: 10.1371/journal.pone.0003669. [DOI] [PMC free article] [PubMed] [Google Scholar]
- 25.Chen W.G., Chang Q., Lin Y., Meissner A., West A.E., Griffith E.C., Jaenisch R., Greenberg M.E. Derepression of BDNF transcription involves calcium-dependent phosphorylation of MeCP2. Science. 2003;302:885–889. doi: 10.1126/science.1086446. [DOI] [PubMed] [Google Scholar]
- 26.Martinowich K., Hattori D., Wu H., Fouse S., He F., Hu Y., Fan G., Sun Y.E. DNA methylation-related chromatin remodeling in activity-dependent BDNF gene regulation. Science. 2003;302:890–893. doi: 10.1126/science.1090842. [DOI] [PubMed] [Google Scholar]
- 27.Chang Q., Khare G., Dani V., Nelson S., Jaenisch R. The disease progression of Mecp2 mutant mice is affected by the level of BDNF expression. Neuron. 2006;49:341–348. doi: 10.1016/j.neuron.2005.12.027. [DOI] [PubMed] [Google Scholar]
- 28.Yasui D.H., Peddada S., Bieda M.C., Vallero R.O., Hogart A., Nagarajan R.P., Thatcher K.N., Farnham P.J., Lasalle J.M. Integrated epigenomic analyses of neuronal MeCP2 reveal a role for long-range interaction with active genes. Proc. Natl Acad. Sci. USA. 2007;104:19416–19421. doi: 10.1073/pnas.0707442104. [DOI] [PMC free article] [PubMed] [Google Scholar]
- 29.Carson J.P., Eichele G., Chiu W. A method for automated detection of gene expression required for the establishment of a digital transcriptome-wide gene expression atlas. J. Microsc. 2005;217:275–281. doi: 10.1111/j.1365-2818.2005.01450.x. [DOI] [PubMed] [Google Scholar]
- 30.Jones P.G., Nawoschik S.P., Sreekumar K., Uveges A.J., Tseng E., Zhang L., Johnson J., He L., Paulsen J.E., Bates B., et al. Tissue distribution and functional analyses of the constitutively active orphan G protein coupled receptors, GPR26 and GPR78. Biochim. Biophys. Acta. 2007;1770:890–901. doi: 10.1016/j.bbagen.2007.01.013. [DOI] [PubMed] [Google Scholar]
- 31.Carter A.N., Cole C.L., Playle A.G., Ramsay E.J., Shervington A.A. GPR26: a marker for primary glioblastoma? Mol. Cell. Probes. 2008;22:133–137. doi: 10.1016/j.mcp.2007.10.002. [DOI] [PubMed] [Google Scholar]
- 32.Cam J.A., Zerbinatti C.V., Knisely J.M., Hecimovic S., Li Y., Bu G. The low density lipoprotein receptor-related protein 1B retains beta-amyloid precursor protein at the cell surface and reduces amyloid-beta peptide production. J. Biol. Chem. 2004;279:29639–29646. doi: 10.1074/jbc.M313893200. [DOI] [PubMed] [Google Scholar]
- 33.Colantuoni C., Jeon O.H., Hyder K., Chenchik A., Khimani A.H., Narayanan V., Hoffman E.P., Kaufmann W.E., Naidu S., Pevsner J. Gene expression profiling in postmortem Rett Syndrome brain: differential gene expression and patient classification. Neurobiol. Dis. 2001;8:847–865. doi: 10.1006/nbdi.2001.0428. [DOI] [PubMed] [Google Scholar]
- 34.Traynor J., Agarwal P., Lazzeroni L., Francke U. Gene expression patterns vary in clonal cell cultures from Rett syndrome females with eight different MECP2 mutations. BMC Med. Genet. 2002;3:12. doi: 10.1186/1471-2350-3-12. [DOI] [PMC free article] [PubMed] [Google Scholar]
- 35.Delgado I.J., Kim D.S., Thatcher K.N., LaSalle J.M., Van den Veyver I.B. Expression profiling of clonal lymphocyte cell cultures from Rett syndrome patients. BMC Med. Genet. 2006;7:61. doi: 10.1186/1471-2350-7-61. [DOI] [PMC free article] [PubMed] [Google Scholar]
- 36.Kriaucionis S., Paterson A., Curtis J., Guy J., Macleod N., Bird A. Gene expression analysis exposes mitochondrial abnormalities in a mouse model of Rett syndrome. Mol. Cell. Biol. 2006;26:5033–5042. doi: 10.1128/MCB.01665-05. [DOI] [PMC free article] [PubMed] [Google Scholar]
- 37.Peddada S., Yasui D.H., LaSalle J.M. Inhibitors of differentiation (ID1, ID2, ID3 and ID4) genes are neuronal targets of MeCP2 that are elevated in Rett syndrome. Hum. Mol. Genet. 2006;15:2003–2014. doi: 10.1093/hmg/ddl124. [DOI] [PMC free article] [PubMed] [Google Scholar]
- 38.Belichenko N.P., Belichenko P.V., Li H.H., Mobley W.C., Francke U. Comparative study of brain morphology in Mecp2 mutant mouse models of Rett syndrome. J. Comp. Neurol. 2008;508:184–195. doi: 10.1002/cne.21673. [DOI] [PubMed] [Google Scholar]
- 39.Fyffe S.L., Neul J.L., Samaco R.C., Chao H.T., Ben-Shachar S., Moretti P., McGill B.E., Goulding E.H., Sullivan E., Tecott L.H., et al. Deletion of Mecp2 in Sim1-expressing neurons reveals a critical role for MeCP2 in feeding behavior, aggression, and the response to stress. Neuron. 2008;59:947–958. doi: 10.1016/j.neuron.2008.07.030. [DOI] [PMC free article] [PubMed] [Google Scholar]
- 40.McGill B.E., Bundle S.F., Yaylaoglu M.B., Carson J.P., Thaller C., Zoghbi H.Y. Enhanced anxiety and stress-induced corticosterone release are associated with increased Crh expression in a mouse model of Rett syndrome. Proc. Natl Acad. Sci. USA. 2006;103:18267–18272. doi: 10.1073/pnas.0608702103. [DOI] [PMC free article] [PubMed] [Google Scholar]
- 41.Piao X., Hill R.S., Bodell A., Chang B.S., Basel-Vanagaite L., Straussberg R., Dobyns W.B., Qasrawi B., Winter R.M., Innes A.M., et al. G protein-coupled receptor-dependent development of human frontal cortex. Science. 2004;303:2033–2036. doi: 10.1126/science.1092780. [DOI] [PubMed] [Google Scholar]
- 42.Sultana R., Yu C.E., Yu J., Munson J., Chen D., Hua W., Estes A., Cortes F., de la Barra F., Yu D., et al. Identification of a novel gene on chromosome 7q11.2 interrupted by a translocation breakpoint in a pair of autistic twins. Genomics. 2002;80:129–134. doi: 10.1006/geno.2002.6810. [DOI] [PubMed] [Google Scholar]
- 43.Kalscheuer V.M., FitzPatrick D., Tommerup N., Bugge M., Niebuhr E., Neumann L.M., Tzschach A., Shoichet S.A., Menzel C., Erdogan F., et al. Mutations in autism susceptibility candidate 2 (AUTS2) in patients with mental retardation. Hum. Genet. 2007;121:501–509. doi: 10.1007/s00439-006-0284-0. [DOI] [PubMed] [Google Scholar]
- 44.Carson J.P., Thaller C., Eichele G. A transcriptome atlas of the mouse brain at cellular resolution. Curr. Opin. Neurobiol. 2002;12:562–565. doi: 10.1016/s0959-4388(02)00356-2. [DOI] [PubMed] [Google Scholar]
- 45.Visel A., Thaller C., Eichele G. GenePaint.org: an atlas of gene expression patterns in the mouse embryo. Nucleic Acids Res. 2004;32:D552–D556. doi: 10.1093/nar/gkh029. [DOI] [PMC free article] [PubMed] [Google Scholar]
- 46.Yaylaoglu M.B., Titmus A., Visel A., Alvarez-Bolado G., Thaller C., Eichele G. Comprehensive expression atlas of fibroblast growth factors and their receptors generated by a novel robotic in situ hybridization platform. Dev. Dyn. 2005;234:371–386. doi: 10.1002/dvdy.20441. [DOI] [PubMed] [Google Scholar]
Associated Data
This section collects any data citations, data availability statements, or supplementary materials included in this article.


