

Abstract
While the majority of axonal organization is established by birth in mammalian brains, axonal wiring and pruning processes, as well as myelination, are known to extend to the postnatal periods, where environmental stimuli often play a major role. Normal axonal and myelin development of individual white matter tracts of human in this period is poorly understood and may have a major role in cognitive development of human. In this study, we applied diffusion tensor imaging and normalization-based population analyses to 44 preteen children and 30 adult images. We observed highly significant changes of fiber orientations at regions that correspond to the superior longitudinal fasciculus during the first five years. The result is attributed to slow axonal and/or myelin maturation of this tract, which is believed to be involved in language functions.
Introduction
The mammalian central nervous system undergoes a complicated but well-coordinated development process. For humans, much of the axonal organization is established by birth but maturation is known to continue well after birth. For example, the myelination process is known to be highly active in the first two years and to extend into adolescence (Kinney et al., 1988). Axonal growth and targeting start in the early embryonic stages and its molecular basis has been actively studied in the last decade using mouse models, e.g. (Braisted et al., 2000). This axonal growth is still very active in the third gestational trimester in the human brain and recent histology-based studies have shown evidence of the growth extending to neonatal periods (Haynes et al., 2005). Delineation[SM1] of this neonatal growth of axonal tracts would be of great importance for understanding of normal brain development and proper diagnosis of developmental abnormalities. However, characterization of axonal development of the human brains is an extremely challenging task. Postmortem samples of normal brains in young populations are limited and, even with such samples, there are no reliable histology-based techniques that can quantitatively assess the axonal architecture of the entire brains.
Conventional MRI has been used to monitor the myelination process (Girard et al., 1991; Ballesteros et al., 1993), but it has been difficult to delineate the status of individual white matter tract. The introduction of diffusion tensor imaging (DTI) has changed this situation. By allowing us to estimate dominant axonal fiber orientation at each pixel, it can capture the status of axonal organization of the entire brain non-invasively within a clinically-feasible time (Makris et al., 1997; Pajevic and Pierpaoli, 1999; Catani et al., 2002; Wakana et al., 2004; Mori et al., 2005). This technique has recently been applied to developing brains, delineating early neural structures such as neuroepithelium, cortical plate, subplate, and ganglionic eminence (Neil et al., 1998; Baratti et al., 1999; Mori et al., 2001; Zhang et al., 2003; Maas et al., 2004). Postnatal studies have also shown axonal and myelin maturation process and their abnormalities (Huppi et al., 1998; Neil et al., 1998; Huppi and Inder, 2001; Hoon et al., 2002; McKinstry et al., 2002; Miller et al., 2002; Mukherjee et al., 2002; Partridge et al., 2004; Schneider et al., 2004; Lee et al., 2005; Thomas et al., 2005; Hermoye et al., 2006).
DTI is an MRI-based technique, which measures the directional dependence of water molecule diffusion (Basser et al., 1994; Basser and Pierpaoli, 1996). Inside the brain, water molecules tend to diffuse faster along axonal tracts than perpendicular to them, and thus in white matter, the diffusion constants depend on the measurement orientation (called “anisotropic diffusion”) (Moseley et al., 1990; Pierpaoli and Basser, 1996; Beaulieu, 2002). Two important parameters we can obtain from DTI are: 1) anisotropy maps, showing which region has higher diffusion anisotropy (indicating well-aligned axonal fibers) and 2) orientation of the axonal fibers, assuming fiber orientation coincides with the axis of highest diffusion in the pixel (this orientation is called V1 hereafter). The[SM2] main purpose of the study is to see if there is macroscopic changes in brain anatomy that can be delineated by DTI during the postnatal period and, if so, to quantitatively characterize such changes. For this end, we used a normalization-based approach to perform group analyses of changes in diffusion anisotropy and fiber orientations during early childhood.
Experimental Procedures
Subjects
This study was approved by Institutional Review Board of all participating sites. Before imaging, written informed consent was obtained from each pediatric subject's parents or adult subject. We collected DTI scans of 44 pediatric subjects (neonates – 10 years old) and 30 adult subjects (20 – 46 years old). The neonates were scanned while they were sleeping without anesthesia. Because of the need for anesthesia, the data from the subjects aged 3 to 48 months were obtained from pediatric patients with clinical indications for MR examinations. All pediatric patients with[SM3] the clinical indications (3- 48 months) were inspected by a pediatric neurologist to rule out developmental abnormalities, and these data are marked as “quasi-normal” in this paper. The clinical indications were pathologies related to the internal ear, the orbits, the spine, fit, trauma, infectious disease, genetic disease, and vascular/cisternal malformation. Patients with suspected developmental delay were not included in the study. All the subjects were full-term.
MRI Acquisition
The images were acquired with a SENSE head coil on 1.5 Tesla whole-body MR scanners (Philips Medical Systems, Best, The Netherlands) fitted with explorer gradients (60 mT/m). For DTI acquisitions, a single-shot spin echo - echo planar sequence (SE-EPI) was used, with diffusion gradients applied in 32 non-collinear directions. Fifty axial slices were acquired, parallel to the AC-PC line. The imaging parameters were: reconstruction matrix = 256 × 256, TR > 6,000 ms, TE > 80 ms, diffusion b-value = 700 s/mm2, SENSE reduction factor = 2.5. Field of view (FOV) and image matrix were dynamically changed based on the size of subjects ranging from 150 × 150 mm to 240 × 240 for the FOV and 80 × 80 to 96 × 96 for imaging matrix. The slice thickness was adjusted to obtain isotropic resolution from 1.9 to 2.5 mm. To improve the signal to noise ratio, this sequence was executed twice, leading to a total acquisition time of 10 minutes.
Data Analysis
Images were processed with DTI studio (H. Jiang and S. Mori, Johns Hopkins University School of Medicine, http://lbam.med.jhmi.edu or http://godzilla.kennedykrieger.org). Average diffusion weighted (DW) images were obtained by adding all diffusion-weighted images. Diffusion tensor was calculated using a log-linear regression method, and three pairs of eigenvalues and eigenvectors were determined for each pixel (Basser and Pierpaoli, 1996). The eigenvectors associated with the largest, median and smallest eigenvalues (λ1, λ2, and λ3 respectively) were referred to as the primary (V1), secondary (V2) or tertiary eigenvectors (V3) respectively. Diffusion anisotropy was quantitatively measured by fractional anisotropy (FA) (Basser and Pierpaoli, 1996). Color-coded orientation map images were generated by combining the images of V1 and FA into RGB images, in which the ratio among R(ed), G(reen), and B(lue) components of each pixel was the ratio of the absolute values of x, y, and z components of V1 respectively, and the intensity was proportional to FA. Red was assigned to the medial-lateral axis, green to the anterior-posterior axis, and blue to the superior-inferior axis.
Normalization to the ICBM-MNI coordinate
We used the automated image registration (AIR) software(Woods et al., 1998) to normalize DW images from each subject to a template image (ICBM-MNI 152), the average of 152 T1-weighted stereotaxic volumes from the ICBM project, using 12-mode affine transformation. For each subject, an intensity threshold for excluding skull signal and background noise was carefully chosen to ensure good matching between the normalized images and template, and the results were visually inspected. The affine transformations derived from DW images were then applied to the diffusion tensor images using a method that includes tensor reorientation (Xu et al., 2003). After normalization, average diffusion tensor images of each group were computed by averaging normalized diffusion tensor images from all subjects.
Statistical Analysis
The pediatric data were grouped as follows: neonates (n=8), 3-12 months (n = 7, quasi-normal), 13-24 months (n = 12, quasi-normal), 25-60 months (n = 9, quasi-normal), and 61-120 months (n = 8, normal). Data from adult volunteers were grouped into one adult group (n=30, 20 – 40 year old). Pixel by pixel comparisons on tissue orientation in the ICBM-MNI coordinate were performed between the adult group and pediatric groups. We computed the angle α between V1 of the pixel in a normalized subject image (V1S) and the V1 of the same pixel in the average adult brain images (V1A), as For each pixel, values of α from all subjects in a pediatric group were compared to values from the adult subjects using the Wilcoxon Rank-Sum test (IDL, Research System Inc., Boulder, CO, USA). To identify clusters of pixels with significant change in α, we generated a binary map by applying a threshold mask (p < 0.05) and performed morphological smoothing by using 2 × 2 × 2 mm3 cubic structuring element (IDL, ITT Visual Information Solutions, Boulder, CO, USA). The coordinates of the center of the identified mass were then reported in the MNI coordinate system.
For selected brain areas (the superior longitudinal fasciculus (SLF) and the corona radiata (CR)), regions of interest were manually defined and age-dependency of FA and angle α were studied. The data were fitted to exponential or linear regression using SigmaPlot (Systat Software, Inc., San Jose, CA, USA), which provided the correlation coefficient (R), adjusted R square, estimated coefficients and their significance, 95% confidence bands and 95% prediction bands.
Projection of Vector Data into Equal-area Scatter Plot
In polar coordinate, an eigenvector can be represented by its colatitude angle (θ, the angle between the vector and the z axis in the laboratory coordinate) and its longitude angle (ϕ, the clockwise angle between the vector and the x axis in the laboratory coordinate). To visualize the distribution of vectors, we use the so-called Lambert projection (Fisher et al., 1987), which maps a vector (θ, ϕ, 1) in 3D polar coordinate to a point in a unit circle. The Lambert projection is an equal-area projection that preserves the densities of points, and therefore is well suited for examination of vector distribution.
Results
To remove global differences in size and shape of individual brains, the ADC, FA and fiber orientation maps of all subjects were spatially normalized to the adult ICBM152 template using a 12-mode linear transformation (Fig. 1) (Woods et al., 1998). The fiber orientation maps were reoriented accordingly (Xu et al., 2003). After normalization, whole brain fiber orientations in pediatric subjects were compared statistically with those of adults (Fig. 2).
Fig. 1.
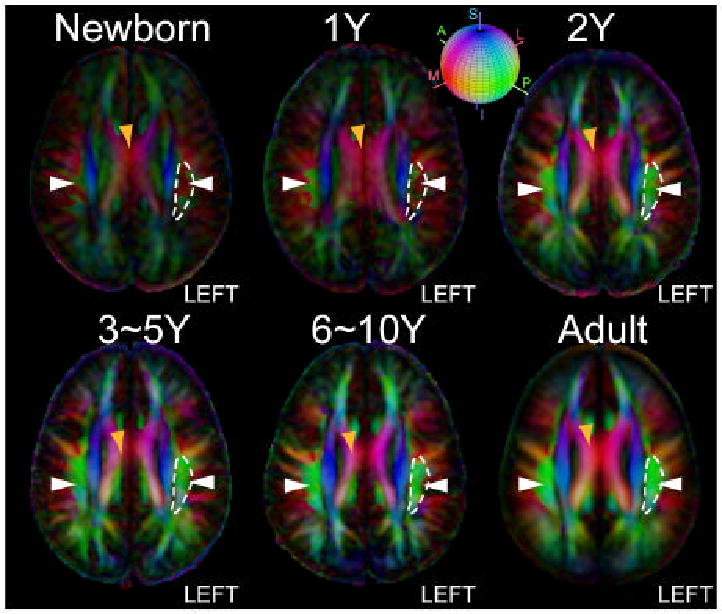
Axial color-coded orientation map images of the average brains from neonate to adult normalized to the ICBM152 coordinate. Orientation of axonal fibers (V1) is visualized using color according to the red-green-blue sphere shown on the top with red indicating medial-lateral (M/L), green anterior-posterior (A/P) and blue superior-inferior (S/I) axis. Morphological changes of the SLF (green structure, white arrow) are more pronounced than other association pathways. To demonstrate the morphological changes in SLF, manually defined boundary of the left SLF (white curves, located on the right side in the radiological coordinate) in an axial slice of adult brains are overlaid on axial slices in pediatric brains. The coronal and axial slides are taken at z = 28 mm in the MNI coordinate system.
Fig. 2.
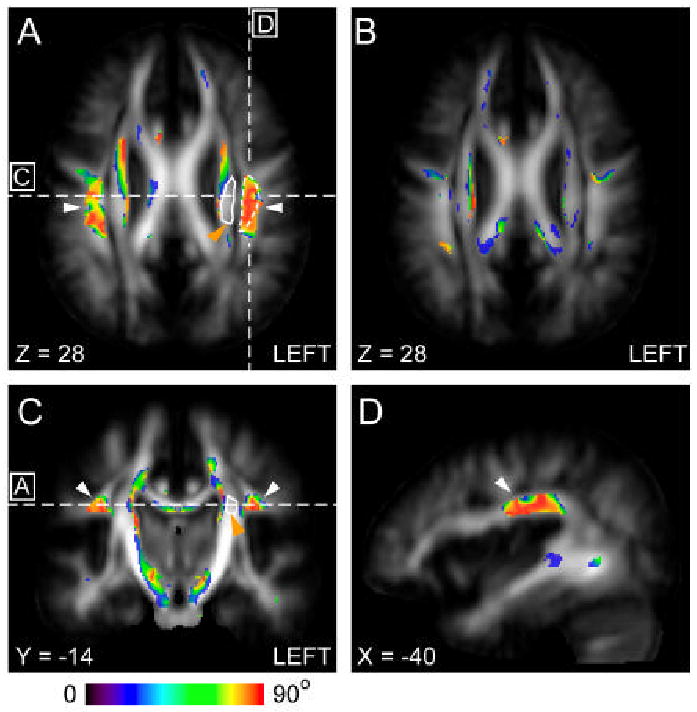
Brain regions with significant difference in fiber orientation (V1) as measured from the adult values during the first years. Significant changes in V1 (p < 0.05) between neonates and adult subjects(A), and between 1 year old and adult subjects(B) are color-coded based on angle change (ΔV1) and superimposed on the average FA image of adult population in the ICBM152 coordinates (z = 28 mm). Locations of the SLF (white arrow) and the neighboring corona radiata (orange arrow) are indicated by white broken and solid lines respectively, which are used for ROI-based analysis in Fig. 5. Coronal (C) and sagittal (D) images show the locations with significant change in V1 between neonates and adult subjects. The lines in (A) indicate the levels of the sections in (C) and (D). The line in (C) indicates the level of the sections displayed in (A) and (B). In (A) and (C - D), the SLF areas are indicated by white arrows.
The analysis revealed significant changes (p < 0.05) between the neonates[SM4] and adults in several white matter regions. In Table 1, we tabulated brain regions where we found clusters of significant changes and identified MNI coordinates of the center of the mass of the clusters. These regions include a portion of the corona radiata, the superior longitudinal fasciculus, the cerebral peduncle, and the sagittal stratum. Because these statistical differences could be due to registration error between two different age groups, we inspected these coordinates in individual brains. The results indicate that there is clear difference in the superior longitudinal fasciculus (SLF, coordinate [±40, -14, 28] in Fig. 2) in all neonates[SM5] (see Fig. 1 and Fig. 3). This complex association tract, which can be identified as a prominent green tract in the color-coded orientation maps in adulthood and late childhood (6-10 years), is difficult to identify in neonates and noticeably small in the 3-12-month old population (Fig. 1) (Hermoye et al., 2006). Measurement of diffusion anisotropy also indicates significantly lower anisotropy in the corresponding regions up to 13-24 months (Fig. 4). To further investigate the age-dependency of DTI parameters, we performed ROI-based analysis, in which the SLF and the neighboring CR (a portion of the CR that did not have significant fiber orientation change) were manually defined in the MNI coordinate (see Fig. 2 for the ROI locations) and FA and angle α were measured. Fig. 5 shows that the FA of the SLF and the CR correlate with age in a very similar manner (three-parameter-exponential model, p < 0.0001, Fig. 5A – 5B). To the contrary, the time courses of the fiber angle are substantially different between these two adjacent fibers. In the neonates, the angle α in the SLF (58.54 ± 10.23 degree) was significantly greater (p < 0.05) than that in the left CR (23.58 ± 6.30 degree), and the SLF has stronger correlation with age (three-parameter exponential model, p < 0.0001, Fig. 5C) with an adjusted R square value of 0.59.
Table[SM10] 1.
A list of major white matter structures that show significant change in V1 between neonates and adult volunteers.
| MNI coordinate*1 (x, y, z) | Volume (mm3)*2 | Angle α (°) | |
|---|---|---|---|
| CR (left)*3 | -22, -2, 28 | 3477 | 55.98 ± 8.21 |
| CR (right) | 23, -2, 28 | 4190 | 59.86 ± 9.81 |
| SLF (left) | -40, -14, 28 | 2639 | 58.54 ± 10.23 |
| SLF (right) | 40, -14, 28 | 1291 | 59.29 ± 10.33 |
| CP (left) | -17, -15, -1 | 835 | 54.23 ± 9.99 |
| CP (right) | 18, -15, -2 | 649 | 55.09 ± 8.53 |
| SS (left) | 27, -59, -3 | 736 | 59.86 ± 9.82 |
| SS (right) | 33, -62, -3 | 654 | 50.48 ± 10.24 |
MNI coordinates at the center of the mass
Only the regions bigger than 300 mm3 are listed.
The abbreviations are: CR: corona radiata; CP: cerebral peduncle; SLF: superior longitudinal fasciculus; SS: sagittal stratum.
Fig. 3.
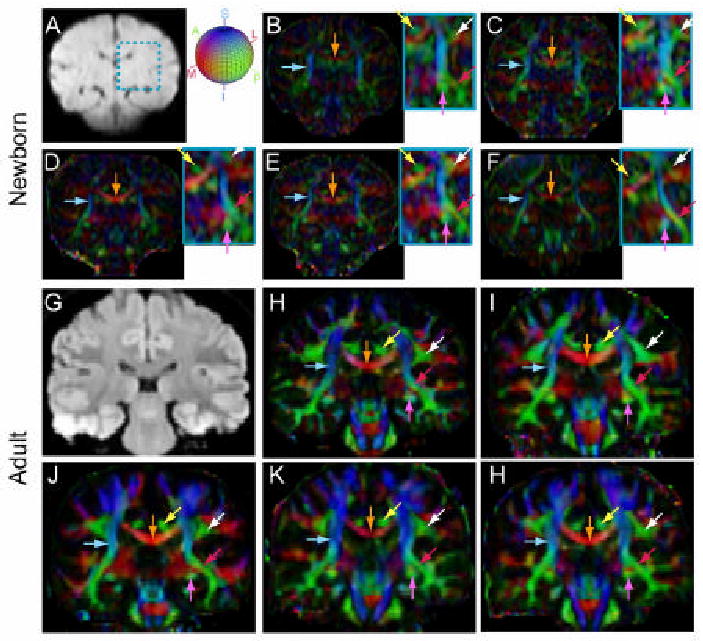
Coronal diffusion tensor color-coded orientation map images from five neonates (top two rows) and five adult volunteers (bottom two rows). Images are selected from three-dimensional volumes at comparable locations. Average diffusion weighted images of a neonate (A) and an adult volunteer (G) are shown as scout images. The light blue rectangular frame in the neonate's scout image marks the region where the SLF and part of the corpus callosum locate. Corresponding regions in each subject is enlarged and contrast enhanced to help identify the SLF. The trajectories of projection fibers (the cortico-spinal tract, light blue arrows), commissural fibers (the corpus callosum, orange arrows), and several association and limbic fibers (cingulum, yellow arrows; fornix and stria terminalis, purple arrows; inferior fronto-occipital fasciculus, red arrows; and superior longitudinal fasciculus (SLF), white arrows). The color-orientation schemes are: red: medial-to-lateral; green: anterior-to-posterior; blue: superior-to-inferior, as indicated by the color-ball next to figure B.
Fig. 4.
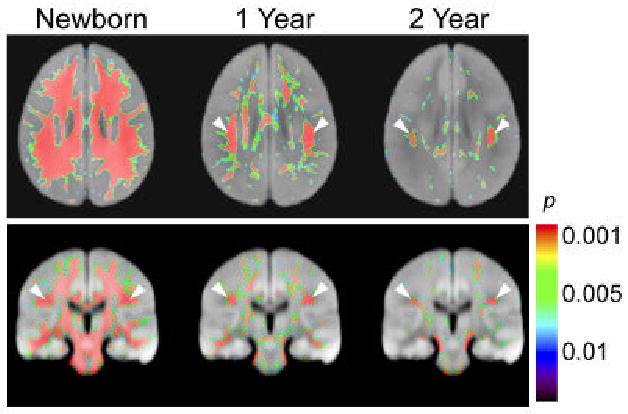
Brain regions with significant difference in FA values from the adult values during the first two years. The thresholded maps of p values are superimposed on axial (top) and coronal (bottom) sections of average diffusion weighted images of adult brains in the ICBM152 coordinate (Z = 28 mm and Y = -24 mm respectively). White arrows indicate the location of the SLF.
Fig. 5.
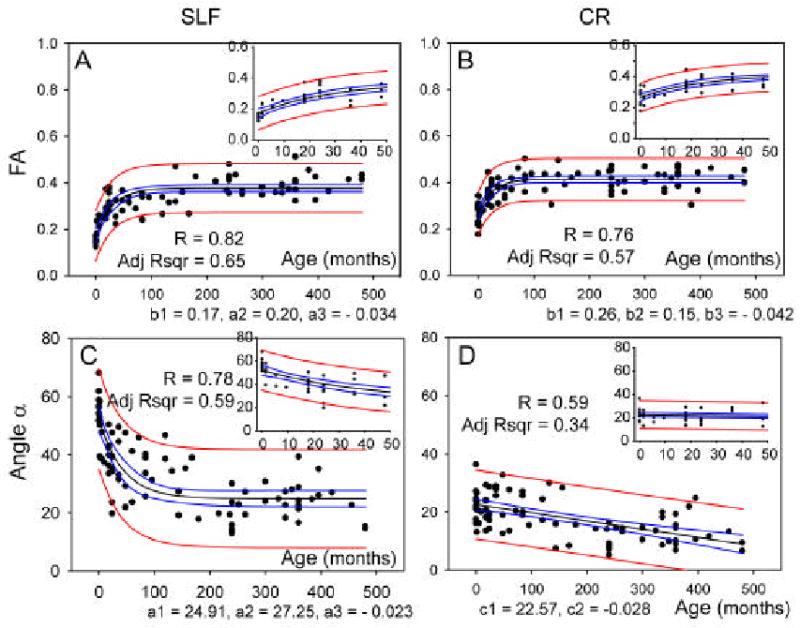
Scatter plots of the average FA and change in orientation (α) in the SLF and corona radiata (CR) as defined in Fig. 2 from birth to 40 years old (480 months). The small insert on the top right corner in each figure shows the values during the first 48 months. For the plots of FA (Fig. A and B), the data are fitted to an exponential curve (FA = b1 + b2 * (1 − exp (b3 * age)), with 95% confidence bands (blue) and 95% prediction bands (red), the estimated parameters (p < 0.0001) are shown below the plots. In the plots of fiber angle in the SLF (Fig. C), the data are fitted to an exponential curve (α = a1 + a2 * exp(a3 * age)), with 95% confidence bands (blue) and 95% prediction bands (red). The estimated parameters (p < 0.0001) are shown below the plots. For the CR (Fig. D), the exponential fitting did not converge and thus linear fitting was used (α =c1,+ c2 * age).
For the pixels in the ROI of the left SLF, fiber orientations, as measured by V1, were examined using a polar histogram after Lambert projection (Fisher et al., 1987) in Fig. 6A. The histograms clearly show that the fiber orientations in the SLF were rather random in the neonates and gradually organized along the anterior-posterior orientation during development. Please note that the DTI-based measurement can not distinguish anterograde and retrograde orientations of axons. Therefore, the two clusters of fibers pointing at 0° and 180° in the adult population have equivalent fiber orientation.
Fig. 6.
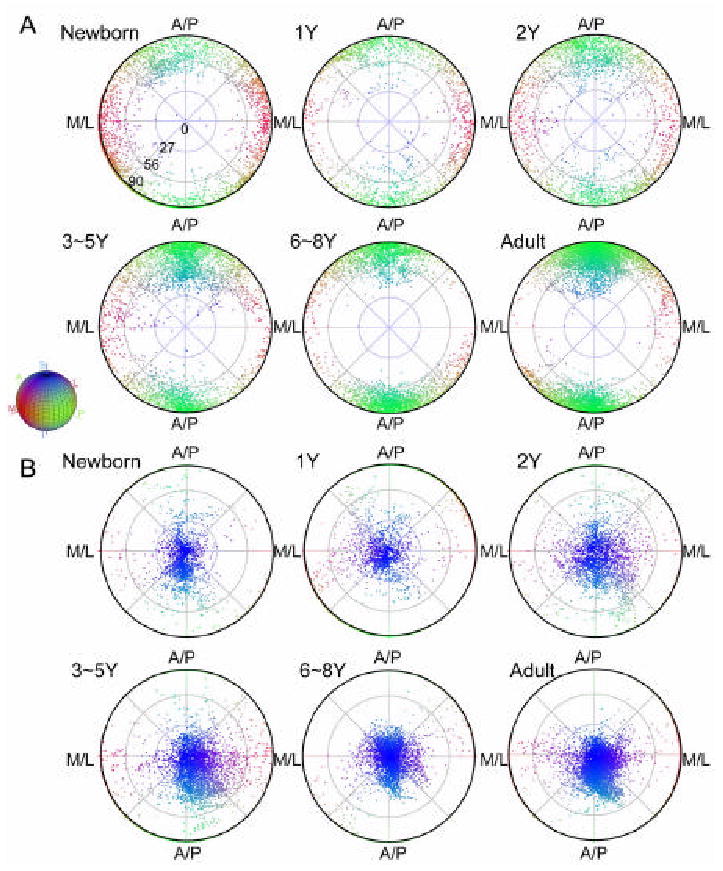
Age-related changes in the distributions of fiber orientations (A: the axis of the fastest diffusion constant, V1) and plane orientations (B: the axis of the slowest diffusion constant, V3) in the left SLF regions defined in adult template (Fig. 1). Distribution of the orientations on a sphere is plotted in 2D using density preserving, equal-area projection. The radial distance of a point indicates the polar angle between its corresponding orientation vector and the superior-inferior axis in the MNI coordinates (0 degree for along the superior-inferior axis and 90 degrees for perpendicular to the superior-inferior axis), while the angular location of a point indicates the polar angle in the plane defined by the anterior-posterior (A/P) and medial-lateral (M/L) axes in the MNI coordinate. Using the same color scheme as in figure 1, points are also color coded according to the orientation they represent. The distribution of fiber orientation in the left SLF (A) revealed gradual aggregation of fiber orientation along the A/P axis (green), while the distribution of plane orientation in same region had consistent orientation along the superior-inferior axis (blue) from birth to adulthood.
Discussions
In this study, we reported slow emergence of the SLF in DTI during brain development. At birth, this tract is not clearly appreciable, which was previously reported (Hermoye et al., 2006; Huang et al., 2006b). It is important to point out that although the SLF can't be clearly identified in the color-coded orientation maps, it need not be totally absent. In this study, higher image resolution (1.9 × 1.9 × 1.9 mm3) was used for neonatal brains compared to elder pediatric data (2.5 × 2.5 × 2.5 mm3), i.e., the voxel volume of the neonatal data is half of that of the pediatric data. However, the brain volumes increase about 4 folds during the first 48 months (Hermoye et al., 2006; Huang et al., 2006b) and thus the “relative resolution”, the resolution with respect to the brain volumes, of our neonatal images is considered to be lower than that of pediatric images. Age-dependent change observed in this study, therefore, could include the contribution of the different relative resolutions and different degree of partial volume effects (PVE). For example, if the fiber architecture of neonates and adult brains are identical except for the size and we use the same absolute resolution, some white matter tracts which have the size similar to or less than the pixel size (1.9 – 2.5 mm for this study) in neonates seem to emerge during the brain development. To prevent this effect, it is ideal to use the same relative resolution (keep the number of pixels within the brain the same) throughout the development stages, although it is not practical due to limitation in SNR. Therefore in our study, we can not preclude the contribution of this type of resolution effects to our findings. However, the size of the SLF in the adult brain is rather large (approximately 100 mm2 at the axial slice shown in Fig. 1) and if the SLF of the same proportion exists in the neonatal brain (∼ 40 mm2), the 1.9 mm resolution should be high enough to identify. Therefore, our observation can not be explained solely by the change in brain size. We[SM6] also would like to point out that our pediatric subjects aged from 3 to 48 months were scanned under sedation. This could potentially introduce some confounding factors e.g., different patterns of motion artifact due to sedation.
DTI can map the fiber orientation in each pixel only when there is only one dominant fiber population with uniform fiber orientation. If pixels contain two crossing fiber tracts of comparable populations, the orientation of V1 becomes unstable (random) while the axis of the tertiary (the slowest) diffusion vector defines the orientation of the fiber-crossing plane. Mapping of the axis of this slowest diffusion constant in the SLF coordinates strongly suggests that this is actually the case (Fig. 6B). The axis of the tertiary vector is along the superior-inferior axis, and is impressively stable throughout the development process. A plausible interpretation is that in neonate brains there is a mixture of fiber populations mostly running within the axial plane, which are likely to be commissural fibers (medial-lateral axis, M/L) and the SLF (anterior-posterior axis, A/P). Within the first two years of development, the SLF continues to develop and its axons gradually surpass commissural fibers and become the dominant fibers in the adult SLF coordinates. If this is the case, our results report an evidence of axonal reorganization in human neonatal brains. An alternative possibility is that the myelination of the SLF is relatively slower and the SLF is appreciable only after a significant amount of myelin is formed. Autopsy studies have shown that myelination of white matter structures proceed quickly during the first 2 years after birth (Kinney et al., 1988). It is possible that both axonal reorganization and myelination occur during the same period and contribute the late appearance of SLF. To fully investigate these possibilities, future postmortem and autopsy studies are necessary.
It has been postulated in postmortem anatomical studies on macaque monkey that the SLF connects several important language areas (Petrides and Pandya, 1984). It is interesting to point out that the distinctive fiber bundles that correspond to the SLF can be clearly identified only in highly developed species (Fig. 7). In these images, the SLF is well developed in macaque (Fig. 7C) and adult human (Fig. 7E), but barely recognizable in marmoset (Fig. 7B) and not appreciable in mouse and human fetus (Fig. 7A and 7D). This strongly suggests involvement of SLF in high-level brain functions. Recent DTI-based 3D tract reconstruction results have also confirmed that its trajectory is closely associated with Broca's area, Wernicke's area, and supramarginal gyrus (Wakana et al., 2004; Catani et al., 2005; Makris et al., 2005). Disruption of the SLF in adulthood has been reported to cause conduction aphasia, further supporting the relationship between this tract and language functions (Alexander et al., 1987; Kreisler et al., 2000). Based[SM7] on relaxation-based measurements of pediatric and adolescent populations (4 - 17 years old), Paus et al reported that the SLF is one of the slowest maturing white matter tracts and related the findings to the extensive use of language during this period life (Paus et al., 1999; Thompson et al., 2000; Bengtsson et al., 2005).
Fig. 7.
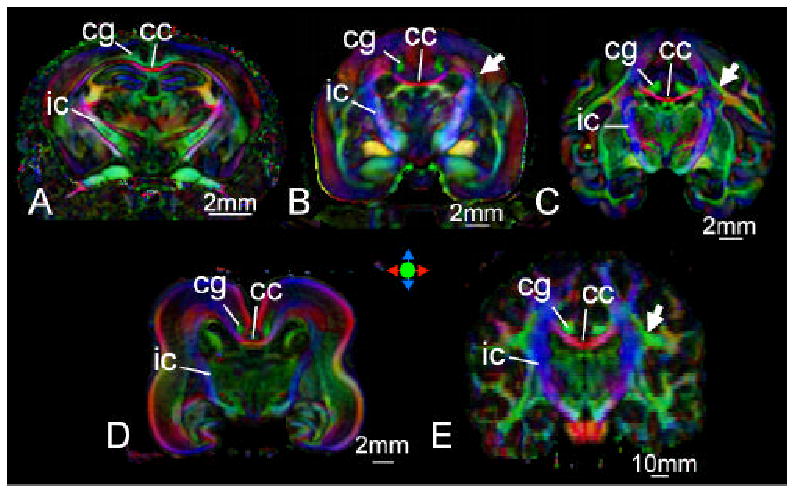
Comparison of neuroanatomy among mouse (A), marmoset (B), macaque (C), human fetus (D, 20 weeks of gestational age), and adult human (E). White matter tracts that can be recognized in all images are annotated; cc: corpus callosum, cg: cingulum, and ic: internal capsule. Arrows indicate locations of fiber bundles correspond to the superior longitudinal fasciculus. All images were obtained from postmortem samples except for the adult human. Detailed[SM9] information about these experiments can be found elsewhere (Zhang et al., 2003; Huang et al., 2006a; Huang et al., 2006b)
In this paper, we used a simple linear transformation for structural normalization. The transformation removes differences in global scale between neonate and adult brains. As a result, only substantial differences in axonal structures can be detected; the quantitative analysis simply confirms what we can appreciate visually. In[SM8] addition, our results are based on small sample sizes. It is highly likely that there are smaller but consistent axonal structural changes during the development, which would require more elaborate registration tools and larger sample sizes to characterize (Paus et al., 1999; Thompson et al., 2000; Bengtsson et al., 2005). The pediatric data used in this study are available at www.pediatricDTI.org and adult data can be obtained from lbam.med.jhmi.edu for further image analyses.
In conclusion, we demonstrated a substantial change of the eigenvectors in brain regions which correspond to the SLF during early childhood. At this point, we can not conclude if this change is due to axonal restructuring or selective myelination of the SLF. To confirm the mechanism of this phenomenon, we need to resort to stereotaxic histology studies. It would be interesting future projects to correlate this development process and abnormalities in high-level brain functions such as language.
Acknowledgments
This research was supported by NIH grants NCRR P41RR15241, P01EB001955, and RO1AG20012. We would like to thank Dr. Mark Walker and Dr. David Zee at the Department of Neurology, Johns Hopkins University School of Medicine for kindly providing us monkey brain samples, and to thank Dr. Arvind P. Pathak at the Department of Radiology, Johns Hopkins University School of Medicine for help in interpretation of statistical data. Dr. Peter C.M. van Zijl is a paid lecturer for Philips Medical Systems. This arrangement has been approved by Johns Hopkins University in accordance with its conflict of interest policies
Footnotes
Publisher's Disclaimer: This is a PDF file of an unedited manuscript that has been accepted for publication. As a service to our customers we are providing this early version of the manuscript. The manuscript will undergo copyediting, typesetting, and review of the resulting proof before it is published in its final citable form. Please note that during the production process errors may be discovered which could affect the content, and all legal disclaimers that apply to the journal pertain.
References
- Alexander MP, Naeser MA, Palumbo CL. Correlations of subcortical CT lesion sites and aphasia profiles. Brain. 1987;110(Pt 4):961–991. doi: 10.1093/brain/110.4.961. [DOI] [PubMed] [Google Scholar]
- Ballesteros MC, Hansen PE, Soila K. MR imaging of the developing human brain. Part 2. Postnatal development. Radiographics. 1993;13:611–622. doi: 10.1148/radiographics.13.3.8316668. [DOI] [PubMed] [Google Scholar]
- Baratti C, Barnett A, Pierpaoli C. Comparative MR imaging study of brain maturation in kittens with t1, t2, and the trace of the diffusion tensor. Radiology. 1999;210:133–142. doi: 10.1148/radiology.210.1.r99ja09133. [DOI] [PubMed] [Google Scholar]
- Basser P, Pierpaoli C. Microstructural and physiological features of tissues elucidated by quantitative-dfifusion-tensor MRI. J Magn Reson B. 1996;111:209–219. doi: 10.1006/jmrb.1996.0086. [DOI] [PubMed] [Google Scholar]
- Basser PJ, Mattiello J, Le Bihan D. MR diffusion tensor spectroscopy and imaging. Biophys J. 1994;66:259–267. doi: 10.1016/S0006-3495(94)80775-1. [DOI] [PMC free article] [PubMed] [Google Scholar]
- Beaulieu C. The basis of anisotropic water diffusion in the nervous system - a technical review. NMR Biomed. 2002;15:435–455. doi: 10.1002/nbm.782. [DOI] [PubMed] [Google Scholar]
- Bengtsson SL, Nagy Z, Skare S, Forsman L, Forssberg H, Ullen F. Extensive piano practicing has regionally specific effects on white matter development. Nat Neurosci. 2005;8:1148–1150. doi: 10.1038/nn1516. [DOI] [PubMed] [Google Scholar]
- Braisted JE, Catalano SM, Stimac R, Kennedy TE, Tessier-Lavigne M, Shatz CJ, O'Leary DD. Netrin-1 promotes thalamic axon growth and is required for proper development of the thalamocortical projection. J Neurosci. 2000;20:5792–5801. doi: 10.1523/JNEUROSCI.20-15-05792.2000. [DOI] [PMC free article] [PubMed] [Google Scholar]
- Catani M, Howard RJ, Pajevic S, Jones DK. Virtual in vivo interactive dissection of white matter fasciculi in the human brain. NeuroImage. 2002;17:77–94. doi: 10.1006/nimg.2002.1136. [DOI] [PubMed] [Google Scholar]
- Catani M, Jones DK, ffytche DH. Perisylvian language networks of the human brain. Ann Neurol. 2005;57:8–16. doi: 10.1002/ana.20319. [DOI] [PubMed] [Google Scholar]
- Fisher NI, Lewis T, Embleton BJ. Statistical analysis of spherical data. Cambridge University Press; New York: 1987. [Google Scholar]
- Girard N, Raybaud C, du Lac P. MRI study of brain myelination. J Neuroradiol. 1991;18:291–307. [PubMed] [Google Scholar]
- Haynes RL, Borenstein NS, Desilva TM, Folkerth RD, Liu LG, Volpe JJ, Kinney HC. Axonal development in the cerebral white matter of the human fetus and infant. J Comp Neurol. 2005;484:156–167. doi: 10.1002/cne.20453. [DOI] [PubMed] [Google Scholar]
- Hermoye L, Saint-Martin C, Cosnard G, Lee SK, Kim J, Nassogne MC, Menten R, Clapuyt P, Donohue PK, Hua K, Wakana S, Jiang H, van Zijl PC, Mori S. Pediatric diffusion tensor imaging: Normal database and observation of the white matter maturation in early childhood. Neuroimage. 2006;29:493–504. doi: 10.1016/j.neuroimage.2005.08.017. [DOI] [PubMed] [Google Scholar]
- Hoon AH, Jr, Lawrie WT, Jr, Melhem ER, Reinhardt EM, Van Zijl PC, Solaiyappan M, Jiang H, Johnston MV, Mori S. Diffusion tensor imaging of periventricular leukomalacia shows affected sensory cortex white matter pathways. Neurology. 2002;59:752–756. doi: 10.1212/wnl.59.5.752. [DOI] [PubMed] [Google Scholar]
- Huang H, Walker M, Ying S, Zee D, Van Zijl P, Mori S. 3D DT-MRI atlas of macaque brain. International Society of Magnetic Resonance in Medicine; Seattle, Washington, USA: 2006a. p. 99. [Google Scholar]
- Huang H, Zhang J, Wakana S, Zhang W, Ren T, Richards LJ, Yarowsky P, Donohue P, Graham E, van Zijl PC, Mori S. White and gray matter development in human fetal, newborn and pediatric brains. Neuroimage. 2006b;33:27–38. doi: 10.1016/j.neuroimage.2006.06.009. [DOI] [PubMed] [Google Scholar]
- Huppi P, Maier S, Peled S, Zientara G, Barnes P, Jolesz F, Volpe J. Microstructural development of human newborn cerebral white matter assessed in vivo by diffusion tensor magnetic resonance imaging. Pediatr Res. 1998;44:584–590. doi: 10.1203/00006450-199810000-00019. [DOI] [PubMed] [Google Scholar]
- Huppi PS, Inder TE. Magnetic resonance techniques in the evaluation of the perinatal brain: recent advances and future directions. Semin Neonatol. 2001;6:195–210. doi: 10.1053/siny.2001.0039. [DOI] [PubMed] [Google Scholar]
- Kinney HC, Brody BA, Kloman AS, Gilles FH. Sequence of central nervous system myelination in human infancy. II. Patterns of myelination in autopsied infants. J Neuropathol Exp Neurol. 1988;47:217–234. doi: 10.1097/00005072-198805000-00003. [DOI] [PubMed] [Google Scholar]
- Kreisler A, Godefroy O, Delmaire C, Debachy B, Leclercq M, Pruvo JP, Leys D. The anatomy of aphasia revisited. Neurology. 2000;54:1117–1123. doi: 10.1212/wnl.54.5.1117. [DOI] [PubMed] [Google Scholar]
- Lee SK, Kim DI, Kim J, Kim DJ, Kim HD, Kim DS, Mori S. Diffusion-tensor MR imaging and fiber tractography: a new method of describing aberrant fiber connections in developmental CNS anomalies. Radiographics. 2005;25:53–65. doi: 10.1148/rg.251045085. discussion 66-58. [DOI] [PubMed] [Google Scholar]
- Maas LC, Mukherjee P, Carballido-Gamio J, Veeraraghavan S, Miller SP, Partridge SC, Henry RG, Barkovich AJ, Vigneron DB. Early laminar organization of the human cerebrum demonstrated with diffusion tensor imaging in extremely premature infants. NeuroImage. 2004;22:1134–1140. doi: 10.1016/j.neuroimage.2004.02.035. [DOI] [PubMed] [Google Scholar]
- Makris N, Kennedy DN, McInerney S, Sorensen AG, Wang R, Caviness VS, Jr, Pandya DN. Segmentation of subcomponents within the superior longitudinal fascicle in humans: a quantitative, in vivo, DT-MRI study. Cereb Cortex. 2005;15:854–869. doi: 10.1093/cercor/bhh186. [DOI] [PubMed] [Google Scholar]
- Makris N, Worth AJ, Sorensen AG, Papadimitriou GM, Reese TG, Wedeen VJ, Davis TL, Stakes JW, Caviness VS, Kaplan E, Rosen BR, Pandya DN, Kennedy DN. Morphometry of in vivo human white matter association pathways with diffusion weighted magnetic resonance imaging. Ann Neurol. 1997;42:951–962. doi: 10.1002/ana.410420617. [DOI] [PubMed] [Google Scholar]
- McKinstry RC, Mathur A, Miller JH, Ozcan A, Snyder AZ, Schefft GL, Almli CR, Shiran SI, Conturo TE, Neil JJ. Radial organization of developing preterm human cerebral cortex revealed by non-invasive water diffusion anisotropy MRI. Cereb Cortex. 2002;12:1237–1243. doi: 10.1093/cercor/12.12.1237. [DOI] [PubMed] [Google Scholar]
- Miller SP, Vigneron DB, Henry RG, Bohland MA, Ceppi-Cozzio C, Hoffman C, Newton N, Partridge JC, Ferriero DM, Barkovich AJ. Serial quantitative diffusion tensor MRI of the premature brain: development in newborns with and without injury. J Magn Reson Imaging. 2002;16:621–632. doi: 10.1002/jmri.10205. [DOI] [PubMed] [Google Scholar]
- Mori S, Itoh R, Zhang J, Kaufmann WE, van Zijl PCM, Solaiyappan M, Yarowsky P. Diffusion tensor imaging of the developing mouse brain. Magn Reson Med. 2001;46:18–23. doi: 10.1002/mrm.1155. [DOI] [PubMed] [Google Scholar]
- Mori S, Wakana S, van Zijl PCM, Nagae-Poetscher LM. MRI atlas of human white matter. Elsevier Science; 2005. [Google Scholar]
- Moseley ME, Cohen Y, Kucharczyk J, Mintorovitch J, Asgari HS, Wendland MF, Tsuruda J, Norman D. Diffusion-weighted MR imaging of anisotropic water diffusion in cat central nervous system. Radiology. 1990;176:439–445. doi: 10.1148/radiology.176.2.2367658. [DOI] [PubMed] [Google Scholar]
- Mukherjee P, Miller JH, Shimony JS, Philip JV, Nehra D, Snyder AZ, Conturo TE, Neil JJ, McKinstry RC. Diffusion-tensor MR imaging of gray and white matter development during normal human brain maturation. AJNR Am J Neuroradiol. 2002;23:1445–1456. [PMC free article] [PubMed] [Google Scholar]
- Neil J, Shiran S, McKinstry R, Schefft G, Snyder A, Almli C, Akbudak E, Arnovitz J, Miller J, Lee B, Conturo T. Normal brain in human newborns: apparent diffusion coefficient and diffusion anisotropy measured by using diffusion tensor MR imaging. Radiology. 1998;209:57–66. doi: 10.1148/radiology.209.1.9769812. [DOI] [PubMed] [Google Scholar]
- Pajevic S, Pierpaoli C. Color schemes to represent the orientation of anisotropic tissues from diffusion tensor data: application to white matter fiber tract mapping in the human brain. Magn Reson Med. 1999;42:526–540. [PubMed] [Google Scholar]
- Partridge SC, Mukherjee P, Henry RG, Miller SP, Berman JI, Jin H, Lu Y, Glenn OA, Ferriero DM, Barkovich AJ, Vigneron DB. Diffusion tensor imaging: serial quantitation of white matter tract maturity in premature newborns. NeuroImage. 2004;22:1302–1314. doi: 10.1016/j.neuroimage.2004.02.038. [DOI] [PubMed] [Google Scholar]
- Paus T, Zijdenbos A, Worsley K, Collins DL, Blumenthal J, Giedd JN, Rapoport JL, Evans AC. Structural maturation of neural pathways in children and adolescents: in vivo study. Science. 1999;283:1908–1911. doi: 10.1126/science.283.5409.1908. [DOI] [PubMed] [Google Scholar]
- Petrides M, Pandya DN. Projections to the frontal cortex from the posterior parietal region in the rhesus monkey. J Comp Neurol. 1984;228:105–116. doi: 10.1002/cne.902280110. [DOI] [PubMed] [Google Scholar]
- Pierpaoli C, Basser P. Toward a quantitative assessment of diffusion anisotropy. Magn Reson Med. 1996;36:893–906. doi: 10.1002/mrm.1910360612. [DOI] [PubMed] [Google Scholar]
- Schneider JF, Il'yasov KA, Hennig J, Martin E. Fast quantitative diffusion-tensor imaging of cerebral white matter from the neonatal period to adolescence. Neuroradiology. 2004;46:258–266. doi: 10.1007/s00234-003-1154-2. [DOI] [PubMed] [Google Scholar]
- Thomas B, Eyssen M, Peeters R, Molenaers G, Van Hecke P, De Cock P, Sunaert S. Quantitative diffusion tensor imaging in cerebral palsy due to periventricular white matter injury. Brain. 2005 doi: 10.1093/brain/awh600. [DOI] [PubMed] [Google Scholar]
- Thompson PM, Giedd JN, Woods RP, MacDonald D, Evans AC, Toga AW. Growth patterns in the developing brain detected by using continuum mechanical tensor maps. Nature. 2000;404:190–193. doi: 10.1038/35004593. [DOI] [PubMed] [Google Scholar]
- Wakana S, Jiang H, Nagae-Poetscher LM, van Zijl PC, Mori S. Fiber tract-based atlas of human white matter anatomy. Radiology. 2004;230:77–87. doi: 10.1148/radiol.2301021640. [DOI] [PubMed] [Google Scholar]
- Woods RP, Grafton ST, Holmes CJ, Cherry SR, Mazziotta JC. Automated image registration: I. General methods and intrasubject, intramodality validation. J Comput Assist Tomogr. 1998;22:139–152. doi: 10.1097/00004728-199801000-00027. [DOI] [PubMed] [Google Scholar]
- Xu D, Mori S, Shen D, van Zijl PC, Davatzikos C. Spatial normalization of diffusion tensor fields. Magn Reson Med. 2003;50:175–182. doi: 10.1002/mrm.10489. [DOI] [PubMed] [Google Scholar]
- Zhang J, Richards LJ, Yarowsky P, Huang H, van Zijl PC, Mori S. Three-dimensional anatomical characterization of the developing mouse brain by diffusion tensor microimaging. NeuroImage. 2003;20:1639–1648. doi: 10.1016/s1053-8119(03)00410-5. [DOI] [PubMed] [Google Scholar]