

Abstract
The standardized uptake value ratio (SUVR, or summed tissue ratio) has been used effectively in Pittsburgh compound B (PiB) PET studies to distinguish subjects who have significant amyloid-β deposition in their brain from those who do not. Relative to quantitative measurements, advantages of the SUVR are improved study feasibility and low test–retest variation; disadvantages include inherent bias (PiB retention overestimation) and potential for time-varying outcomes. The PiB SUVR has proven to be highly correlated with quantitative outcomes and to allow reliable detection of significant group differences (or effective contrasts). In this work, regional PiB SUVRs were examined across 9 time windows to select the window that provided the best trade-offs between bias, correlation, and effective contrast.
Methods
A total of 40 dynamic PiB PET studies were performed on controls (n =16), patients with Alzheimer disease (AD; n =11), and patients with mild cognitive impairment (MCI; n = 13) (555 MBq [15 mCi], 90-min scan, and arterial blood sampling). The SUVR was computed for five 20-min and four 30-min windows that spanned the 30- to 90-min postinjection period. The SUVRs were compared with Logan graphical distribution volume ratio (DVR) measurements (35–90 min), determined with arterial blood as input and without arterial blood as input (cerebellum as reference).
Results
Greater correlation and more bias were generally observed for the SUVR measurement at later times than at earlier times (relative to DVR). The effective contrast between the control and AD PiB SUVRs was slightly better for earlier data than for later data. The temporal dynamics of the SUVR measurement indicated greater stability in the measurement at 40 min after injection.
Conclusion
The 50- to 70-min time window provided a good compromise between physiologic validity, stability, sensitivity, and clinical feasibility across the control, MCI, and AD subject data examined in this study. The 40- to 60-min period demonstrated many advantages and should be used in studies limited by low injected dose. Although more biased than the 40- to 60-min SUVR, the 50- to 70-min SUVR was thought to be optimal because of greater measurement stability, which may prove to be important for longitudinal multisite studies performed in control, MCI, and AD subjects that are not dose-limited.
Keywords: Pittsburgh compound B, PiB, SUV, SUVR, distribution volume ratio, DVR, PET
Pittsburgh compound B (PiB) is a 11C-labeled thioflavin-T derivative that has become widely used (1–3) in imaging amyloid-β–protein deposits with PET. Amyloid imaging has proven to be useful in the study of Alzheimer disease (AD) (4–11).
In the proof-of-concept human studies (4), PiB retention was assessed using the semiquantitative standardized uptake value ratio (SUVR; summed tissue uptake over 40–60 min), and these results were subsequently verified by fully quantitative studies performed in controls, patients with mild cognitive impairment (MCI), and patients with AD (5,6). These early studies consistently showed that PiB uptake in AD patients was nearly twice that in controls in specific cortical areas (P < 0.002) but similar in amyloid-spared areas (subcortical white matter [SWM], cerebellum). PiB retention in MCI patients appeared either AD-like or control-like.
Quantitative studies require dynamic sampling of the radiotracer kinetics in brain and blood at many times throughout the study (e.g., 30–40 points over ≥90 min), analysis of arterial plasma to determine the metabolite-corrected arterial input function, and compartmental modeling analyses to obtain regional binding measurements (e.g., distribution volume ratio [DVR] = total distribution volume [VT]/nondisplaceable distribution volume [VND]). The quantitative arterial input–based DVR measurements generally serve as gold-standard outcomes for subsequent evaluations directed toward the identification of valid simpler methods that do not require blood sampling and allow for shorter data-collection times.
Lopresti et al. (6) analyzed simplified PiB PET data over 60- and 90-min intervals using the linear Logan graphical analysis with different input functions that were either arterial, image-derived carotid, or image-derived cerebellar data. Data also were analyzed with a simplified reference tissue method and the summed SUVR. Although results obtained using data over the full 90-min scan interval were less variable than were data over the shorter 60-min interval, the 60-min data provided useful results. Of all compared methods, the SUVR approach was the most robust in terms of test–retest variability and maximum effect size between AD patients and controls, although the SUVR method required the shortest scan time (e.g., 40–60 min or 40–90 min). The SUVR is easy to compute, requires no arterial input function, and produces data with a large dynamic range, thereby making it a potential candidate for routine clinical studies (6). SUVR can also serve as an approximation of DVR, although bias (overestimation relative to the true DVR) can arise as a result of plasma clearance (12).
The present work examined the PiB SUVR to determine an optimal short time window for the SUVR data collection across the control, MCI, and AD groups. A systematic evaluation was performed for several 20- and 30-min SUVR time windows, as these are the most feasible for routine clinical settings. This evaluation considered several factors, including correlation of the SUVR to Logan DVR (arterial and cerebellar input), the effective contrast of the SUVR for AD versus control groups, and the temporal dynamics of the theoretic SUVR curve.
MATERIALS AND METHODS
Data Collection
The PiB PET data were acquired at the University of Pittsburgh under protocols approved by the local Institutional Review Board; detailed descriptions of PiB PET in our facility can be found in previous reports (5,6). The present work reports on PiB PET data acquired in 40 subjects (16 controls, 11 AD patients, and 13 MCI patients) for whom arterial blood sampling was successfully performed. Data from 24 of these 40 subjects were included in previous publications (5,6). Each subject underwent MRI before the PET scan (1.5 T) (Signa; GE Healthcare) (5). All of the PiB PET data were acquired using the same dynamic framing (4 ×0.25, 8 ×0.5, 9 ×1, 2 ×3, 8 ×5, and 3 ×10 min) over 90 min. The dose and specific activity of PiB were approximately 500 MBq and 50 GBq/μmol, respectively (5,6). Radiation dosimetry results were recently reported for PiB PET studies (n = 16; injected dose, 489 ± 61 MBq) by Scheinin et al. (13).
Data Analysis
The PET and MR image volumes were coregistered using an automated method (6). The 18 regions of interest (ROIs) used in this study are defined on the coregistered MR image in Figure 1. The cerebellum was used as the reference region VND (free and non-specific uptake). The ROIs were applied to the coregistered dynamic PET scans to generate regional time–activity curves.
FIGURE 1.
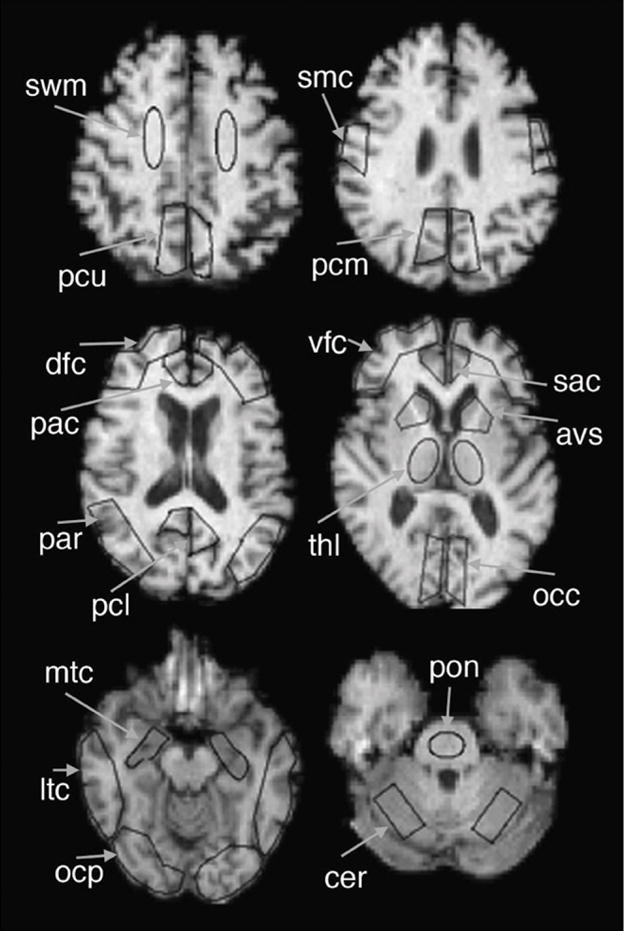
ROIs used in this study are shown superimposed on sample MR image. AVS = anterior ventral striatum; DFC = dorsal frontal cortex; LTC = lateral temporal cortex; MTC = mesial temporal cortex; OCC = occipital cortex; OCP = occipital pole; PAC = pregenual anterior cingulate; PAR = parietal cortex; PCL = precuneus, lower; PCU = precuneus, upper; SAC = subgenual anterior cingulate; SMC = sensory-motor cortex; THL = thalamus; VFC = ventral frontal cortex.
Five 20-min increments (30–50, 40–60, 50–70, 60–80, and 70–90 min after injection) and four 30-min increments (30–60, 40–70, 50–80, and 60–90 min after injection) were evaluated. The SUVR in each target ROI was calculated for each 20-min and 30-min time window by taking the ratio of the integrated activities between the target ROI and the reference cerebellar ROI. The equation for the SUVR calculation can be written as follows:
| Eq. 1 |
In this equation, t1 and t2 are the start and end times, respectively, of the experimental time window, and CROI(t) and CCER(t) are the time–activity concentrations of the target and cerebellar ROIs, respectively. Because variables such as injected dose or physical parameters (e.g., body weight or estimated surface area) cancel out in the ratio calculation, these were not applied in the individual calculations. Thus, SUVR is the summed tissue activity ratio. The SUVR is related to the DVR because VT is equivalent to the tissue-to-plasma ratio (TPR) at equilibrium, as achieved using a constant infusion paradigm (14). The equilibrium TPRROI-to-TPRREF ratio would be equal to DVR.
Two types of DVRs were calculated for each ROI over the entire 90-min PiB scan interval. One DVR was based on the measured arterial plasma input function (DVRART), and the other was based on cerebellar input (DVRCER) estimated from image-based measurements. DVRART was obtained by first calculating the VT over each ROI using the Logan graphical method (15), then taking the ratio of VT in the target ROI to the VT (or VND) in the cerebellar ROI. The Logan analysis regression was applied to the 35- to 90-min integration intervals (8 points) (5).
Evaluation of Time Windows
The 9 SUVRs were evaluated in 3 ways. The first method compared each SUVR with DVRART and DVRCER. Next, the performance of the various SUVRs was compared with the differentiation of AD patients and controls, using effect sizes (16). Finally, the temporal dynamics of the SUVR were investigated using target-to-reference PiB tissue uptake ratio curves simulated for controls (faster kinetics, low uptake) and AD (slower kinetics, high uptake) patients.
Comparison of SUVR and DVR
The SUVRs and DVRs (both DVRART and DVRCER) were compared using both correlation and concordance analysis. For all analyses, the DVR was the independent variable, and the SUVR was the dependent variable. When the ROIs were pooled, a single value for R2 and the slope were obtained for each time window. For the individual ROI evaluation, a total of 18 values for R2 and the slope were obtained for each time window.
For the correlation analysis, a linear regression was performed in 2 ways. First, an overall evaluation was performed by combining SUVRs from all ROIs and all 40 subjects over each time window and correlating these to DVRART and DVRCER. Next, an ROI-based evaluation was performed by comparing the SUVRs from each time window with each DVR over the 18 defined regions. These ROI-specific correlations were evaluated to avoid any bias in the calculation, as interdependencies between adjacent ROIs could exist because of physiologic associations (to be further investigated in future studies) or spillover effects across adjacent ROIs.
For the concordance analysis, a summary statistic was generated to provide a 95% confidence interval (CI) of the agreement, or concordance correlation, between the SUVR and the DVR results. The concordance analysis (17) accounted for repeated measures and was applied to results obtained across all 18 ROIs and to a subset of 13 primary ROIs that did not include the pons, sensory-motor cortex, thalamus, or SWM (areas known to contain little, if any, amyloid plaque).
Differentiation of Controls and AD Patients
The effect of the SUVR time window was next evaluated to examine how well each SUVR performed in terms of differentiating AD patients from controls. For this analysis, an effective contrast measurement based on the Cohen effect size (16) was examined over each ROI. Effect size was quantified as the group-mean difference between SUVRs from AD patients and SUVRs from controls, divided by the corresponding pooled SD. Because the MCI group exhibited such a wide spectrum of behaviors in PiB binding (18), effective contrast was examined only between AD patients and controls. Once obtained for the 18 ROIs, these effective contrasts were used to determine over which time window the SUVRs provided the best contrast between AD patients and controls.
Examination of SUVR Temporal Dynamics for Controls and AD Patients
For the final evaluation, the temporal dynamics of the SUVs and SUVRs were qualitatively investigated in the middle precuneus cortex (PCM) and cerebellum (SUV only). The final evaluation was performed by simulating PiB uptake and DVRs using arterial input function data and rate constants determined by a 2-tissue-compartment model (vascular volume fixed to 0.05), as previously described (5). Measured arterial input functions were first averaged across individuals within the control and AD patient groups to determine average input functions for each group. Average rate constants (K1, k2, k3, and k4; Table 1) were similarly obtained for each group by averaging individual results. The PCM DVR was obtained by calculating VT for the PCM and cerebellum regions using the average rate constants for these regions and Equation 2; the PCM VT was then divided by the cerebellar VT to obtain the PCM DVR.
TABLE 1.
Rate Constants Used in Generating Theoretical PIB Uptake Curve
| Controls | AD patients | |||
|---|---|---|---|---|
| Rate constant* | Cerebellum | PCM | Cerebellum | PCM |
| K1 | 0.2860 | 0.2907 | 0.2916 | 0.2626 |
| k2 | 0.1517 | 0.1675 | 0.1429 | 0.1234 |
| k3 | 0.0098 | 0.0170 | 0.0098 | 0.0471 |
| k4 | 0.0130 | 0.0131 | 0.0077 | 0.0157 |
K1: mL · cm−3 · min−1 and k2–k4: min−1.
| Eq. 2 |
The PiB SUVs, SUVRs, and DVRs were then plotted as a function of time and compared to better understand the effect of different time windows on the SUVR over the course of 90 min after the injection.
RESULTS
The scatter plots for the pooled ROI evaluation of the PiB DVR and SUVR are shown in Figure 2 for 3 time windows (30–50, 50–70, and 70–90 min). The top row compares SUVR with DVRART, and the bottom row compares SUVR with DVRCER. The figure demonstrates that SUVR and DVR were strongly correlated across all time windows within varying degrees. When the SUVR and DVRART were compared (Fig. 2, top row), the correlation coefficient tended to increase for later time windows. When the SUVR and DVRCER were compared (Fig. 2, bottom row), the correlation was highest for the intermediate time window. Although the plots in Figure 2 show the pooled ROIs, scatter plots of individual ROIs showed these same general patterns.
FIGURE 2.

Scatter plots of DVRs and SUVRs for all 18 ROIs of 40 subjects with regression analysis results. Example plots are shown for 3 time windows (30–50, 50–70, and 70–90 min) in each column. First and second rows compare SUVRs at different time windows with DVRART and DVRCER, respectively. Solid and dotted lines are for regression and identity lines, respectively.
Figure 3A further demonstrates the effect of time window on the correlation coefficients between the DVR and the SUVR from Figure 2. The comparison of SUVR with DVRART showed that the correlation coefficient improved as the study progressed and began to plateau toward the end of the study (Fig. 3A). For the SUVR-to-DVRCER comparison, the differences in R2 across different time windows were fairly small, with the intermediate time windows (40–60 and 40–70 min) showing the highest correlations (Fig. 3A).
FIGURE 3.

Linear regression results (R2 [A] and slope [B]) for comparison between SUVR and each DVR are shown here for nine 20- or 30-min time windows that range from 30–50 to 70–90 min (only 20-min time windows are labeled on abscissa). First 2 points show comparison of DVRART and DVRCER and are plotted for reference purposes.
In addition to the correlation coefficients, the slopes in Figure 2 can be used to assess bias in the SUVR measurement. The slope was higher than the identity line in all plots except the top left, meaning that the computed SUVRs generally overestimated the DVRs in all time windows except the one in which an early-time-window SUVR calculation (30–50 min) was compared with DVRART. This overestimation was shown again in Figure 3B, in which the slopes of the regression lines for each time window are plotted. The overestimation was evident for all time windows when SUVR was compared with DVRCER, whereas overestimation was evident only in time windows greater than or equal to 40–60 min when SUVR was compared with DVRART (Fig. 3B, solid line with square data points).
Figure 3B also shows that the slope of the regression line increased with later times, until the 60- to 80-min interval. In all windows, the degree of the overestimation in SUVR was consistently larger for DVRCER than for DVART, indirectly suggesting that the DVRCER underestimated DVRART in general, consistent with expectation (6). The DVRCER underestimated DVRART in this study by approximately 13% (data not shown).
These results were generally true across individual ROIs as well. Specifically, when comparing DVRART with SUVR, correlation coefficients for most ROIs increased as a function of time window and began to plateau toward the end of the study. Nearly all of the 18 ROIs showed correlation coefficients in the range of 0.7–1.0, with the exception of the SWM, pons, mesial temporal cortex, and occipital cortex. Correlation coefficients between DVRCER and SUVR did not vary much as a function of time window, with the intermediate time windows showing the highest correlations. As with DVRART, SWM and pons demonstrated lower correlations than did other ROIs.
For individual ROIs, the slopes of the regression lines increased in general with later time windows until the 60-to 80-min interval, as was noted for the pooled ROI comparison. The slope values were relatively tightly grouped across each time window for most ROIs, with the exception of the SWM, thalamus, pons, and anterior ventral striatum. DVRART was again overestimated by the SUVR in time windows greater than 40–60 min for all ROIs except the SWM, and DVRCER overestimated SUVR in all time windows over 30–50 min for all ROIs.
The observations from the correlation analysis were reflected in the concordance analysis results that were expressed as 95% CIs. Strong agreement was evident between the earliest SUVRs (30–50 min) for both DVRART (95% CI, 0.84–0.95) and DVRCER (95% CI, 0.87–0.96). Strong agreement was also evident at the latest times (70–90 min) (DVRART: 95% CI, 0.85–0.95), with somewhat lesser agreement between the SUVR and DVRCER as reflected by the lower CI range (DVRCER: 95% CI, 0.72–0.92). Across all 18 ROIs, strong agreements were also evident (DVRART: 95% CI, 0.82–0.95, and DVRCER: 95% CI, 0.73–0.92) as were the concordance results for the 13 primary ROIs (DVRART: 95% CI, 0.86–0.96, and DVRCER: 95% CI, 0.77–0.93), which did not include the pons, sensory-motor cortex, thalamus, or SWM.
The second evaluation focused on the ability to differentiate AD patients and controls using SUVRs computed over each time window. Contrast capability was evaluated by investigating the simple group mean difference, pooled SD, and the effect size or effective contrast for each ROI, which are shown, respectively, as a function of time window in Figures 4A, 4B, and 4C for a group of representative ROIs. The figure shows that certain ROIs, such as the pregenual anterior cingulate, dorsal frontal cortex, and anterior ventral striatum, had larger differences in the group means; other ROIs, for example, the pons and mesial temporal cortex, had smaller or even negative (pons) differences. When compared across different SUVR time windows, the simple differences were fairly stable, with the largest values around the 50- to 70-min time window for most ROIs. In Figure 4B, the pooled SDs were clearly graded across different SUVR time windows, with most ROIs displaying the largest values at later time windows.
FIGURE 4.

Simple group mean difference (A), pooled SD (B), and effective contrast (C) between AD patient (n = 11) and control (n = 16) groups are shown for SUVRs over 9 time windows (only 20-min windows labeled on abscissa) for representative group of ROI. (D) Averaged mean effective contrast and simple difference across all ROIs are shown. Difference data were scaled by arbitrary number (4.087) to show this curve on same scale as effect size curve. AVS = anterior ventral striatum; DFC = dorsal frontal cortex; MTC = mesial temporal cortex; OCC = occipital cortex; OCP = occipital pole; PAC = pregenual anterior cingulate; PAR = parietal cortex; SMC = sensory-motor cortex; THL = thalamus.
The effective group contrasts across different ROIs are shown in Figure 4C. The effective contrasts mainly decreased with increasing time window because of larger SDs in the later windows. These overall patterns can again be verified in Figure 4D, which shows the average of all ROIs as a function of time window. The simple group mean difference peaked near the 50- to 70-min time window, and the effective contrast continually decreased with later time windows.
Results from the final SUVR evaluation method are shown in Figure 5. As expected from previous studies (5), the simulated curves clearly showed higher uptake of PiB in PCM for the AD patient over the scan period. In Figure 5B, the DVR line for the average AD patient intersected the SUVR curve between 20 and 30 min, and the line for the average control intersected the SUVR curve between 30 and 40 min, suggesting better agreement between the SUVR and DVR around the 20- to 40-min time for PCM. Also, the SUVR curves exhibited a dynamically changing range until around 40–50 min and became more constant after the 50-min point. Thus, SUVR measurements at earlier time windows, although less biased relative to later measurements, might suffer from a lack of stability.
FIGURE 5.

Generated SUV and SUVR curves using averaged rate constants (K1, k2, k3, and k4) determined for AD patient (n = 11) and control (n = 16) groups. DVRs were calculated also using rate constants (with a blood volume fraction of 0.05). Curves show SUV (A) and SUVR or DVR (B) for average control (gray) and average AD patient (black) for PCM and cerebellar (SUV only) ROIs.
DISCUSSION
In this study, we have evaluated the effect of choosing different time windows for the SUVR calculation in PiB PET. Different time windows were used to compute the SUVR, and the computed values over each time interval were quantitatively compared with estimated DVRs and their ability to contrast data from AD patients and control groups. A qualitative investigation of the temporal dynamics of SUVR measurements was also performed. We found the best compromise among physiologic validity, agreement of outcomes, and study feasibility to be achieved by the 50- to 70-min SUVR.
The arterial input model was assumed to be the gold standard because this method was verified relative to arterial input–based compartmental modeling analyses that allowed us to evaluate PiB plasma clearance, nonspecific uptake, and specific binding and to also refine data-acquisition and analysis parameters. The 2-tissue, 4-parameter model proved to be an appropriate choice for the PiB PET kinetics and described the 90-min PiB data well; however, this model did not perform as well when applied to only 60 min of data (difficulty determining tissue clearance, that is, k4). The compartmental analyses helped to verify that specific binding differences were not likely the result of plasma clearance or nonspecific effects.
The arterial Logan and 2-tissue, 4-parameter cortical DVRs strongly agreed, and the former proved more stable (5). As previously described, a difference of about 1% was observed between the average (n = 5) AD posterior cingulate DVR determined for 50–90 min (5 points) and that determined for 35–90 min (8 points). Our data also showed that average absolute percentage differences in the arterial blood as input over 60 min (ART60) and over 90 min (ART90) DVRs for controls (n = 8) ranged from 1% to 2% across cortical areas (n = 8) and from 2% to 5% in subcortical areas (n = 3, including white matter), although temporal variation was apparent in the regional VT values used to compute the DVR. The ART60 VT was consistently less than the ART90 VT. This variation was most pronounced for white matter (14%), and differences in the cerebellar VT values were 6% and 9% for controls (n = 8) and AD patients (n = 6), respectively. It is unclear what is driving the VT differences, although potential sources include factors that affect tissue or plasma clearance (e.g., vascular metabolites or input function inaccuracies).
The primary radiometabolite of PiB (6-sulfato-PiB) is produced peripherally in mice, rats, baboons, and humans. This radiometabolite is produced in rat brains but not produced in mouse or human brain tissue and does not cross the blood–brain barrier to a significant extent (19). The plasma parent fraction was initially determined using reverse-phase high-performance liquid chromatography (HPLC) measurements, and the aqueous or organic extraction measurements that were subsequently used did not differ from the HPLC measurements by more than 2% at any time. Use of the arterial DVR in the verification of simpler measurements is supported by our recent study that showed a strong correlation between PiB DVRCER values and region-matched postmortem correlates of amyloid deposition for a deceased AD patient who underwent PiB imaging before death (20).
Comparisons among SUVR, DVRART, and DVRCER demonstrated that SUVRs in most time windows generally overestimate DVR (either DVRART or DVRCER), whereas DVRCER generally underestimated DVRART. The degree of SUVR overestimation for both estimates of DVR increases with later time windows but tends to stabilize around 50–70 min, with minimal changes throughout the remainder of the study. Therefore, if the proximity of SUVR to DVR is the key factor to consider, SUVR should be calculated in the earlier time windows such as 30–50 or 40–60 min to minimize bias in the SUVRs.
Correlations between SUVR and DVR were generally stronger in later time windows, especially for DVRART. Specifically, the correlation coefficient between SUVR and DVRART increases more or less asymptotically as the time windows gets later, and the coefficient between SUVR and DVRCER increases initially but becomes relatively stable by the 40- to 60-min range. Therefore, in terms of correlation strength, using later time windows to compute SUVR will give better results. When considering the optimal time window for calculation, note that the correlation coefficient from the SUVR-to-DVRART comparison does not gain much improvement at windows later than 50–70 min, and the correlation coefficient from the SUVR-to-DVRCER comparison stays relatively strong through a wide range of time windows before 60–80 min.
Assessment of effective contrasts between AD patients and controls using SUVRs at different timewindows demonstrated that, in general, contrast tends to decrease with later time windows. At later times, counting statistics of the PET scan are inferior to those at earlier times, leading to increases in the pooled SD. This, in turn, decreases the effective group contrast. When the effective contrasts for only a few interested regions in the frontal, parietal, anterior cingulate, and precuneus cortices, such as the dorsal frontal cortex, parietal cortex, pregenual anterior cingulate, and PCM, are plotted separately (not shown), this superiority in the earlier time windows was also clear, suggesting the earlier time windows would be better in terms of the AD–to–control group separation.
Effective group contrast is an important measurement when trying to make distinctions between 2 subject groups. The ability to distinguish between an AD patient and a control or to classify a subject into a certain group is a critical consideration when studying a large number of subjects longitudinally. Distinctions between subject groups will be necessary when longitudinally tracing the progression of a subject from a normal or an MCI state to AD or when tracing any reversal of plaque deposition due to clinical intervention. Although results from the 2 other evaluations of SUVR time windows cannot be ignored, results from this particular assessment of the SUVR calculation are important for the purposes of our studies.
Temporal dynamics of the theoretic SUVR curve were considered qualitatively. Stable ranges of SUVR measurement began around the 40- to 50-min time, as verified by the steep slope of the curve before 40 min. This issue was more evident for the AD group, for whom PiB uptake was more significant (and prolonged), than for the controls. A larger slope (ΔSUVR/Δtime) could indicate sensitivity of the measure to errors in timing that a later acquisition would be less sensitive to because measures are more stable at later times. This means that variations in the PET technique that could affect the temporal dynamics of the tracer delivery, such as the differences in the tracer injection duration, could also change the SUVR measure unexpectedly. Although not a serious concern in a well-controlled study, variations in the PET technique could be an important issue when data are collected across multiple clinical sites. Temporal stability of the outcome measure would help to ensure uniformity in this aspect of the data collection across sites, leading us to seriously consider later time intervals for SUV data collection for such studies.
On the basis of these evaluations, the optimal time window for SUVR estimation may vary depending on the experimental parameters and criteria used. In the correlation-based assessment, the nearness of SUVR to DVR was observed at early times (e.g., 30–50 min), and the correlations between SUVR and DVR were generally higher at later times. However, as noted earlier, the correlations between SUVR and DVRART were not remarkably improved after the 50- to 70-min window, and correlations between SUVR and DVRCER were relatively stable over the wide range of time windows. For effective contrast, earlier time windows were generally better; however, SUVRs before 40 min are changing rapidly and can vary significantly with differences in the imaging procedure. Forty to sixty minutes is a natural time interval to consider for the simplified SUVR measurement, given that the PiB tissue-to-plasma and tissue-to-cerebellum ratios in primary cortical areas begin to plateau at about 40 min, although this plateau can occur a bit later (50 min) for subjects with significant PiB uptake. In consideration of the agreement of outcomes, physiologic validity, measurement stability, and study feasibility, the 50- to 70-min time window was chosen as the overall best compromise for the SUVR calculations in this study.
Our site, in addition to several other sites, has used the 40-to 60-min SUVR because its advantages (relative to the 50- to 70-min SUVR) include lower bias, better counting statistics for lower PiB dose administrations (e.g., 185–370 MBq [5–10 mCi]), and shorter imaging sessions that can improve study feasibility. The 40- to 60-min window also has the same benefits as the 50–70 min window in that the SUVRs are most similar to DVRs at earlier times (Figs. 2 and 3), and the effective group contrast between AD patients and controls is more distinct for earlier time windows, compared with later time windows (Fig. 4). On the basis of the data in this study, the 40-min simulated SUVRs are close to the steep slope region of the temporal SUVR curve (Fig. 5). We chose to begin our SUVR calculation at 50 min (rather than at 40 min) to avoid SUV computations over times when the SUVs may be changing rapidly. The choice of a more stable SUVis at the expense of greater bias, relative to earlier (though potentially more unstable) measurements. The choice of the SUVR imaging interval should consider experimental parameters and overall study aims, such as injected dose and the subject groups of interest. Overall, we expect both the 40- to 60-min and the 50- to 70-min windows to provide good distinction of PiB retention in controls and AD patients.
CONCLUSION
Multiple time intervals were considered for the PiB PET SUVR calculation across controls, MCI patients, and AD patients. The examined time windows were 20 or 30 min and were evaluated between 30 and 90 min after injection. Although results varied according to the type of evaluation performed, a 20-min window proved adequate. A 50- to 70-min time window provided a good compromise between agreement of outcomes, physiologic validity, measurement stability, and study feasibility. The 40- to 60-min PiB SUVR is a natural time interval to consider for the simplified SUV measurement, particularly if studies are limited by low injected doses. The data in this study indicated that the 50- to 70-min interval was an optimal window for PiB PET studies, particularly those that might involve a large number of longitudinal scans collected at multiple, technically varying, clinical sites in controls, MCI patients, and AD patients.
Acknowledgments
We thank our University of Pittsburgh colleagues at the Alzheimer’s Disease Research Center and PET facility for their efforts in conducting and analyzing these studies. We are grateful to Dr. Robert Koeppe for his thoughtful perspective of this work. We also thank the volunteers and their families for their commitment to further discovery into the causes and treatment of AD through their efforts in this and other related studies. Financial support for this work was provided by P01 AG025204, R37 AG025516, R01 MH070729, K02 AG027998, P50 AG05133, R01 AG018402, the Alzheimer’s Association (TLL-01-3381), the U.S. Department of Energy (DE-FD02-03 ER63590), and the Dana Foundation. GE Healthcare (formerly Amersham Health) entered into a license agreement with the University of Pittsburgh based on the technology described in this manuscript. Drs. Klunk and Mathis are coinventors of PiB and, as such, have a financial interest in this license agreement.
References
- 1.Mathis CA, Wang Y, Holt DP, Huang GF, Debnath ML, Klunk WE. Synthesis and evaluation of 11C-labeled 6-substituted 2-arylbenzothiazoles as amyloid imaging agents. J Med Chem. 2003;46:2740–2754. doi: 10.1021/jm030026b. [DOI] [PubMed] [Google Scholar]
- 2.Mathis CA, Bacskai BJ, Kajdasz ST, et al. A lipophilic thioflavin-T derivative for positron emission tomography (PET) imaging of amyloid in brain. Bioorg Med Chem Lett. 2002;12:295–298. doi: 10.1016/s0960-894x(01)00734-x. [DOI] [PubMed] [Google Scholar]
- 3.Bacskai BJ, Hickey GA, Skoch J, et al. Four-dimensional multiphoton imaging of brain entry, amyloid binding, and clearance of an amyloid-beta ligand in transgenic mice. Proc Natl Acad Sci USA. 2003;100:12462–12467. doi: 10.1073/pnas.2034101100. [DOI] [PMC free article] [PubMed] [Google Scholar]
- 4.Klunk WE, Engler H, Nordberg A, et al. Imaging brain amyloid in Alzheimer’s disease with Pittsburgh Compound-B. Ann Neurol. 2004;55:306–319. doi: 10.1002/ana.20009. [DOI] [PubMed] [Google Scholar]
- 5.Price JC, Klunk WE, Lopresti BJ, et al. Kinetic modeling of amyloid binding in humans using PET imaging and Pittsburgh Compound-B. J Cereb Blood Flow Metab. 2005;25:1528–1547. doi: 10.1038/sj.jcbfm.9600146. [DOI] [PubMed] [Google Scholar]
- 6.Lopresti BJ, Klunk WE, Mathis CA, et al. Simplified quantification of Pittsburgh Compound B amyloid imaging PET studies: a comparative analysis. J Nucl Med. 2005;46:1959–1972. [PubMed] [Google Scholar]
- 7.Fagan AM, Mintun MA, Mach RH, et al. Inverse relation between in vivo amyloid imaging load and cerebrospinal fluid Aβ42 in humans. Ann Neurol. 2006;59:512–519. doi: 10.1002/ana.20730. [DOI] [PubMed] [Google Scholar]
- 8.Mintun MA, Larossa GN, Sheline YI, et al. [11C]PIB in a nondemented population: potential antecedent marker of Alzheimer disease. Neurology. 2006;67:446–452. doi: 10.1212/01.wnl.0000228230.26044.a4. [DOI] [PubMed] [Google Scholar]
- 9.Engler H, Forsberg A, Almkvist O, et al. Two-year follow-up of amyloid deposition in patients with Alzheimer’s disease. Brain. 2006;129:2856–2866. doi: 10.1093/brain/awl178. [DOI] [PubMed] [Google Scholar]
- 10.Edison P, Archer HA, Hinz R, et al. Amyloid, hypometabolism, and cognition in Alzheimer disease: an [11C]PIB and [18F]FDG PET study. Neurology. 2007;68:501–508. doi: 10.1212/01.wnl.0000244749.20056.d4. [DOI] [PubMed] [Google Scholar]
- 11.Rowe CC, Ackermann U, Gong SJ, et al. Imaging β-amyloid burden in aging and dementia. Neurology. 2007;68:1718–1725. doi: 10.1212/01.wnl.0000261919.22630.ea. [DOI] [PubMed] [Google Scholar]
- 12.Carson RE, Channing MA, Blasberg RG, et al. Comparison of bolus and infusion methods for receptor quantitation: application to [18F]cyclofoxy and positron emission tomography. J Cereb Blood Flow Metab. 1993;13:24–42. doi: 10.1038/jcbfm.1993.6. [DOI] [PubMed] [Google Scholar]
- 13.Scheinin NM, Tolvanen TK, Wilson IA, Arponen EM, Nagren KA, Rinne JO. Biodistribution and radiation dosimetry of the amyloid imaging agent 11C-PIB in humans. J Nucl Med. 2007;48:128–133. [PubMed] [Google Scholar]
- 14.Carson RE. PET physiological measurements using constant infusion. Nucl Med Biol. 2000;27:657–660. doi: 10.1016/s0969-8051(00)00138-4. [DOI] [PubMed] [Google Scholar]
- 15.Logan J, Fowler JS, Volkow ND, Wang GJ, Ding YS, Alexoff DL. Distribution volume ratios without blood sampling from graphical analysis of PET data. J Cereb Blood Flow Metab. 1996;16:834–840. doi: 10.1097/00004647-199609000-00008. [DOI] [PubMed] [Google Scholar]
- 16.Cohen J. Statistical Power for the Behavioral Sciences. 2. Hillsdale, NJ: Lawrence Erlbaum Associates; 1988. pp. 8–14. [Google Scholar]
- 17.King TS, Chinchilli VM, Carrasco JL. A repeated measures concordance correlation coefficient. Stat Med. 2007;26:3095–3113. doi: 10.1002/sim.2778. [DOI] [PubMed] [Google Scholar]
- 18.Kemppainen NM, Aalto S, Wilson IA, et al. PET amyloid ligand [11C]PIB uptake is increased in mild cognitive impairment. Neurology. 2007;68:1603–1606. doi: 10.1212/01.wnl.0000260969.94695.56. [DOI] [PubMed] [Google Scholar]
- 19.Mathis CA, Holt DP, Wang Y, et al. Species dependent metabolism of the amyloid imaging agent [C-11]PIB [abstract] J Nucl Med. 2004;45(suppl):114P. [Google Scholar]
- 20.Ikonomovic MD, Klunk WE, Abrahamson EE, et al. Post-mortem correlates of in vivo PiB-PET amyloid imaging in a typical case of Alzheimer’s disease. Brain. 2008;131:1630–1645. doi: 10.1093/brain/awn016. [DOI] [PMC free article] [PubMed] [Google Scholar]