

Abstract
Purpose
To explore benchmarks for future consolidation strategies, we evaluated a strictly defined (normal CA-125 and normal CT) second-complete-remission (CR) ovarian cancer population for 1) the median progression-free survival (PFS), 2) the frequency with which second remission exceeds first, and 3) the proportion of patients in remission at given time points.
Methods
Retrospective sampling was carried out at Memorial Sloan-Kettering (10/1993–12/2000) and the Royal Marsden Hospital (1/1995–4/2003) for the following: histological confirmation and elevated CA-125 at diagnosis; primary surgery; first and second-line platinum-based chemotherapy with CR; and no maintenance therapy.
Results
In 35 patients: 1) the duration of first PFS was 17.8 months (95 % CI, 13.2-24.5 mos); and second PFS was 10.8 months (95% CI, 9.6-12.2 mos); 2) the number of patients with second response longer than first was 3/35 (9%); 3) the proportion of patients remaining in second complete remission is 100% (3 mos), 100% (6 mos), 83% (9 mos), 34% (12 mos), 23% (15 mos) and 8.6% (18 mos), respectively.
Conclusion
1) The median PFS from second complete remission is short. 2) A second response is rarely longer than the first even in this second CR population. 3) The number of patients with a second response longer than the first, or the proportion of patients remaining in complete remission at given time points could be evaluated as an outcome measure in future studies.
Keywords: Ovarian cancer, remission duration, consolidation trials
Introduction
The median overall survival for all patients with advanced ovarian cancer has improved from approximately 1 year in 1975 to in excess of 3 years in 2006. For the subset having optimally debulked disease and treatment with taxane- and platinum-based combination chemotherapy, it now exceeds 5 years.[3, 4] For the majority of patients, however, the disease course is one of remission and relapse requiring intermittent retreatment.[5-7] Opportunities to improve both overall survival and quality of life would include more effective primary treatment, or the use of effective maintenance or consolidation strategies for patients in remission. [8]
The majority of consolidation and maintenance approaches have been investigated in patients in first clinical remission where the duration of progression-free survival (PFS) and overall survival are well characterized. [4, 9, 10] Since ovarian cancer patients can respond to second-line therapy, it is very attractive to investigate consolidation approaches for these patients.[11] Effective strategies are needed to prevent or delay relapse, which occurs in nearly all such patients, and the generally shorter time of second or greater remission would allow the rapid assessment of efficacy in clinical trials.
The duration of response to second-line therapy has been poorly characterized. While the PFS is generally reported to be 5.3-12 months if one surveys randomized trials for recurrent platinum-sensitive disease, few studies separately report the time of failure for patients in a second complete clinical remission, [12-14] and this PFS range includes patients with complete response to second-line therapy, as well as those with partial responses and often stable disease. It has been suggested that patients with second-line partial responses and stable disease have a similar time to progression, [15] but the characteristics of relapse from a complete response are not well described.
Recently, a retrospective review of 176 patients evaluated the duration of second response compared with first response and showed that only 4 of 121 assessable responses (3%) were of longer duration than the primary response in a given individual. Second complete clinical responses were not separately reported, and responses were defined as either radiographic improvement or CA-125 decline.[11] This study raised the important issue of considering patients as their own control to investigate clinical trial strategies. As an example, a novel treatment that resulted in a predetermined proportion of patients having a second remission of longer duration than the first would be particularly noteworthy.
There is currently great interest in evaluating second-remission consolidation strategies in patients who return to a second complete clinical remission, which would be most strictly defined as having a normal CT scan and CA-125 level ≤35 U/ml. In this retrospective study, we therefore sought to apply strict criteria for patient selection and definition of complete response (requiring a return to normal CA-125 and normal CT imaging) and to determine 1) the median progression-free interval, 2) how frequently a second complete response is longer than a first complete response, and 3) the proportion of patients remaining in second remission at defined time points.
Patients and Methods
Retrospective clinical databases at Memorial Sloan- Kettering Cancer Center (MSKCC, New York) and The Royal Marsden Hospital (London, UK) were screened for eligible patients as described below. Investigational review board approval for an anonymous retrospective review was obtained.
The MSKCC population was derived from 2 previously reported patient populations [1, 2] selected from all patients treated at Memorial Hospital between October 1993 and December 2000 (Fig. 1). The Royal Marsden Population was derived from all patients treated at the Royal Marsden Hospital between January 1995 and April 2003 (Fig. 2).
Figure 1. Patient Flow Diagrams: Memorial Sloan-Kettering patient population.

CR, complete response; MSKCC, Memorial Sloan-Kettering Cancer Center; TFI, treatment-free interval.
Figure 2. Patient Flow Diagrams: The Royal Marsden patient population.

CR, complete response; CT, computed tomography; RMH, Royal Marsden Hospital; TFI, treatment-free interval.
All patients had histological confirmation of epithelial ovarian cancer, fallopian tube cancer, or primary peritoneal cancer, and elevated CA125 at diagnosis. All patients had surgery including bilateral salpingo-oophorectomy, hysterectomy, omentectomy, and tumour debulking, either as primary treatment or following neoadjuvant chemotherapy. Platinum chemotherapy (either single agent or in combination) was given as part of primary therapy with complete response at the end of treatment. Patients relapsing after primary treatment with evaluable disease, receiving platinum-based second-line chemotherapy, and achieving a second complete response were included. No investigational or maintenance therapy was given in remission. Surgery performed at first relapse was permitted in conjunction with chemotherapy. Patients were observed until second relapse.
Complete responses to first- and second-line therapy were strictly defined by normalization of CA-125 and a normal computed tomography (CT) scan. Disease progression was defined by doubling of the CA-125 above the upper limit of normal (>70 IU/ml), measurable disease on CT, or confirmed disease-related symptoms.
Statistical Considerations
The duration of treatment-free interval (TFI) was measured as the time elapsed from the last dose of chemotherapy until the first dose of the next chemotherapy regimen. The first PFS is measured as the interval from the start of primary therapy to date of first relapse (PFS1). The second PFS is measured as the interval from the start of secondary therapy to the date of the second relapse (PFS2). TFI, PFS1, and PFS2 are reported in months. Median PFS and 95% confidence intervals are estimated using the Kaplan Meier method. Univariate analysis between optimal debulking and PFS was assessed via the log-rank test. All analyses were done using the SAS system, version 9.1 (SAS Institute, Carey, NC).
Results
Based on the selection process described in the methods section, 35 patients were identified for analysis with characteristics as described in Table 1. The median age was 57, ranging from 31-73 years. The majority of patients were stage III or IV (91%), and most had serous or endometrial histology (91%). Three (9%) patients had clear-cell histology. Sixteen (46%) patients had optimal debulking. Thirty-one patients (89%) had primary surgery, and 4 patients (11%) had neoadjuvant chemotherapy (2 RMH + 2 MSKCC). All had a platinum-based primary and second-line regimen that resulted in a return to strictly defined complete clinical remission. The TFI for the entire population was 15.2 months (range, 4.3-72 mos).
Table 1.
Patient characteristics
| Patient Characteristics (N = 35) | |
|---|---|
| Median Age, y (range) | 57 (31- 73) |
| Stage | |
| I | 2 (6%) |
| II | 1 (3%) |
| III | 24 (69%) |
| IV | 8 (23%) |
| Histologic Type | |
| Serous | 26 (74%) |
| Endometrioid | 6 (17%) |
| Clear cell | 3 (9%) |
| Size of Residual at Primary Debulking | |
| Optimal (≤ 1 cm) | 16 (46%) |
| Suboptimal (> 1 cm) | 10 (29%) |
| Unknown | 9 (26%) |
| Primary Chemotherapy | |
| Taxane + platinum | 22 (63%) |
| Other platinum containing | 13 (37%) |
| Second-line Chemotherapy | |
| Taxane + platinum | 24 (69%) |
| Other platinum combination | 7 (20%) |
| Platinum only | 4 (11%) |
Eighty-six percent of patients received 6 or more cycles of primary therapy, and 91% of patients received 6 or more cycles of second-line therapy, as seen in Table 2. The median CA-125 at the end of primary and secondary therapy was respectively 12 U/ml (range, 4-31 U/ml) and 19 U/ml (range, 3-34 U/ml). The duration of the first PFS was 17.8 months (95% CI, 13.2-24.5 mos), and the duration of the second PFS was 10.8 months (95% CI, 9.6-12.2 mos), as seen in Figure 3.
Table 2.
Cycles therapy administered, response and response duration
| Primary Therapy | No. Patients (%) |
|---|---|
| 3 - 5 cycles | 5 (14%) |
| 6 cycles | 23 (66%) |
| > 6 cycles | 7 (20%) |
| Second-line therapy | |
| 3-5 cycles | 3 (9%) |
| 6 cycles | 31 (89%) |
| > 6 cycles | 1 (3%) |
| Median CA-125 end primary therapy (range) | 12 (4-31) |
| Median CA-125 end second-line therapy (range) | 19 (3-34) |
| Median duration PFS1 | 17.8 mos, 95% CI (13.2 – 24.5 mos) |
| Median duration PFS2 | 10.8 mos, 95% CI (9.6 – 12.2 mos) |
PFS1, the interval from the start of primary therapy to date of first relapse; PFS2, the interval from the start of secondary therapy to the date of the second relapse.
Figure 3. Time from start of therapy to relapse.
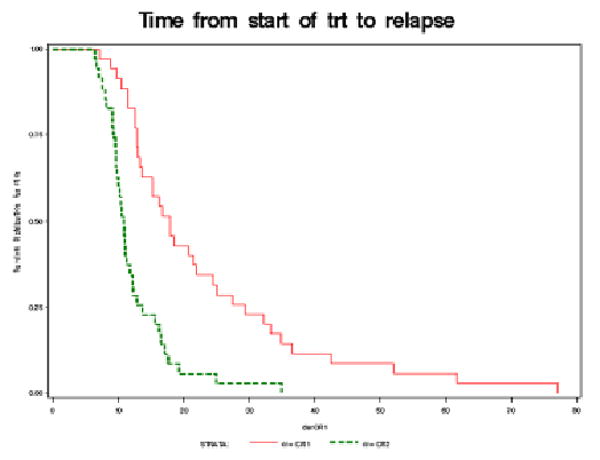
Table 3 shows that primary optimal debulking is associated with a longer duration of the first PFS (24.7 v 14.1 mos, P = 0.0079), but the duration of the second PFS is similar regardless of whether primary optimal debulking was achieved (10.9 v 10.6 mos, P = ns).
Table 3.
Relationship of primary debulking status to PFS1 and PFS2
| Duration PFS | Optimal | Suboptimal | p |
|---|---|---|---|
| PFS1 | 24.7 (17.8–34.9) | 14.1 (12.5–21.5) | 0.0079 |
| PFS2 | 10.9 (9.3–13.7) | 10.6 (9.1–12.2) | .2661 |
PFS1, the interval from the start of primary therapy to date of first relapse; PFS2, the interval from the start of secondary therapy to the date of the second relapse.
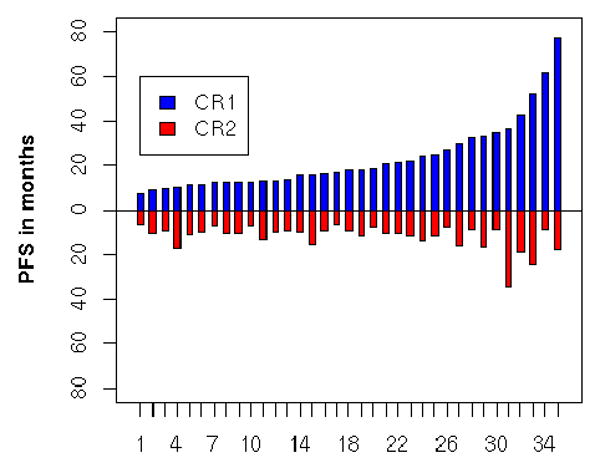
The number of patients with second PFS longer than first PFS is 3 (9%), with the number of months the second remission is longer for each patient as 0.3 months, 1.7 months, and 6.7 months, respectively, as seen in Table 4. Each of these patients received combination platinum-based primary and second-line therapy. The relationship of PFS1 to PFS2 grouped in categories by the duration of PFS1 is described in Table 5. The 3 patients with PFS2 > PFS1 occurred in patients with duration of PFS1 ranging from 6-20 months. Thus, the duration of first PFS did not predict the longer duration of the second PFS. Figure 4 graphically depicts the duration of PFS1 and PFS2 for all 35 patients, showing the infrequency of the phenomenon of PFS2 > PFS1.
Table 4.
Patients with PFS2 > PFS1
| Patient no. | Dur PFS1 | Dur PFS2 | Difference |
|---|---|---|---|
| 8 | 15.2 mos | 15.5 mos | 0.3 mos |
| 16 | 8.8 mos | 10.5 mos | 1.7 mos |
| 17 | 10.4 mos | 17.1 mos | 6.7 mos |
PFS1, the interval from the start of primary therapy to date of first relapse; PFS2, the interval from the start of secondary therapy to the date of the second relapse.
Table 5.
Relationship of PFS1 to PFS2 by category
| PFS2 (mos) | |||||||
|---|---|---|---|---|---|---|---|
| PFS1 (mos) | 6-9 | 9-12 | 12-15 | 15-20 | >20 | Total | No. pts PFS2 > PFS1 (dur in mos) |
| 6-9 | 1 | 1 | 0 | 0 | 0 | 2 | 1 |
| 9-12 | 0 | 3 | 0 | 1 | 0 | 4 | 1 |
| 12-15 | 2 | 4 | 1 | 0 | 0 | 7 | 0 |
| 15-20 | 2 | 4 | 0 | 1 | 0 | 7 | 1 |
| >20 | 1 | 5 | 3 | 4 | 2 | 15 | 0 |
PFS1, the interval from the start of primary therapy to date of first relapse; PFS2, the interval from the start of secondary therapy to the date of the second relapse.
Figure 4. Relationship of PFS1 to PFS2 by patient.
The proportion of patients remaining in second complete remission is categorized by time in Table 6. The proportion of patients remaining disease-free in PFS2 is 100%, 100%, 83%, 34%, 23% and 8.6% at 3, 6, 9, 12, 15, and 18 months, respectively.
Table 6.
Proportion of patients in complete clinical remission at given time points
| Time Interval | % in PFS1 | % in PFS2 |
|---|---|---|
| 3 months | 100% | 100% |
| 6 months | 100% | 100% |
| 9 months | 94% | 83% |
| 12 months | 83% | 34% |
| 15 months | 63% | 23% |
| 18 months | 46% | 8.6% |
| 21 months | 40% | 5.8% |
| 24 months | 34% | 5.8% |
PFS1, the interval from the start of primary therapy to date of first relapse; PFS2, the interval from the start of secondary therapy to the date of the second relapse.
Discussion
There is significant interest in investigating consolidation or maintenance strategies in ovarian cancer for patients in both primary and secondary complete clinical remission. The factors predicting an initial complete response to primary chemotherapy have been well documented and include stage, debulking status, and histology.[16, 17] The likelihood of second response following first relapse depends on the TFI and the choice of agent, with most studies having a subset of patients who return to a complete clinical remission. However, the predictive factors and subsequent outcome for this subset are generally not reported separately.[12-14, 18, 19] Patients in second complete clinical remission are particularly suitable for studies of consolidation strategies, but the lack of agreed-upon endpoints makes pilot trials of this approach difficult to interpret. This study sought to 1) assess the median duration of second complete response using patients selected by strict criteria, 2) characterize the duration of second complete response in relation to the first complete response, and 3) determine the proportion of patients remaining in second complete remission at interval time points. Each of these outcome measures has the potential to be considered for future clinical trial endpoints.
The frequency of achieving a second complete clinical remission varies and directly depends on multiple factors such as the agent employed, whether used singly or in combination, platinum-sensitivity status, and TFI.[12-14, 18-20] It also depends on the definition of complete clinical remission. For example, some have proposed that CA-125 is more accurate than WHO or RECIST criteria in ovarian cancer and should preferentially be used; others have defined complete clinical response as having resolution of radiographic evidence of disease (but allowing non-specific abnormalities up to 1 cm), while others have required completely normal CT imaging.[21-24]
First, we have reported the median duration of PFS in this study to be 17.8 months (95% CI 13.2-24.9 mos) following primary therapy. This is similar to the median PFS of 18.5 months recently reported in a trial with 1,308 patients receiving primary paclitaxel and carboplatin treatment in a comparable group.[14] The median TFI in our patient population was 15.2 (range, 4.3-72 mos) representing a moderately platinum-sensitive group. The median duration of PFS2 in our patients of 10.8 months (9.6-12.2 mos) also falls in the range of reported PFS after second-line therapy, but this range comprises data from trials that include both completely (the minority) and partially (the majority) responding patients such as those treated with carboplatin (5.8 ms; 95% CI, 5.2-7.1 mos), gemcitabine with carboplatin (8.6 mos; 95% CI, 7.9-9.7 mos), liposomal doxorubicin with carboplatin (9.4 mos), and paclitaxel with carboplatin (12 mos).[13, 14] A retrospective review of patients with a TFI of only 6 months who received a heterogeneous group of treatments for recurrent disease showed a median time to recurrence after second-line therapy of 5 months (range, 1-20 mos). This illustrates the importance of TFI, but this study did not distinguish the proportion of patients with completely responding disease.[25] Clearly the length of the TFI has a major impact on the likelihood of subsequent response (including complete responses), and has been shown to affect PFS following second-line therapy. [26] However, the impact on the duration of second complete response was unknown. Our study therefore provides the data suggesting that primary TFI may not be a predictor for longer duration of second complete remission when compared with the first. We also demonstrated, as expected, that optimal debulking is associated with a statistically longer duration of PFS1 (24.7 v 14.1 mos, P = 0.0079), as is well established. [27] However, in this selected patient population, the duration of the second PFS from a second complete response is similar whether or not optimal debulking is achieved (10.9 v 10.6 mos, P = ns). This finding has been documented in other studies with regard to debulking status. [28] This can also be extrapolated from the data of Eisenhauer et al., [29] where the importance of tumor extent in prognosis (post-op residuals varying widely) affected PFS1, but the greater consistency in PFS2 disease (disease volumes at re-tretament) may be more congruent.
Therefore, patients who are able to achieve a second complete response (and represent a selected population) may all behave in a similar fashion irrespective of initial characteristics, but this needs validation in a larger data set.
Second, we also examined the duration of second complete response in comparison to first complete response. A recent report on patients receiving treatment for relapsed ovarian cancer [11] showed that second responses exceed the first response in only 3% of 121 assessable patients, but did not separately report the outcome of the complete responders. Furthermore, the duration of first response could not be used to predict the length of the second response. Our data likewise showed that a longer second response (even using the most stringent criteria to select complete responders) occurred in only 3/35 patients (8%), with differences in duration of 0.3, 1.7, and 6.7 months, respectively. No particular distinguishing characteristics of these patients could be identified. It should be noted that the patient with the 0.3-month difference had a PFS1 of 15.2 months, so achieving a similar duration could be considered clinically meaningful. The numbers are insufficient to determine whether the 3% described by Markman et al., [11] including partial and completely responding patients, differs from the 8% seen in our patients relapsing from complete response. It is reasonable to conclude, however, that the phenomenon of having a second response longer than first is infrequent, even if one confines the analysis to second complete responders.
Third, we have documented the proportion of patients who remain in remission at a given time point (Table 6). When designing a phase II study for second-line treatment where we expect a short median PFS, it may be better to use a binary endpoint such as the 6, 9, 12 month PFS rate. Since this endpoint is binary and observed by the specified time point, traditional phase II design, as is common for tumor-response endpoints, can be utilized. All patients will then be assessed by this fixed time, and this will allow greater uniformity of results across trials.
Clearly the potential for bias exists in our retrospective study. Our numbers are small as a result of the strict eligibility criteria, which aimed to identify the “best” group of patients who would have the potential for showing the longest duration of second complete remission. Our numbers were further diminished by excluding patients that achieved second complete clinical remission by our criteria, but then entered pilot consolidation trials and received investigational therapy. As more clinical trials for recurrent disease include a maintenance or consolidation portion, it is essential that we continue to characterize patient populations such as in this study in order to build the benchmarks necessary to select promising agents from future exploratory studies.
In summary, we have shown that 1) the median PFS from second complete remission is relatively short, and not dissimilar to those reported for patients progressing from partial responses or stable disease; 2) the phenomenon of having a second response longer than first as previously described remains infrequent (8%), even in this ideal second complete clinical remission population when retreated with the same or similar agents; 3) the proportion of patients remaining in complete remission at give time points is readily quantified. The latter 2 endpoints should further be explored as future clinical trial outcome measures.
Acknowledgments
Supported by NIH Grants K23 CA 89333 and PO1 CA 052477, and by the Lymphoma Foundation.
Footnotes
Publisher's Disclaimer: This is a PDF file of an unedited manuscript that has been accepted for publication. As a service to our customers we are providing this early version of the manuscript. The manuscript will undergo copyediting, typesetting, and review of the resulting proof before it is published in its final citable form. Please note that during the production process errors may be discovered which could affect the content, and all legal disclaimers that apply to the journal pertain.
References
- 1.Dizon DS, et al. Retrospective analysis of carboplatin and paclitaxel as initial second-line therapy for recurrent epithelial ovarian carcinoma: application toward a dynamic disease state model of ovarian cancer. J Clin Oncol. 2002;20(5):1238–47. doi: 10.1200/JCO.2002.20.5.1238. [DOI] [PubMed] [Google Scholar]
- 2.Dizon DS, et al. Treatment of recurrent ovarian cancer: a retrospective analysis of women treated with single-agent carboplatin originally treated with carboplatin and paclitaxel. The Memorial Sloan-Kettering Cancer Center experience. Gynecol Oncol. 2003;91(3):584–90. doi: 10.1016/j.ygyno.2003.08.017. [DOI] [PubMed] [Google Scholar]
- 3.du Bois A, et al. Addition of epirubicin as a third drug to carboplatin-paclitaxel in first-line treatment of advanced ovarian cancer: a prospectively randomized gynecologic cancer intergroup trial by the Arbeitsgemeinschaft Gynaekologische Onkologie Ovarian Cancer Study Group and the Groupe d'Investigateurs Nationaux pour l'Etude des Cancers Ovariens. J Clin Oncol. 2006;24(7):1127–35. doi: 10.1200/JCO.2005.03.2938. [DOI] [PubMed] [Google Scholar]
- 4.Armstrong DK, et al. Intraperitoneal cisplatin and paclitaxel in ovarian cancer. N Engl J Med. 2006;354(1):34–43. doi: 10.1056/NEJMoa052985. [DOI] [PubMed] [Google Scholar]
- 5.Harries M, Gore M. Part II: chemotherapy for epithelial ovarian cancer-treatment of recurrent disease. Lancet Oncol. 2002;3(9):537–45. doi: 10.1016/s1470-2045(02)00847-1. [DOI] [PubMed] [Google Scholar]
- 6.Harries M, Gore M. Part I: chemotherapy for epithelial ovarian cancer-treatment at first diagnosis. Lancet Oncol. 2002;3(9):529–36. doi: 10.1016/s1470-2045(02)00846-x. [DOI] [PubMed] [Google Scholar]
- 7.Markman M. Viewing ovarian cancer as a “chronic disease”: what exactly does this mean? Gynecol Oncol. 2006;100(2):229–30. doi: 10.1016/j.ygyno.2005.08.043. [DOI] [PubMed] [Google Scholar]
- 8.Sabbatini P, Spriggs DR. Consolidation for ovarian cancer in remission. J Clin Oncol. 2006;24(4):537–9. doi: 10.1200/JCO.2005.04.5138. [DOI] [PubMed] [Google Scholar]
- 9.Pfisterer J, et al. Randomized phase III trial of topotecan following carboplatin and paclitaxel in first-line treatment of advanced ovarian cancer: a gynecologic cancer intergroup trial of the AGO-OVAR and GINEC. J Natl Cancer Inst. 2006;98(15):1036–45. doi: 10.1093/jnci/djj296. [DOI] [PubMed] [Google Scholar]
- 10.Ozols RF, et al. Phase III trial of carboplatin and paclitaxel compared with cisplatin and paclitaxel in patients with optimally resected stage III ovarian cancer: a Gynecologic Oncology Group study. J Clin Oncol. 2003;21(17):3194–200. doi: 10.1200/JCO.2003.02.153. [DOI] [PubMed] [Google Scholar]
- 11.Markman M, et al. Duration of Response to Second-Line, Platinum-Based Chemotherapy for Ovarian Cancer: Implications for Patient Management and Clinical Trial Design. J Clin Oncol. 2004;22(15):3120–3125. doi: 10.1200/JCO.2004.05.195. [DOI] [PubMed] [Google Scholar]
- 12.Gordon AN, et al. Recurrent epithelial ovarian carcinoma: a randomized phase III study of pegylated liposomal doxorubicin versus topotecan. J Clin Oncol. 2001;19(14):3312–22. doi: 10.1200/JCO.2001.19.14.3312. [DOI] [PubMed] [Google Scholar]
- 13.Parmar MK, et al. Paclitaxel plus platinum-based chemotherapy versus conventional platinum-based chemotherapy in women with relapsed ovarian cancer: the ICON4/AGO-OVAR-2.2 trial. Lancet. 2003;361(9375):2099–106. doi: 10.1016/s0140-6736(03)13718-x. [DOI] [PubMed] [Google Scholar]
- 14.Pfisterer J, et al. Gemcitabine plus carboplatin compared with carboplatin in patients with platinum-sensitive recurrent ovarian cancer: an intergroup trial of the AGO-OVAR, the NCIC CTG, and the EORTC GCG. J Clin Oncol. 2006;24(29):4699–707. doi: 10.1200/JCO.2006.06.0913. [DOI] [PubMed] [Google Scholar]
- 15.Gronlund B, et al. Is stabilization of disease a useful indicator for survival in second-line treatment of ovarian carcinoma pre-treated with Paclitaxel-Platinum? Gynecol Oncol. 2004;94(2):409–15. doi: 10.1016/j.ygyno.2004.05.005. [DOI] [PubMed] [Google Scholar]
- 16.Polverino G, et al. Survival and prognostic factors of women with advanced ovarian cancer and complete response after a carboplatin-paclitaxel chemotherapy. Gynecol Oncol. 2005;99(2):343–7. doi: 10.1016/j.ygyno.2005.06.008. [DOI] [PubMed] [Google Scholar]
- 17.Voest EE, van Houwelingen JC, Neijt JP. A meta-analysis of prognostic factors in advanced ovarian cancer with median survival and overall survival (measured with the log (relative risk] as main objectives. Eur J Cancer Clin Oncol. 1989;25(4):711–20. doi: 10.1016/0277-5379(89)90208-3. [DOI] [PubMed] [Google Scholar]
- 18.Markman M, et al. Second line platinum therapy in patients with ovarian cancer previously treated with cisplatin. Journal of Clinical Oncology. 1991;9:389–393. doi: 10.1200/JCO.1991.9.3.389. [DOI] [PubMed] [Google Scholar]
- 19.ten Bokkel Huinik W, et al. Topotecan versus paclitaxel for the treatment of recurrent epithelial ovarian cancer. Journal of Clinical Oncology. 1997;15:2183–2193. doi: 10.1200/JCO.1997.15.6.2183. [DOI] [PubMed] [Google Scholar]
- 20.Markman M, Hoskins W. Responses to salvage chemotherapy in ovarian cancer: a critical need for precise definitions of the treated population. Journal of Clinical Oncology. 1992;10(4):513–514. doi: 10.1200/JCO.1992.10.4.513. [DOI] [PubMed] [Google Scholar]
- 21.Rustin GJ, et al. Comparison of CA-125 and standard definitions of progression of ovarian cancer in the intergroup trial of cisplatin and paclitaxel versus cisplatin and cyclophosphamide. J Clin Oncol. 2006;24(1):45–51. doi: 10.1200/JCO.2005.01.2757. [DOI] [PubMed] [Google Scholar]
- 22.Rustin GJ, et al. Defining progression of ovarian carcinoma during followup according to CA 125: a North Thames Ovary Group Study. Annals of Oncology. 1996;7(4):361–364. doi: 10.1093/oxfordjournals.annonc.a010602. [DOI] [PubMed] [Google Scholar]
- 23.Gronlund B, et al. Do CA125 response criteria overestimate tumour response in second-line treatment of epithelial ovarian carcinoma? Br J Cancer. 2004;90(2):377–82. doi: 10.1038/sj.bjc.6601501. [DOI] [PMC free article] [PubMed] [Google Scholar]
- 24.Gronlund B, et al. Should CA-125 response criteria be preferred to response evaluation criteria in solid tumors (RECIST) for prognostication during second-line chemotherapy of ovarian carcinoma? J Clin Oncol. 2004;22(20):4051–8. doi: 10.1200/JCO.2004.10.028. [DOI] [PubMed] [Google Scholar]
- 25.Roland PY, et al. Response to salvage treatment in recurrent ovarian cancer treated initially with paclitaxel and platinum-based combination regimens. Gynecol Oncol. 1998;68(2):178–82. doi: 10.1006/gyno.1997.4909. [DOI] [PubMed] [Google Scholar]
- 26.Ferrero JM, et al. Second-line chemotherapy with pegylated liposomal doxorubicin and carboplatin is highly effective in patients with advanced ovarian cancer in late relapse: a GINECO phase II trial. Ann Oncol. 2006 doi: 10.1093/annonc/mdl376. [DOI] [PubMed] [Google Scholar]
- 27.Piver MS, et al. The impact of aggressive debulking surgery and cisplatin-based chemotherapy on progression-free survival in stage III and IV ovarian carcinoma. J Clin Oncol. 1988;6(6):983–9. doi: 10.1200/JCO.1988.6.6.983. [DOI] [PubMed] [Google Scholar]
- 28.Hoskins P, et al. Factors predictive of survival after first relapse or progression in advanced epithelial ovarian carcinoma: a prediction tree analysis-derived model with test and validation groups. Gynecol Oncol. 1998;70(2):224–30. doi: 10.1006/gyno.1998.5074. [DOI] [PubMed] [Google Scholar]
- 29.Eisenhauer EA, Vermorken JB, van Glabbeke M. Predictors of response to subsequent chemotherapy in platinum pretreated ovarian cancer: a multivariate analysis of 704 patients [seecomments] Ann Oncol. 1997;8(10):963–8. doi: 10.1023/a:1008240421028. [DOI] [PubMed] [Google Scholar]