Abstract
Insulin-secreting pancreatic beta-cells play a key role in the pathogenesis of diabetes mellitus. Potential new treatments for this disease include cell-replacement therapies using embryonic stem cells (ESCs). We have generated ESCs from a transgenic mouse model, mouse insulin 1 promoter (MIP)-green fluorescent protein (GFP) mice, in which embryonic and adult beta-cells are genetically tagged with GFP. The aim of the present study is to examine the differentiation potential of MIP-GFP ESCs in the microenvironment of the kidney capsule. The ESCs grew rapidly and formed a teratoma with GFP-expressing beta-like cells present in clusters that formed a cord-like structure similar to what is seen in the embryonic pancreas. These structures also included glucagon-expressing alpha-cells and amylase-expressing acinar cells. Electron microscopic analysis showed insulin-like granules in columnar epithelium with microvilli adjacent to exocrine-like granule containing cells. The MIP-GFP ESCs should be a useful research tool to study the differentiation capacity of ESCs towards pancreatic lineages.
Keywords: embryonic stem cells, pancreatic beta-cells, pancreatic endocrine differentiation, teratoma
Embryonic stem cells (ESCs) possess the unique ability to be cultured indefinitely in an undifferentiated state and then to differentiate into cells of all three germ layers: ectoderm, mesoderm and endoderm (Thomson et al., 1998; Reubinoff et al., 2000; Itskovitz-Eldor et al., 2000). Thus, they represent a potentially unlimited source of functional insulin-secreting pancreatic beta-cells that could be used as a cell-based therapy for the treatment of diabetes mellitus (Robertson, 2004; Street et al., 2004). In this regard, D’Amour et al. (2006) have recently described a stepwise protocol to generate insulin-producing cells by in vitro culture that recapitulates many of the features of normal embryonic development. However, the cells appear to be immature, as indicated by the co-expression of insulin and glucagon and their poor secretory response to glucose. Subsequently, the same group showed that ESC-derived pancreatic endoderm could differentiate into glucose-responsive endocrine cells after implantation into mice (Kroon et al., 2008). These studies indicate the potential of human ESCs for generating pancreatic beta-cells for therapeutic purposes. Here, we describe the generation and preliminary characterization of ESCs from MIP-GFP transgenic mice (Hara et al., 2003). These mice express GFP in embryonic and adult beta-cells under the control of the mouse insulin 1 promoter. The MIP-GFP ESCs may allow us to visualize beta-cell formation in real-time at the single-cell level.
Mouse ESC lines were derived from E3.5 blastocysts of MIP-GFP mice on a C57BL/6 background essentially as described by Nagy et al. (2003). We obtained three lines: MIP-GFP ESC lines #2, #4 and #9. Karyotype analysis revealed that all three lines had a normal complement of 40 chromosomes (#2 and #4 were 40, XY and #9 was 40, XX). Since line #2 grew more robustly than the others, we used it in subsequent studies. These ESCs were free of common mouse pathogens as tested by PCR using the MU developed “Infectious Microbe PCR Amplification Test” (IMPACT) (MU Research Animal Diagnostic Laboratory (RADIL), Columbia, MO). MIP-GFP ESC #2 was injected into mouse blastocysts and found to be germline competent. These cells were strongly positive (by quantitative real-time PCR – data not shown) for a number of molecular markers of undifferentiated pluripotent mouse ESCs, including octamer binding protein 3/4 (Oct3/4; Scholer et al., 1989; Okazawa et al., 1991), Nanog (Chambers et al., 2003; Hart et al., 2004; Wu and Yao, 2005) and Rex-1 (Hosler et al., 1989).
The MIP-GFP ESCs were co-cultured with an inactivated feeder layer of primary mouse embryonic fibroblasts (MEFs). Prior to plating the ESCs, the MEFs were mitotically inactivated by treatment with mitomycin C. The MIP-GFP ESCs were cultured in DMEM (high glucose and no pyruvate) supplemented with 15% Fetal Bovine Serum (FBS, ESC qualified; HyClone, Logan, UT), 5% Knock-out serum replacement (Invitrogen, Carlsbad, CA), 2 mM L-Glutamine, 1% Penicillin/Streptavidin (HyClone), 1 × Non-essential amino acids (HyClone), 0.1 mM β-mercaptoethanol and 1000 U/mL leukemia inhibitory factor (LIF) (Millipore, Billerica, MA).
To study beta-cell formation in tetratomas, we injected 1 × 10⁶ MIP-GFP ESCs under the kidney capsule of syngeneic male C57BL/6 mice (n=8). The mice were monitored daily and sacrificed after 4 weeks. The grafts were excised and examined histologically. A cluster of GFP-expressing cells in the graft was microdissected including surrounding tissue, fixed with 4% paraformaldehyde (PFA) and paraffin-embedded or frozen. The sections were stained for insulin (DAKO, Carpinteria, CA), glucagon and amylase (Sigma-Aldrich, St. Louis, MO). Microscopic images were taken with a Nikon Eclipse E800 microscope with confocal attachment (New York, NY) and an Olympus IX80 DSU spinning disk confocal microscope (Melville, NY). Three-dimensional reconstruction was carried out using a stack of images taken by a Leica SP5 AOBS spectral 2-photon confocal microscope (Wetzlar, Germany). The GFP-expressing cells were mapped using an Olympus IX80 microscope and the Stereo Investigator Imaging System (MicroBrightField, Williston, VT). This procedure allowed the number of GFP-expressing cells to be precisely quantified with spatial information to a depth of ~1 mm. For transmission electron microscopic (TEM) analysis, the GFP-expressing regions were fixed with 4% PFA and 0.02% glutaraldehyde in 0.1 M cacodylate buffer (pH 7.4) for 2 hr and embedded in resin. Pancreata from E13.5 embryos were excised from MIP-GFP mice and treated the same way. Sections (80 nm) were stained with uranyl acetate plus lead citrate for TEM observation.
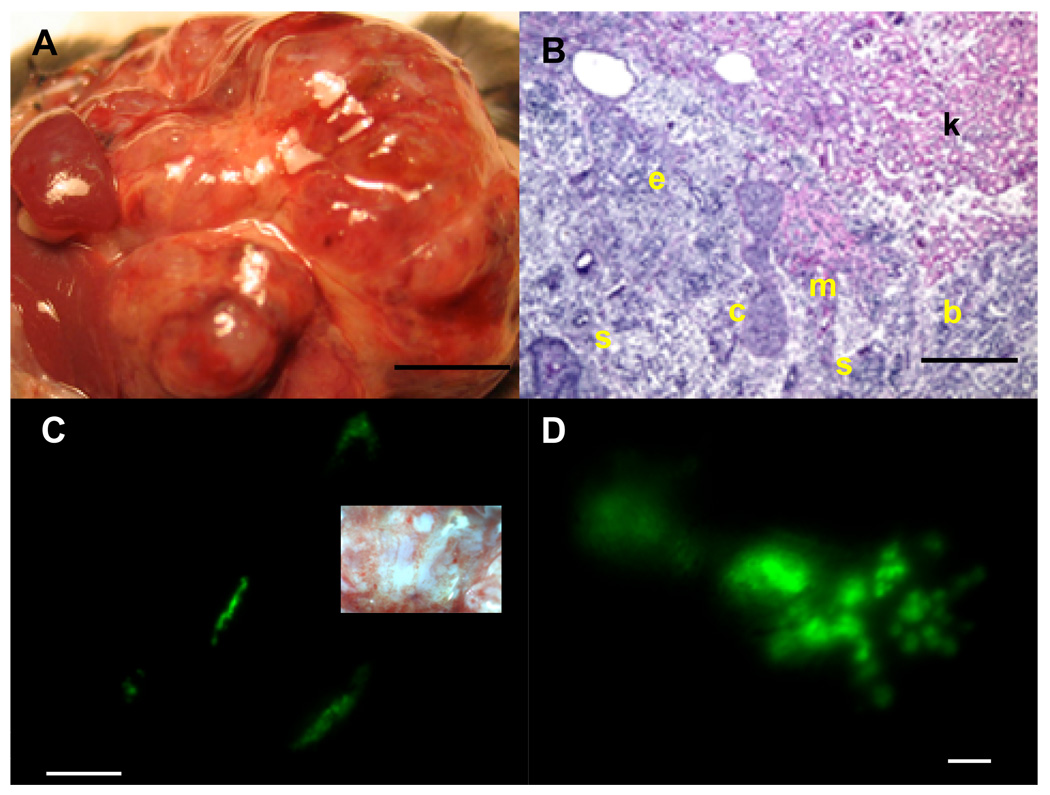
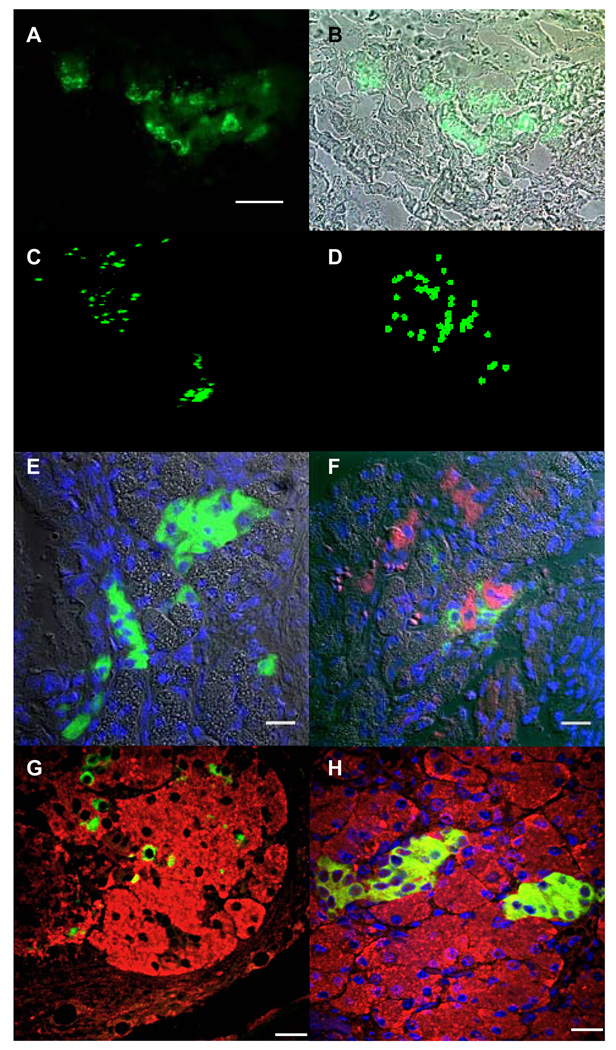
The MIP-GFP ESCs transplanted under the kidney capsule grew rapidly and formed a teratoma (n=8; Fig. 1A) consisting of cell types originating from all three germ layers (Fig. 1B). GFP-expressing cells were observed in clusters (Fig. 1C) with some clusters showing a distinct branching pattern (Fig. 1D) as well as cord-like structures (Fig. 2A, 2B). Three-dimensional reconstruction using a stack of images taken with a 2-photon confocal microscope revealed the spatial distribution of GFP-expressing cells in the clusters (Fig. 2C; also see movie in Supplemental data 1). Each cluster was comprised of 35 ± 16 cells (n=8; Fig. 2D and movie in Supplemental data 2). The number of GFP-positive clusters within each teratoma varied from 30–50 at week 4. Immunohistochemical analysis of the clusters showed insulin staining of the GFP-expressing cells confirming the beta-cell specific expression of MIP-GFP transgene (Fig. 2E). We also observed glucagon-positive cells adjacent to insulin-positive cells (Fig. 2F), as well as amylase-positive cells (Fig. 2G, 2H). Thus, the clusters and surrounding cells include cells from both endocrine and exocrine cells of the pancreas. We did not observe bihormonal cells (i.e. insulin and glucagon co-expression, data not shown).
Fig. 1. Formation of teratomas following transplantion of MIP-GFP ESCs under the kidney capsule.
A: Solid teratoma present 4-wk after transplantation. S: host spleen; L: host liver. Scale bar is 1 mm. B: Typical teratoma including mucosal epithelial cells (e), cartilage (c), muscle (m), squamous cells (s) and brain tissue (b). Note invasion of teratoma into host kidney tissue (k). C: GFP-expressing cells appear in clusters in the teratoma. Scale bar is 1 mm. Inset shows same area in bright field. Scale bar is 1 mm. D: Some GFP-expressing clusters show a distinct branching pattern. Scale bar is 100 µm.
Fig. 2. Beta-cell differentiation in a microenvironment.
A: GFP-expressing cells differentiated from transplanted MIP-GFP ESCs under the kidney capsule (frozen section). Note that the cells form a tubular structure. Scale bar is 200 µm. B: Merged image of fluorescent in A and bright-field images. C: Three-dimensional reconstruction of GFP-expressing cells. D: Mapping of GFP-expressing cells in C. E: Immunohistochemical analysis showing cells that stain with insulin. Nuclei are stained with DAPI (blue). Note that GFP-expression is lost on ethanol treatment during paraffin embedding and the green staining in this figure is insulin. Scale bar is 20 µm. F: Glucagon-expressing cells were also observed in the section (shown in red). Scale bar is 20 µm. G: Insulin-expressing cells scattered amongst amylase-expressing cells. Scale bar is 20 µm. H: Clusters of insulin-expressing cells embedded in amylase-expressing cells. Scale bar is 20 µm.
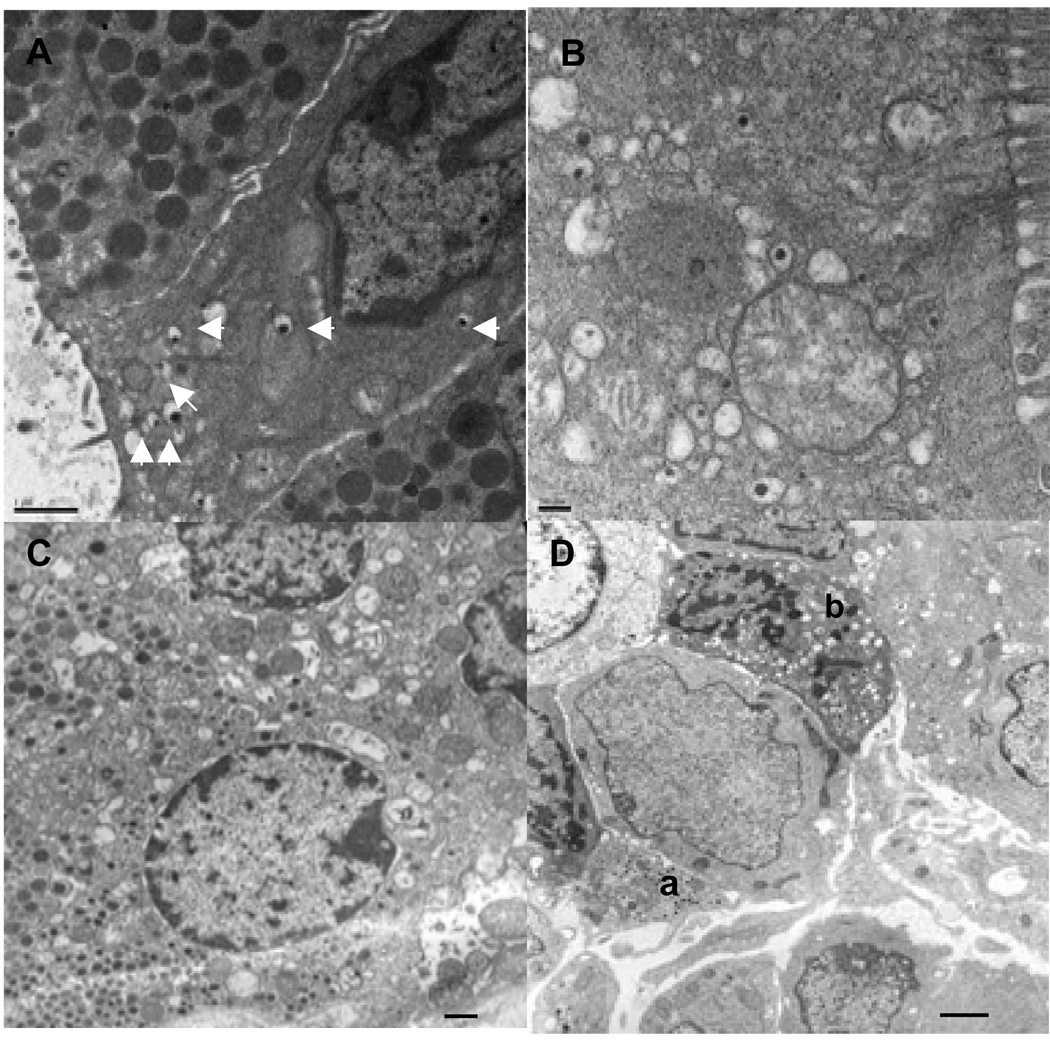
We also examined the ultrastructure of the GFP-expressing and adjacent cells by electron microscopy (Fig. 3). We observed epithelial cells having secretory granules with the dense core and halo similar to that of insulin-secreting pancreatic beta-cells and adjacent cells with characteristic exocrine-like secretory granules and microvilli (Fig. 3A and 3B). Cells containing glucagon-like secretory granules were also observed (Fig. 3C). The insulin-like granules present in the teratomas appear to resemble immature-type secretory granules of embryonic (E13.5) beta-cells (Fig. 3D).
Fig. 3. Ultrastructural analysis of GFP-expressing cells.
A: Electron micrograph showing a ductal epithelial-like cell with villi and containing insulin-like secretory granules (arrows). The adjacent cells have pancreatic acinar cell-like secretory granules. Scale bar is 1 µm. B: Insulin-like secretory granules in a glandular columnar epithelial cell with microvilli. Scale bar is 200 nm. C: Cell with glucagon-like secretory granules (lower left). Scale bar is 1 µm. D: Pancreatic cells from an embryo at E13.5 showing glucagon- (a) and insulin-like granule (b) containing cells. Scale bar is 1 µm.
Here, we describe the generation and preliminary characterization of MIP-GFP ESCs. The MIP-GFP ESCs can generate beta-like cells in teratomas and thus, may be useful for studying beta-cell formation in vitro. The MIP-GFP ESCs may have several advantages over standard ESCs for studying beta-cell formation in vitro: [1] The GFP-expressing cells can be readily identified visually and quantified; [2] the expression of GFP as a marker for beta-cells circumvents the problems associated with identification of beta-cells by insulin staining which can be confounded by the absorption of external insulin from the culture media (Rajagopal et al., 2003); [3] the formation of GFP-expressing cells can be continuously monitored and thus, formation of beta-cells monitored for long periods of time without terminating the culture to assess beta-cell formation by immunostaining or the presence of insulin mRNA or transcripts for other beta-cell proteins, which is also prone to amplification artifacts; and [4] the use of the insulin 1 promoter separates insulin expression in differentiated ESCs derived from cells of endodermal origin from those of neuronal cell lineage since neuronal cells express only insulin II (Deltour et al., 1993; Devaskar et al., 1993; Ku et al., 2007). Yolk sac and fetal liver express both insulin I and II, where the latter predominants (Devaskar et al., 1993; Giddings et al., 1994). In summary, MIP-GFP ESCs may be useful in defining culture conditions for reproducible and efficient generation of beta-cells, a first step in generating beta-cells for therapeutic studies.
Supplementary Material
Three-dimensional reconstruction using a stack of images taken by a 2-photon confocal microscope revealed a spatial distribution of GFP-expressing cells.
Representative beta-cell-like clusters mapped for quantification.
ACKNOWLEGEMENT
The authors thank Drs. Li Ma, Jikun Shen and Li Tang, and Ms. Ling Li and Yimei Chen for their technical assistance. The authors also thank Drs. Donald Steiner and Graeme Bell for their helpful discussions. This research was supported in part by US Public Health Service Grant DK-20595 to the University of Chicago Diabetes Research and Training Center (Animals Models Core), the Juvenile Diabetes Research Foundation, and a gift from the Kovler Family Foundation.
Contributor Information
Wieslawa M. Milewski, Department of Medicine, The University of Chicago, Chicago, Illinois
Karla A. Temple, Department of Medicine, The University of Chicago, Chicago, Illinois
Robin L. Wesselschmidt, Primogenix, Laurie, Missouri
Manami Hara, Department of Medicine, The University of Chicago, Chicago, Illinois.
REFERECES
- Chambers I, Colby D, Robertson M, Nichols J, Lee S, Tweedie S, Smith A. Functional expression cloning of nanog, a pluripotency sustaining factor in embryonic stem cells. Cell. 2003;113:643–655. doi: 10.1016/s0092-8674(03)00392-1. [DOI] [PubMed] [Google Scholar]
- D’Amour KA, Bang AG, Eliazer S, Kelly OG, Agunick AD, Smart NG, Moorman MA, Kroon E, Carpenter MK, Baetge EE. Production of pancreatic hormone-expressing endocrine cells from human embryonic stem cells. Nat Biotechnol. 2006;24:1392–1401. doi: 10.1038/nbt1259. [DOI] [PubMed] [Google Scholar]
- Deltour L, Leduque P, Blume N, Madsen O, Dubois P, Jami J, Bucchini D. Differential expression of the two nonallelic proinsulin genes in the developing mouse embryo. Proc Natl Acad Sci USA. 1993;90:527–531. doi: 10.1073/pnas.90.2.527. [DOI] [PMC free article] [PubMed] [Google Scholar]
- Devaskar SU, Singh BS, Carnaghi LR, Rajakumar PA, Giddings SJ. Insulin II gene expression in rat central nervous system. Regul Pept. 1993;48:55–63. doi: 10.1016/0167-0115(93)90335-6. [DOI] [PubMed] [Google Scholar]
- Giddings SJ, King CD, Harman KW, Flood JF, Carnaghi LR. Allele specific inactivation of insulin 1 and 2, in the mouse yolk sac, indicates imprinting. Nat Genet. 1994;6:310–313. doi: 10.1038/ng0394-310. [DOI] [PubMed] [Google Scholar]
- Gittes GK, Galante PE, Hanahan D, Rutter WJ, Debase HT. Lineage-specific morphogenesis in the developing pancreas: role of mesenchymal factors. Development. 1996;122:439–447. doi: 10.1242/dev.122.2.439. [DOI] [PubMed] [Google Scholar]
- Hansson M, Tonning A, Frandsen U, Petri A, Rajagopal J, Englund MCO, Heller RS, Håkansson J, Fleckner J, Sköld HN, Melton D, Semb H, Serup P. Artifactual insulin release from differentiated embryonic stem cells. Diabetes. 2004;53:2603–2609. doi: 10.2337/diabetes.53.10.2603. [DOI] [PubMed] [Google Scholar]
- Hara M, Wang X, Kawamura T, Bindokas VP, Dizon RF, Alcoser SY, Magnuson MA, Bell GI. Transgenic mice with green fluorescent protein-labeled pancreatic beta-cells. Am J Physiol Endocrinol Metab. 2003;284:E177–E183. doi: 10.1152/ajpendo.00321.2002. [DOI] [PubMed] [Google Scholar]
- Hart AH, Hartley L, Ibrahim M, Robb L. Identification, cloning and expression analysis of the pluripotency promoting nanog genes in mouse and human. Dev Dynamics. 2004;230:187–198. doi: 10.1002/dvdy.20034. [DOI] [PubMed] [Google Scholar]
- Hosler BA, LaRosa GJ, Grippo JF, Gudas LJ. Expression of rex-1, a gene containing zinc finger motifs, is rapidly reduced by retinoic acid in F9 teratocarcinoma cells. Mol Cell Biol. 1989;9:5623–5629. doi: 10.1128/mcb.9.12.5623. [DOI] [PMC free article] [PubMed] [Google Scholar]
- Itskovitz-Eldor J, Schuldiner M, Karsenti D, Eden A, Yanuka O, Amit M, Soreq H, Benvenisty N. Differentiation of human embryonic stem cells into embryoid bodies compromising the three embryonic germ layers. Mol Med. 2000;6:88–95. [PMC free article] [PubMed] [Google Scholar]
- Kroon E, Martinson LA, Kadoya K, Bang AG, Kelly OG, Eliazer S, Young H, Richardson M, Smart NG, Cunningham J, Agulnick AD, D'Amour KA, Carpenter MK, Baetge EE. Pancreatic endoderm derived from human embryonic stem cells generates glucose-responsive insulin-secreting cells in vivo. Nat Biotechnol. 2008;26:443–445. doi: 10.1038/nbt1393. [DOI] [PubMed] [Google Scholar]
- Ku HT, Chai J, Kim YJ, White P, Purohit-Ghelani S, Kaestner KH, Bromberg JS. Insulin-expressing colonies developed from murine embryonic stem cell-derived progenitors. Diabetes. 2007;56:921–929. doi: 10.2337/db06-0468. [DOI] [PubMed] [Google Scholar]
- Maldonado TS, Kadison AS, Crisra CA, Grau JB, Alkasab SL, Longaker MT, Gittes GK. Ontogeny of activin B and follistatin in developing embryonic mouse pancreas: Implications for lineage selection. J Gartointest Surg. 2000;4:269–275. doi: 10.1016/s1091-255x(00)80075-x. [DOI] [PubMed] [Google Scholar]
- Nagy A, Gertsenstein M, Vintersten K, Behringer R. Manipulating the mouse embryo – A laboratory manual. Cold Spring Harbor, New York: Cold Spring Harbor Laboratory Press; 2003. pp. 380–387. [Google Scholar]
- Okazawa H, Okamoto K, Ishino F, Ishino-Kaneko T, Takeda S, Toyoda Y, Muramatsu M, Hamada H. The oct3 gene, a gene for an embryonic transcription factor, is controlled by a retinoic acid repressible enhancer. EMBO J. 1991;10:2997–3005. doi: 10.1002/j.1460-2075.1991.tb07850.x. [DOI] [PMC free article] [PubMed] [Google Scholar]
- Rajagopal J, Anderson WJ, Kume S, Martinez OI, Melton DA. Insulin staining of ES cell progeny from insulin uptake. Science. 2003;299:363. doi: 10.1126/science.1077838. [DOI] [PubMed] [Google Scholar]
- Reubinoff BE, Pera MF, Fong CY, Trounson A, Bongso A. Embryonic stem cell lines form human blastocyst: somatic differentiation in vitro. Nat Biotechnol. 2000;18:399–404. doi: 10.1038/74447. [DOI] [PubMed] [Google Scholar]
- Robertson RP. Islet transplantation as a treatment for diabetes – a work in progress. N Engl J Med. 2004;350:694–705. doi: 10.1056/NEJMra032425. [DOI] [PubMed] [Google Scholar]
- Scholer HR, Hatzopoulos AK, Balling R, Suzuki N, Gruss P. A family of octamer-specific proteins present during mouse embryogenesis: evidence for germline-specific expression of an Oct factor. EMBO J. 1989;8:2543–2550. doi: 10.1002/j.1460-2075.1989.tb08392.x. [DOI] [PMC free article] [PubMed] [Google Scholar]
- Sipione S, Eshpeter A, Lyon JG, Korbutt GS, Bleackley RC. Insulin expressing cells from differentiated embryonic stem cells are not beta cells. Diabetologia. 2004;47:499–508. doi: 10.1007/s00125-004-1349-z. [DOI] [PubMed] [Google Scholar]
- Street CN, Sipione S, Helms L, Binette T, Rajotte RV, Bleackley RC, Korbutt GS. Stem cell-based approaches to solving the problem of tissue supply for islet transplantation in type 1 diabetes. Int J Biochem Cell Biol. 2004;36:667–683. doi: 10.1016/j.biocel.2003.09.005. [DOI] [PubMed] [Google Scholar]
- Thomson JA, Itskovitz-Eldor J, Shapiro SS, Waknitz MA, Swiergiel JJ, Marshall VS, Jones JM. Embryonic stem cell lines derived from human blastocysts. Science. 1998;282:1145–1147. doi: 10.1126/science.282.5391.1145. [DOI] [PubMed] [Google Scholar]
- Wu DY, Yao Z. Isolation and characterization of the murine nanog gene promoter. Cell Res. 2005;15:317–324. doi: 10.1038/sj.cr.7290300. [DOI] [PubMed] [Google Scholar]
Associated Data
This section collects any data citations, data availability statements, or supplementary materials included in this article.
Supplementary Materials
Three-dimensional reconstruction using a stack of images taken by a 2-photon confocal microscope revealed a spatial distribution of GFP-expressing cells.
Representative beta-cell-like clusters mapped for quantification.


