

Abstract
We have used a Cu(I)-catalyzed azide-alkyne cycloaddition (CuAAC) “click” reaction to prepare self-assembled monolayers (SAMs) presenting the cell adhesion peptide Arg-Gly-Asp-Ser-Pro (RGDSP) in a bio-inert background. The surface preparation approach involved first forming mixed SAMs with an azide-terminated hexaethylene glycol alkanethiolate (HS---EG6---N3) and a triethylene glycol alkanethiolate (HS---EG3), then using the CuAAC reaction to immobilize an alkyne-terminated peptide. The mixed SAMs were classified as bio-inert, as SAMs comprised of 10 mole percent HS---EG6---N3 and 90 mole percent HS---EG3 showed minimal non-specific protein adsorption in solutions of 1 mg/ml lysozyme or 10% fetal bovine serum. The reaction between an acetylene-terminated peptide and an azide-terminated SAM proceeded rapidly and quantitatively in the presence of a Cu(I)-TBTA complex, displaying pseudo-first order kinetics with a rate constant of ∼ 0.2 min−1. Varying the ratio of HS---EG6---N3 to HS---EG3 during SAM formation allowed for control over the density of azide and, in turn, the density of RGDSP on the substrates. These substrates were therefore used to study the detailed relationship between RGDSP surface density and human mesenchymal stem cell (hMSC) adhesion, spreading, and focal adhesion complex formation, without interference from non-specifically adsorbed serum proteins. Results indicate that an RGDSP intermolecular spacing of 36 nm or less (≥ 0.01 mole percent on the surface) is sufficient for hMSC adhesion and a spacing of 11 nm or less (≥ 0.05 mole percent on the surface) is sufficient for cell spreading and focal adhesion complex formation. In total, our results demonstrate that CuAAC is a suitable mechanism for conjugating peptides to otherwise bio-inert SAMs, and that the resulting SAMs can be used to study the dependence of peptide density on stem cell behavior.
Introduction
Self-assembled monolayers (SAMs) have emerged as an important tool in the study of biochemical events due to their controllable surface properties. The ability to tailor surface features, such as bio-inertness or biomolecule presentation, has led to SAM use in a wide variety of applications, including biosensors1, cell culture substrates2-4, and as interfaces to analyze biomolecular interactions5, 6. SAMs have been formed on a variety of surfaces, including glass7, silicon8, gold9, diamond10, and amorphous carbon11. SAMs formed via coordination of alkanethiolates onto gold-coated substrates are of particular interest in biochemical applications, as they are formed easily and rapidly12; stable in polar solvents13; and amenable to a number of different analytical techniques, including polarization-modulated infrared reflectance-absorbance spectroscopy (PM-IRRAS)14, matrix-assisted laser desorption-ionization time-of-flight mass spectrometry (MALDI-TOF-MS)15, x-ray photoelectron spectroscopy (XPS)15, surface plasmon resonance (SPR)16, ellipsometry17, and electrochemical analysis18.
Substrates designed to study biochemical events, such as cell adhesion19 or protein-ligand binding20, often require presentation of specific bio-molecules within a background that is resistant to non-specific protein adsorption. Previous work has shown that terminal oligo(ethylene glycol) (OEG) chains on alkanethiolate SAMs prevent non-specific protein adsorption to the monolayer21, which is the foremost criterion for classifying a substrate as “bio-inert”. Presentation of bio-molecules on these bio-inert OEG SAMs has traditionally relied upon on one of two distinct strategies. The first strategy uses simultaneous co-adsorption of an OEG-terminated alkanethiolate and a bio-molecule-terminated OEG-alkanethiolate onto gold substrates. For example, Whitesides and co-workers demonstrated that mixed SAMs formed from solutions containing varying molar ratios of a triethylene glycol-terminated alkanethiolate and an OEG-alkanethiolate terminated by the cell adhesion peptide Arg-Gly-Asp (RGD) resist non-specific protein adsorption, but enable RGD-dependent adhesion and spreading of bovine capillary endothelial cells19. The second strategy is a sequential process, wherein the initial step involves formation of a bio-inert monolayer, and subsequent steps involve covalently conjugating biomolecules, such as peptides, proteins, or oligonucleotides, onto the substrate. Whitesides and co-workers provided an early example of this strategy by conjugating proteins (e.g. carbonic anhydrase and lysozyme) to a carboxylate-terminated OEG monolayer via carbodiimide condensation22. More recently, mechanisms such as Michael-type addition of a thiol to an α,β-unsaturated carbonyl23, or secondary amine formation via Schiff base intermediate24, have been used to conjugate biomolecules to SAM substrates. These mechanisms are advantageous, in that the required functional groups are common to biological molecules, the reactions proceed in aqueous solvents, and conjugation typically does not alter biomolecule activity. However, these mechanisms are also highly dependent on reaction conditions25, involve reactive groups or intermediates that are susceptible to hydrolysis26, 27, and are prone to non-selective conjugation (e.g. conjugation to lysine ε-amines, amine-sulfhydryl cross-reactivity28). These tendencies can limit control over biomolecule density, orientation, or activity, which are features that must be tightly regulated to tailor the biochemical function of SAMs.
The copper(I)-catalyzed azide-alkyne cycloaddition (CuAAC) reaction, a type of “click” chemistry29, has several potential advantages over mechanisms currently used to conjugate biomolecules to SAMs. The reaction is rapid and efficient, is pH independent, forms a highly bio-stable bond, is chemoselective against reactive species common in biomolecules, and it uses hydrolytically stable reactive species that are easily introduced into bio-molecules30. Recently, Chidsey and co-workers used CuAAC to chemoselectively conjugate acetylene-bearing oligonucleotide probes to azide-terminated alkanethiol SAMs on gold substrates31. In this work, single-stranded DNA hybridization to surface-immobilized oligonucleotide probes was more than 90% efficient, demonstrating bio-molecule function after the cycloaddition reaction. In another set of studies, Chidsey and co-workers characterized CuAAC reaction kinetics at the SAM surface by coupling an acetylene-bearing ferrocene to azide-terminated alkanethiol monolayers32. Their results demonstrated that the CuAAC reaction at the SAM surface proceeds quantitatively, enabling precise control over the density of acetylene-bearing molecules on the substrate by varying azide density in the monolayer. To date, CuAAC on SAM surfaces has been extended to azide-terminated monolayers on silica33, as well as acetylene-terminated monolayers on gold34. However, previous studies have not yet examined the applicability of “click” chemistry to specifically modulate cell or protein interactions with otherwise bio-inert SAMs.
We hypothesized that CuAAC, or “click” chemistry, can be used to immobilize an alkyne-terminated cell adhesion peptide to azide groups presented among tri(ethylene glycol) (EG3) groups on an otherwise bio-inert SAM surface (Fig. 1). Therefore, we have prepared mixed self-assembled monolayers comprised of 11-tri(ethylene glycol)-undecane-1-thiol (HS---EG3) and 11-azidohexa(ethylene glycol)-undecane-1-thiol (HS---EG6---N3). A fibronectin-derived cell-adhesion peptide Arg-Gly-Asp-Ser-Pro (RGDSP) bearing an acetylene moiety was efficiently immobilized to these SAM surfaces via “click” cycloaddition. RGDSP is chosen based on previous work demonstrating specific cell adhesion to monolayers presenting the tripeptide Arg-Gly-Asp19, and the particular importance of fibronectin in stem cell adhesion and function35-37. SAMs presenting RGDSP conjugated via CuAAC were then used as a platform to study the correlation between peptide surface density and adhesion, spreading, and focal adhesion complex formation of human mesenchymal stem cells (hMSCs), an important cell type in emerging cell therapy and tissue engineering approaches. The degree of control over cell-surface interaction achieved using a ”click” immobilization strategy demonstrated here suggests that this is a promising chemical strategy to precisely tailor peptide surface density on SAMs for widespread biochemical applications.
Figure 1.
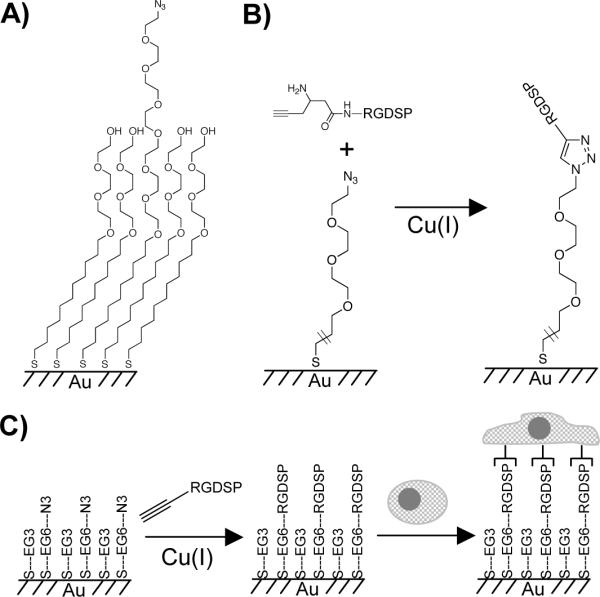
Mixed self-assembled monolayer presenting azide groups to allow conjugation of acetylene-bearing bio-molecules (A), the reaction of acetylene-bearing RGDSP with azide-terminated SAMs in the presence of copper(I) (B), and a schematic representation of the dependence of RGDSP surface density on human mesenchymal stem cell adhesion and spreading (C).
Experimental Section
Materials and Reagents
Gold substrates (5nm Cr, 100nm Au) were from Evaporated Metal Films (Ithaca, NY). 11-tri(ethylene glycol)-undecane-1-thiol (HS---EG3), Piperidine, dimethylformamide (DMF), triisoproylsilane (TIPS), acetone, 99.999% cuprous bromide (CuBr), dimethylsulfoxide (DMSO), Tris[(1-benzyl-1H-1,2,3-triazol-4-yl)methyl]amine (TBTA), and sodium ascorbate (Na-Asc) were from Sigma-Aldrich (St. Louis, MO). 11-azidohexaethylene glycol)-undecane-1-thiol (HS---EG6---N3) was purchased from Prochimia (Sopot, Poland). Fmoc-protected amino acids and Rink amide MBHA peptide synthesis resin were from NovaBiochem (San Diego, CA). Hydroxybenzotriazole (HOBt) was from Advanced Chemtech (Louisville, KY). Diisopropylcarbodiimide (DIC) and Fmoc-(R)-3-amino-5-hexynoic acid were from Anaspec (San Jose, CA). Trifluoroacetic acid (TFA) and diethyl ether were from Fisher Scientific (Fairlawn, NJ). Absolute ethanol was from AAPER Alcohol and Chemical Co. (Shelbyville, KY). Human mesenchymal stem cells (hMSCs) were from Cambrex (North Brunswick, NJ). 1× minimum essential medium, alpha was from CellGro (Mannassas, VA). MSC-qualified fetal bovine serum was from Invitrogen (Carlsbad, CA). 0.05% Trypsin and penicillin/streptomycin were from Hyclone (Logan, UT). Actin cytoskeleton staining kit and FITC-conjugated secondary antibody were from Chemicon (Billerica, MA).
Peptide synthesis
Peptides were synthesized using standard Fmoc solid phase peptide synthesis on a 316c automated peptide synthesizer (CSbio, Menlo Park, CA). Rink amide MBHA resin was used as the solid phase, and HOBt and DIC were used for amino acid activation and coupling. The alkyne functionality was introduced into the peptide by adding the non-natural amino acid Fmoc-(R)-3-amino-5-hexynoic acid to the N-terminus in the final coupling step. After coupling the final amino acid, incubation of resin in TFA, TIPS, and deionized (DI) water (95:2.5:2.5) for 4 hours released the peptide from the resin and removed protecting groups. The peptide was then extracted from the TFA/TIPS/H2O cocktail by precipitation with cold diethyl ether. Lyophilized peptides were analyzed on a Bruker Reflex II MALDI-TOF mass spectrometer (Billerica, MA) using dihydroxybenzoic acid (DHB) (10mg/mL) as matrix in acetonitrile:DI water (7:3).
SAM formation
Gold substrates were cut, sonicated in ethanol for 3 minutes, washed with ethanol, and dried under a stream of nitrogen prior to monolayer formation. Monolayers were formed by incubating cleaned gold substrates in an ethanolic solution of HS---EG3 and HS---EG6---N3 at various molar ratios (2mM total thiol concentration) overnight. After monolayer formation, gold substrates were removed from the ethanolic solution, washed with ethanol, and dried under a stream of nitrogen.
PM-IRRAS analysis of SAMs
Infrared spectra of SAMs on gold films were recorded using a Nicolet Magna-IR 860 FT-IR spectrometer with photoelastic modulator (PEM-90, Hinds Instruments, Hillsboro, OR), synchronous sampling demodulator (SSD-100, GWC Technologies, Madison, WI), and a liquid nitrogen-cooled mercury cadmium telluride detector. All spectra were obtained at an incident angle of 83° with modulation centered at 1500cm−1 and 2500cm−1. For each sample, 500 scans were taken at a resolution of 4 cm-1 per modulation center. Data were collected as differential reflectance vs. wave number. The method outlined by Frey and co-workers was used to normalize and convert spectra to absorbance units vs. wave number38.
Surface plasmon resonance analysis of N3-terminated SAMs
Gold substrates used for SPR experiments were purchased from Biacore (Piscataway, NJ). SAMs used in SPR experiments were prepared using the method described earlier. Protein adsorption to mixed SAMs of 90mol% HS--EG3 and 10mol% HS---EG6---N3 was analyzed using a BIAcore 2000 system (Piscataway, NJ). Typical binding experiments were performed as follows: 1) phosphate buffered saline (pH 7.4) (PBS) was passed over the SAM to establish the plasmon resonance baseline of the surface, 2) 100μL of 1 mg/mL lysozyme or 10% fetal bovine serum in PBS was passed over the SAM to allow protein binding to the surface, and 3) PBS was passed over the SAM to establish the change in surface plasmon resonance signal due to the presence of adsorbed protein. Bound protein was quantified using a factor correlating surface plasmon resonance units (RU) to surface density of bound protein, 1000 RU = 1 ng/mm2 bound protein39.
“Click” coupling of acetylene-bearing peptides to azide-terminated SAMs
CuBr and Na-Asc were dissolved in DMSO at a concentration of 2mM by sonicating for 10 minutes. TBTA was then dissolved in this solution at a concentration of 2mM by sonicating for an additional 10 minutes. Lyophilized peptide was dissolved in HEPES (0.1 M, pH 8.5) to achieve a peptide concentration of 2mM. The DMSO solution containing CuBr, Na-Asc, and TBTA and the HEPES solution containing peptide were then mixed at a 1:1 ratio by vortexing, followed by sonication for 10 minutes. Gold substrates were immersed in this solution immediately after SAM formation and the peptide-monolayer reaction was allowed to proceed for a specified duration of time40. At the reaction endpoint, gold substrates were washed sequentially with DI water, 0.1% sodium dodecyl sulfate in water, DI water, and ethanol, followed by drying under a stream of nitrogen.
hMSC Adhesion
To maintain multipotency, hMSCs were expanded at low density on tissue culture treated polystyrene plates using the method described previously by Sotiropoulou et al41. At passage 7, cells were harvested from the plate, suspended in medium supplemented with 10% fetal bovine serum, and counted using a hemacytometer. Cells were collected as a pellet by centrifugation at 1100 rpm for 5 minutes, the media was decanted off of the pellet, and the cells were suspended in fresh serum-supplemented medium at a density of 20,000 cells/250 μL. SAM preparation and RGDSP conjugation were performed using the protocols described above. Immediately after RGDSP conjugation, SAMs were placed into 1 mL of 1× PBS (pH 7.4) in a 12-well tissue culture plate to prevent degradation of the monolayer due to air oxidation42. PBS was aspirated from the wells and replaced with 1.25 mL of hMSC growth medium, followed by addition of 250 μL of the cell suspension directly over the SAM substrate in each well. Plates were then gently rocked for 10 seconds to evenly distribute cells over the substrate surface. Substrates were then incubated for 10 hours in a humid environment at 37°C, 5% CO2 to allow hMSC attachment. At the end of the 10 hour attachment period, the hMSC growth media was aspirated from the well and the substrates were gently washed with sterile 1× PBS to remove any loosely bound cells. The 1× PBS solution was then replaced with 1× PBS containing 4.0 μM Calcein AM, a fluorescent dye that is converted from a non-fluorescent state to a fluorescent state by esterase activity within living cells43, to allow for visualization of cells using an Olympus IX51 inverted epifluorescent microscope equipped with a FITC filter cube set. Attached cell number was counted on 3 substrates per condition, and statistical analysis of the resulting mean and standard deviation values was performed using ANOVA (p < 0.05 indicated a statistically significant difference).
Immunocytochemistry of hMSC cytoskeleton
hMSCs were seeded on the SAMs as described previously. After washing away loosely bound cells using 1× PBS, cytoskeletal immunostaining of hMSCs was performed by following the protocol supplied by the manufacturer. Briefly, a 4% paraformaldehyde solution in 1× PBS was added to the wells for 15 minutes to fix the cells, followed by a 5 minute incubation in a 1× PBS solution containing 0.05% Tween-20 to permeabilize the cells. Wells were subsequently blocked to prevent non-specific antibody adsorption using a 1× PBS solution containing 0.1 wt% bovine serum albumin. After blocking, a 1× PBS solution containing an anti-Vinculin primary antibody was added to each well and allowed to incubate at room temperature for 60 minutes. The wells were then washed gently three times using a 1× PBS solution containing 0.1 wt% bovine serum albumin. Immediately after washing, a 1× PBS solution containing a fluorescein-tagged mouse anti-human IgG secondary antibody and a TRITC-tagged anti-Phalloidin antibody was added to each well and allowed to incubate at room temperature for 45 minutes. Substrates were then washed using the method described previously, followed by addition of a 1× PBS solution containing DAPI nuclear counterstain to allow for visualization of nuclei within each sample. At the end of the 5-minute DAPI nuclear counterstaining step, substrates were washed using the previously described method. Cytoskeletal and nuclear staining was analyzed using an Olympus IX51 inverted epifluorescent microscope equipped with FITC, TRITC, and DAPI filter cube sets. Cell nuclei and focal adhesions per cell were manually counted within 6 cells per condition and statistical analysis on the resulting values was performed using ANOVA (p < 0.05 indicated statistically significant differences).
Results and Discussion
SAM formation on gold substrates
Formation of an alkanethiolate SAM on gold involves adsorption of the thiolate tail group onto the gold substrate, followed by packing of the alkyl layer into an ordered, well-defined array. We have characterized HS---EG6---N3 SAM formation on gold substrates by analyzing the absorption of IR light by the monolayer at wavelengths that correspond to key functional groups (e.g. methylene, ether, and alkyl azide) of the HS---EG6---N3 molecule. The precise locations of peaks corresponding to the methylene groups of the alkyl chain and the oligo(ethylene glycol) subunit in SAMs prepared with 2mM HS---EG6---N3 are consistent with previous spectra collected from SAMs formed from oligo(ethylene glycol) terminated alkanethiolates14, and are indicative of well-packed HS---EG6---N3 SAM formation on the gold substrate (Fig. 2). In particular, the location of peaks corresponding to the symmetric and asymmetric stretching modes of methylene groups (∼2850cm−1 and 2920cm−1, respectively) are indicative of an ordered and well-packed monolayer44, while the location of the peak corresponding to the asymmetric stretching mode of C-O-C groups within ethylene glycol chains (∼1130cm−1) is common to SAMs containing oligo(ethylene glycol) alkanethiolates14.
Figure 2.
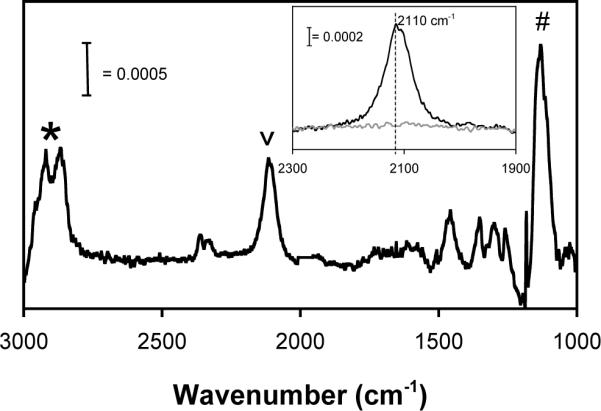
PM-IRRAS spectrum of a 100% HS---EG6---N3 SAM. Inset: PM-IRRAS spectrum of a 100% HS---EG6---N3 SAM  and a 100% HS---EG3 SAM
  centered around 2100 cm−1. * denotes methylene symmetric and asymmetric stretch (2850, 2920 cm−1, respectively), # denotes C-O-C stretch (1130 cm−1), v denotes azide stretch (2110 cm−1).
Comparison of spectra from SAMs formed in an ethanolic solution containing either 2mM HS---EG3 or 2mM HS---EG6---N3 demonstrates the emergence of a peak at ∼2110 cm−1 in the HS---EG6---N3 SAMs (Fig. 2, inset). This peak can be attributed to the alkyl azide terminal group, as previous work from Chidsey and co-workers has identified the peak corresponding to the asymmetric stretching mode of an alkyl azide on a SAM to be located near ∼2000 cm−1 32. Importantly, the precise location of peaks characteristic of a close-packed, well-ordered SAM terminated with alkyl azide groups demonstrates that SAMs can be routinely formed from an azide-terminated alkanethiolate bearing an oligo(ethylene glycol) subunit.
HS---EG6---N3 mole fraction in alkanethiolate SAMs
In previous work characterizing mixed SAMs of two different alkanethiolates, the ratio of alkanethiolates in solution differ when compared to the ratio of alkanethiolates in the resulting SAM. For example, Stayton and colleagues15 have demonstrated that during co-adsorption of an oligo(ethylene glycol)-terminated alkanethiolate and a biotin-terminated alkanethiolate, the adsorption of the biotin-terminated alkanethiolate is favored. In contrast, during co-adsorption of a hexadecanethiol and a biotin-terminated alkanethiolate, adsorption of the hexadecanethiol is preferred. Of particular relevance to our current study, Chidsey and co-workers32 have shown that during co-adsorption of an octanethiol and an azidoundecyl alkanethiolate, the mole fraction of each alkanethiolate in solution is approximately equal to the mole fraction of each alkanethiolate in the resulting SAM. Here we have used PM-IRRAS to study the relationship between the mole fraction of HS---EG6---N3 in ethanol during SAM formation and the mole fraction of HS---EG6---N3 in the resulting SAM. Our results demonstrate that the mole fraction of azide in the resulting SAM is higher than the mole fraction of azide in solution during SAM formation (Fig. 3). Assuming that the adsorption of thiols onto gold is irreversible and follows first-order Langmuir kinetics, this result suggests that the rate of adsorption of HS---EG6---N3 onto gold is faster than the rate of adsorption of HS---EG3 onto gold. Under saturating conditions the ratio of HS---EG6---N3 mole fraction (χHS---EG6---N3) and HS---EG3 mole fraction (χHS---EG3) in the SAM should be proportional to the ratio of χHS---EG6---N3 and χHS---EG3 in solution multiplied by the ratio of the rate constants of adsorption of HS---EG6---N3 (kHS---EG6---N3) and HS---EG3 (kHS---EG3) onto gold (A = kHS---EG6---N3 /kHS---EG3):
| (1) |
Fitting this function to the data presented in Figure 3 provides an A value of 1.69, indicating that adsorption of HS---EG6---N3 is only slightly faster than adsorption of HS---EG3. Comparatively, Stayton and co-workers have previously demonstrated an A value of 4.2 for the co-adsorption of an oligo(ethylene glycol) alkanethiolate and a biotin-terminated oligo(ethylene glycol) alkanethiolate15. The different A values determined from our results and the work of Stayton and co-workers demonstrate that the extent of preferential alkanethiol adsorption during binary SAM formation is alkanethiol-dependent, and thus is cannot be generalized. However, our results do demonstrate that the density of azide functional group presentation by a SAM can be controlled by varying the ratio of HS---EG6---N3 and HS---EG3 in ethanol during SAM formation.
Figure 3.
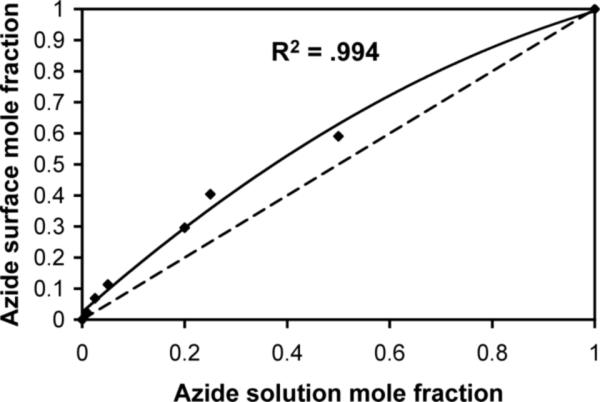
Correlation between HS---EG6---N3 mole fraction in ethanol during SAM formation and HS---EG6---N3 mole fraction in the resulting SAMs (black dots) as determined by calculating the area under the azide peak ( λ = 2110 cm−1) of PM-IRRAS spectra collected for each SAM. Dashed line indicates the expected trend if HS---EG6---N3 concentration in ethanol correlates directly with HS--N3 density in the resulting SAM. Solid line indicates the observed trend of preferential HS---EG6---N3 adsorption onto gold from an ethanolic solution containing various mole ratios of HS---EG6---N3 and HS---EG3.
Non-specific protein adsorption onto mixed SAMs
A fundamental characteristic of a bio-inert surface is resistance to non-specific protein adsorption. We have characterized protein adsorption onto mixed HS--EG3 and HS---EG6---N3 SAMs by passing a 1mg/mL lysozyme solution or a 10% fetal bovine serum (FBS) solution over a mixed HS---EG3/HS---EG6---N3 SAM (9:1 molar ratio) (Fig. 4). Our results demonstrate that surface plasmon resonance of mixed HS---EG3/HS---EG6---N3 SAMs shifts by ∼ 500 RU after passing either1 mg/mL lysozyme or 10% FBS over the surface. Assuming that a protein surface density of ∼ 1 ng/mm2 induces a surface plasmon resonance shift of 1000 RU as described previously39, the surface density of adsorbed protein on mixed HS---EG3/HS---EG6---N3 SAMs is ∼0.5ng/mm2. Previous work from Whitesides and co-workers demonstrated that a complete monolayer of lysozyme induces a surface plasmon resonance shift of ∼2700 RU, or ∼27 ng/mm2 22. By comparing this full monolayer value with our SPR data, we can calculate that the surface coverage of lysozyme on a mixed HS---EG6---N3/HS---EG3 SAM due to non-specific adsorption is ∼1.8% of a complete monolayer. Previous work by Whitesides and co-workers comparing resistance to non-specific protein adsorption by SAMs presenting a variety of functional groups classified surfaces as bio-inert when lysozyme adsorption was less than ∼6% of a total monolayer45. Using this same criterion in the classification of our surfaces, our results demonstrate that mixed HS---EG3/HS---EG6---N3 SAMs can be classified as bio-inert.
Figure 4.
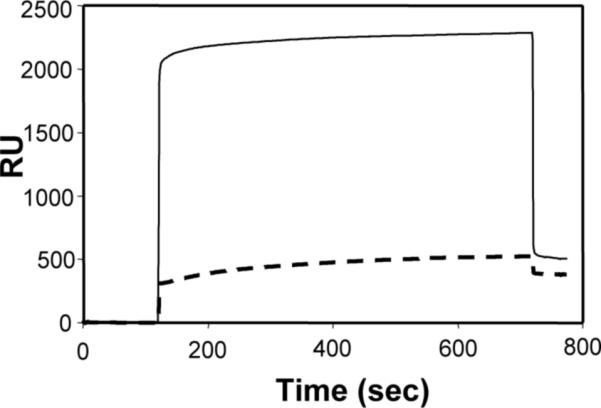
Surface plasmon resonance sensorgrams of the adsorption of lysozyme (1mg/mL in PBS pH 7.4) (dashed line) and cell culture serum (10% fetal bovine serum in PBS pH 7.4) (solid line) onto a 10mol% HS---EG6---N3, 90mol% HS---EG3 monolayer. Adsorption is reported in response units (RU) (1000 RU=1ng/mm2 adsorbed protein)35.
Peptide conjugation to SAMs via ”click” cycloaddition
We used PM-IRRAS to characterize cycloaddition between acetylene-bearing peptides and azide-terminated oligo(ethylene glycol) SAMs in the presence of Cu(I) (Fig. 5). Specifically, a SAM was formed by immersing a gold substrate in an ethanolic solution of 80mol% HS---EG3 and 20mol% HS---EG6---N3, and substrates were analyzed before and after allowing the surface to react with Hex-RGDSP in the presence of a Cu(I) catalyst (1 mM CuBr and NaAsc) for 90 minutes. Comparison of the location and intensity of the peaks corresponding to the stretching modes of methylene and oligo(ethylene glycol) chains before and after reaction show no significant differences, indicating that the reaction conditions do not adversely affect the underlying SAM. However, the peak corresponding to the asymmetric stretching mode of the azide at ∼2110cm−1 is not detectable in the IR spectrum collected after the reaction. This loss of the characteristic azide peak suggests that the reaction between surface azide groups and peptidyl acetylene groups is proceeding to completion. Additionally, the emergence of two new peaks - the amide I C=O stretching mode at ∼1675cm−1 and amide II NH bending mode at 1580cm−1 - indicates the presence of an amide-containing peptide molecule on the surface at the end of the reaction. This result is consistent with previous work from Corn and co-workers demonstrating the emergence of peaks at ∼1675 cm−1 and 1580 cm−1 after conjugating poly(lysine) to a carboxylate-terminated SAM46. Taken together, the concurrent loss of the azide peak and emergence of the amide I and amide II peaks over the course of the reaction indicate that Hex-RGDSP and surface azide groups undergo cycloaddition in the presence of Cu(I)-catalyst, allowing specific conjugation of RGDSP to the SAM surface.
Figure 5.
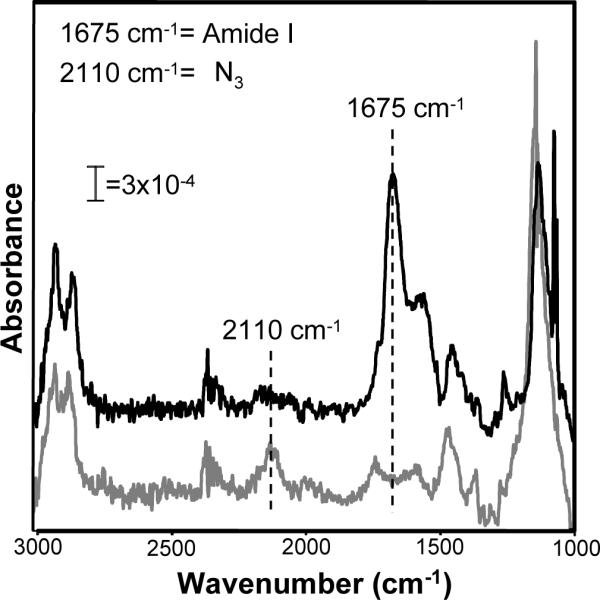
Conjugation of acetylene-bearing RGDSP to azide-terminated OEG SAMs demonstrated by PM-IRRAS spectra of a SAM formed from an ethanolic solution of 20mol% HS---EG6---N3 and 80mol% HS---EG3 immediately after SAM formation (gray line) and after Cu-catalyzed cycloaddition between surface azide groups and Hex-RGDSP (black line) . Dashed lines indicate location of the azide peak (λ=2110cm−1) and amide I peak (λ=1675cm−1).
Specificity and chemoselectivity of peptide conjugation to SAMs
To analyze the specificity and chemoselectivity of peptide conjugation to SAMs via CuAAC, we collected infrared spectra of SAMs formed from an ethanolic solution of 80mol% HS---EG3 and 20mol% HS---EG6---N3 after reaction with RGDSP under various reaction conditions (Fig. 6). Specifically, we collected PM-IRRAS spectra centered around the azide peak at ∼2110cm−1 (Fig 6A) and the amide I peak at ∼1675cm−1 (Fig 6B) after 90-minute reaction between surface azide groups and: (1) Hex-RGDSP in the presence of Cu(I); (2) Hex-RGDSP in the absence of Cu(I); and (3) RGDSP, a peptide lacking an acetylene group, in the presence of Cu(I). The infrared spectra collected after reactions (2) or (3) clearly display a peak corresponding to the asymmetric azide stretching mode at ∼2110cm−1, indicating that the azide has not reacted. In contrast, the spectrum collected after reaction (1) lacks the azide peak, indicating that the azide has reacted. Additionally, amide I and amide II peaks are absent in IR spectra of azide-terminated SAMs collected after reactions (2) or (3), while in IR spectra of SAMs collected after reaction (1) the amide I and amide II peaks are prominent. The concurrent loss of the azide peak and emergence of the amide I and amide II peaks after reaction (1) indicates that peptide immobilization requires a surface azide group, an acetylene group, and Cu(I). Additionally, the absence of peptide on an azide-terminated SAM after reactions (2) or (3) further supports our earlier conclusion that azide-terminated oligo(ethylene glycol) SAMs are bio-inert. Taken together, this result demonstrates that CuAAC is an effective mechanism to chemoselectively conjugate peptides to otherwise bio-inert SAMs.
Figure 6.

PM-IRRAS spectra centered around the azide peak (λ=2110cm−1) (A) and amide I peak (λ=1675cm−1) (B) on 20% HS---EG6---N3, 80% HS---EG3 SAMs after Cu-catalyzed cycloaddition under different reaction conditions: 1mM CuBr, TBTA, and NaAsc Cu-catalyst plus 1mM Hex-RGDSP  , 1mM TBTA and NaAsc Cu-catalyst plus 1mM Hex-RGDSP
  , and 1mM CuBr, TBTA, and NaAsc Cu-catalyst plus 1mM RGDSP without Hex
  . Raw data was smoothed using a moving average with a period of 10.
Dependence of CuAAC reaction kinetics on Cu(I)-binding ligands
Previous work has demonstrated that the extent to which CuAAC proceeds in solution or on a solid support can be improved by including a tertiary amine ligand that binds to Cu(I), either by introduction into the reaction solution (e.g. TBTA)47 or by inclusion in the backbone of a peptide (e.g. benzyl-protected histidine)48. Here we characterized the extent of CuAAC between an azide-terminated SAM and Hex-RGDSP in the presence or absence of TBTA by correlating the area under the amide I peak of PM-IRRAS spectra collected at the end of a 90-minute reaction to the surface density of azide49 (Figure 7A). The results demonstrate that CuAAC between Hex-RGDSP and an azide-terminated oligo(ethylene glycol) alkanethiolate in the absence of TBTA proceeds efficiently at high azide surface density (mole fraction HS---EG6---N3 in ethanol ∼ 20%), but does not proceed to a significant extent at lower azide surface densities. However, the addition of TBTA into the reaction solution improves the efficiency of CuAAC at all surface densities studied, as demonstrated by the linear (R2 = .9972) increase in the area under the amide I peak as a function of the azide surface density (Figure 7B). This linear correlation indicates that in the presence of TBTA the reaction is proceeding to the same extent in all cases, independently of the azide surface density. Since there is no detectable azide content on the surface at the end of the reaction, it can be concluded that the extent of the CuAAC reaction between Hex-RGDSP and azide is nearly quantitative on SAMs comprised of 2−30 mol% HS---EG6---N3. This conclusion is in agreement with previous results from Chidsey and co-workers demonstrating a direct correlation between azide surface density after SAM formation and immobilized ferrocene surface density after CuAAC over a range of 0−55 mol% azide, where 55 mol% was calculated to be the steric limit of ferrocene coverage32. Taken together, our results demonstrate that CuAAC enables peptide conjugation to bio-inert, oligo(ethylene glycol) SAMs and allows for control over peptide density by varying the density of azide in the monolayer.
Figure 7.

Analysis of CuAAC reaction efficiency in the absence or presence of TBTA, a Cu(I)-stabilizing ligand. Correlation between the azide surface mole fraction49 and the area under amide I peak (λ=1675cm−1) of PM-IRRAS spectra collected after CuAAC in the absence of TBTA (A), or in the presence of 1 mM TBTA (B). The solid line indicates the expected trend if peptide surface density after conjugation correlates directy with azide surface mole fraction. C) Kinetic analysis of CuAAC between a 10mol% HS-N3, 90mol% HS-EG3 SAM and 1 mM Hex-RGDSP in the presence of 1 mM TBTA as determined by calculating the area under the azide peak (λ=2110cm−1) (gray squares) and amide I peak (λ=1675cm−1) (black triangles) of PM-IRRAS spectra collected after different reaction times. The reaction follows pseudo-first order kinetics with a rate constant of 0.2 min−1.
We next characterized the kinetics of CuAAC between a 10 mol% HS---EG6---N3 SAM and 1 mM Hex-RGDSP in the presence of 1 mM Cu(I) and 1 mM TBTA by integrating the area under the azide peak (λ = 2110 cm−1) and the amide I peak (λ = 1675 cm−1) as a function of time (Fig. 7C). The results demonstrate that the reaction proceeds rapidly and efficiently, reaching completion within approximately 30 minutes. The loss of azide signal over time can be fit to a first-order exponential, indicating that the surface reaction follows pseudo-first order kinetics, with a reaction rate of 0.2 min−1. Pseudo-first order kinetics are expected under the reaction conditions employed, as the concentration of Hex-RGDSP is in great excess compared to the surface density of HS---EG6---N3, and should thus remain relatively constant over the course of the reaction. Our observation of rapid, pseudo-first order kinetics of the CuAAC reaction under ligand-assisted catalysis is supported by previous work from Zhou et al., who demonstrated that a solution-phase CuAAC reaction follows pseudo-first order kinetics with a rate constant on the order of minutes when one reagent is in significant excess of the other50. For the case of a solid-phase reaction, our observation is further supported by previous work from Chidsey et al., who demonstrated that CuAAC between surface azide groups and an acetylene-bearing ferrocene follows pseudo-first order reaction kinetics with a rate constant on the order of seconds to minutes, depending on the initial concentration of acetylene in solution at the onset of the reaction32. Thus, similar to previous work characterizing solution- and solid-phase CuAAC, our results demonstrate that CuAAC allows for rapid and quantitative conjugation of an acetylene-bearing biomolecule to an otherwise bio-inert azide-terminated SAM substrate.
hMSC attachment to RGDSP-conjugated SAMs
After validating the chemoselectivity and efficiency of CuAAC between surface-presented azide groups and acetylene-bearing peptides, we next characterized the adhesion of hMSCs to SAMs presenting RGDSP, a fibronectin-derived cell adhesion ligand. It is important to note that an assumption must be made to estimate the peptide density presented to cells on the SAM substrates, particularly at the low peptide densities of relevance to cell adhesion. Due to the detection limits of PM-IRRAS (approximately 1 mole percent azide), azide density on SAMs formed in ethanolic solutions containing less than 1 mole percent HS---EG6---N3 could not be studied directly. Rather than extrapolate the trend observed at 1−5 mol percent HS---EG6---N3 (Fig. 3) to lower azide surface densities, we instead approximated the density of RGDSP molecules on the SAM surface to be equal to the mole fraction of HS---EG6---N3 in ethanol during SAM formation. Therefore, there may be minor differences between the reported peptide densities and the actual peptide density on these SAM substrates due to preferential HS---EG6---N3 adsorption during SAM formation.
Fluorescent staining of viable hMSCs after allowing cells to attach for 12 hours demonstrates that hMSCs attach to SAMs presenting 0.01−5 mole percent RGDSP (Fig. 8A). hMSC spreading on RGDSP-presenting SAMs is dependent on peptide surface density, and 0.5−5 mole percent RGDSP is sufficient to promote typical well-spread hMSC morphology51. hMSCs adhering to SAMs presenting ≤ 0.5 mole percent RGDSP do not resemble the fibroblastic morphology that is typically observed during hMSC culture on polystyrene. In particular, hMSC spreading is diminished on SAMs presenting 0.1 mole percent RGDSP, with hMSCS adopting a more polarized morphology. Furthermore, at lower surface densities of RGDSP, hMSC spreading can be completely abolished, as exemplified by the presence of rounded cells on SAMs presenting 0.01 mole percent RGDSP. Taken together, these results demonstrate that the surface density of a cell adhesion ligand, such as RGDSP, is a key determinant of hMSC morphology during cell culture.
Figure 8.

Human mesenchymal stem cell (hMSC) adhesion onto Hex-RGDSP-presenting SAMs. A) Fluorescent photomicrographs of hMSCs stained with Calcein AM 24 hrs after seeding(40× magnification, scalebar = 200 mm). B) Plot of attached hMSCs per square millimeter as a function of RGDSP surface density. * denotes significant difference compared to 0.0 (p<0.05), ** denotes significant difference compared to 5.00 (p < 0.05).
To characterize the adhesion of hMSCs on RGDSP-presenting SAMs, we quantified the number of hMSC per viewing area after overnight attachment to RGDSP-presenting SAMs (Fig. 8B). Results indicate that the number of hMSCs per viewing area is dependent on RGDSP surface density. Specifically, the number of hMSCs attached to SAMs presenting 5.0 mole percent RGDSP (46.2 ± 4.9 cells/mm2) is significantly greater than the number of hMSCs attached to SAMs presenting 0.01−1 mole percent RGDSP (1.0 ± 0.6 to 24.3 ± 5.9 cells/mm2). Additionally, the number of cells attached to SAMs presenting 0.01 mole percent RGDSP (1.0 ± 0.6) is greater than the number of cells on 100 mole percent HS---EG3 SAMS after overnight attachment (0 cells/mm2). The absence of cells on 100 mole percent HS---EG3 SAMs after 12 hours in the presence of 10% fetal bovine serum demonstrates that hMSC adhesion to SAMs is specifically mediated by the RGDSP ligand. Taken together, these results demonstrate that the surface density of RGDSP governs the adhesion of hMSCs onto RGDSP-presenting SAM substrates. The observed correlation between RGDSP surface density and number of adherent cells is consistent with our previous results, which demonstrated a direct relationship between RGDSP surface density and adhesion of C166 endothelial cells onto mixed DNA:HS---EG3:HS---EG6---COOH SAMs52. Our observed results are also consistent with previous work from Whitesides and co-workers, which demonstrates that the number of bovine capillary endothelial cells adherent to mixed SAMs comprised of an RGD-terminated oligo(ethylene glycol) alkanethiolate and a tri(ethylene glycol) alkanethiolate is dependent on the mole fraction of RGD-alkanethiolate present in ethanol during SAM formation19.
We can calculate the intermolecular spacing of RGDSP molecules on the SAM surface using the previously demonstrated thiol-thiol intermolecular distance of 4.97 Å in well-packed, all-trans SAMs53, and assuming homogeneous HS---EG6---N3 distribution in the SAM. Calculations using these assumptions provide intermolecular RGDSP spacings of 5.1 nm, 11.4 nm, and 36 nm on SAMs formed from ethanolic solutions containing 0.5, 0.1 or 0.01 mole percent HS---EG6---N3, respectively. Therefore, our results indicate that a 36 nm RGDSP spacing is sufficient for hMSC attachment and an11 nm RGDSP spacing is sufficent for hMSC spreading. Previous work from Hubbell and co-workers studying the adhesion of human foreskin fibroblasts on the surface of poly(ethylene glycol) (PEG) hydrogels presenting the cell-adhesion peptide RGDY determined that an RGDY intermolecular spacing of 12.88 μm or lower was sufficient for cell adhesion, and a spacing of 440 nm or lower was sufficient for cell spreading54. These result differ significantly from our results, however, differences between SAMs and hydrogel-based cell culture substrates may limit direct comparison of cell adhesion and spreading between the two systems. In a different set of experiments using a more closely related base material, Spatz and co-workers characterized the adhesion of osteoblasts, fibroblasts, and melanocytes on an array of gold nanodots and determined that an RGD intermolecular spacing of 85 nm or lower was sufficient for cell adhesion, and an intermolecular spacing of 58 nm or lower was sufficient for cell spreading55. Although these result are much closer to our results of 36 nm RGDSP spacing for cell attachment and 11 nm for cell spreading, the notable discrepancies may be related to different integrin receptor expression profiles of mesenchymal stem cells when compared to other cell types or the particular RGD molecule used in each study. Spatz and co-workers used a high-affinity cyclic RGD molecule, whereas the work described in this paper employed a lower-affinity linear RGD molecule. Mrksich and co-workers have previously shown that the rate of adhesion of Swiss 3T3 fibroblasts onto SAMs presenting a high-affinity, cyclic RGD molecule is approximately two-fold faster than cell adhesion onto SAMs presenting a lower-affinity, linear RGD molecule56. The minimum surface density of linear or cyclic RGD required to promote cell adhesion and spreading were not investigated in this previous study, however one can reasonably infer that the difference in affinity of the linear and cyclic RGD molecules may be a key factor governing the minimum surface density required to promote cell adhesion and spreading onto SAMs. Taken together, our results demonstrate that CuAAC between surface-presented azide groups and acetylene-bearing RGDSP can be used to precisely modulate hMSC adhesion and spreading onto SAMs presenting a fibronectin-derived cell-adhesion ligand, RGDSP.
Dependence of hMSC focal adhesion complex formation on RGDSP
Integrin-mediated cell adhesion to extracellular matrix (ECM) ligands involves a multi-step protein organization process known as focal adhesion complex formation, which is characterized by integrin receptor aggregation, binding of intracellular proteins (e.g. vinculin, talin, and filamin) to the aggregated integrin receptors, and cytoskeletal filament polymerization, organization, and anchorage to the integrin-bound protein cluster57. Therefore, the presence of focal adhesion proteins in punctate spots within the cell is indicative of a focal adhesion complex. In this study we characterized focal adhesion complexes within hMSCs adherent to RGDSP-presenting SAMs formed with 0.01−5 mole percent HS---EG6---N3 via immunocytochemical staining. Specifically, we stained hMSCs for phallodin, a bicyclic heptapeptide that preferentially binds to actin filaments, and vinculin, a focal adhesion complex protein (Fig. 9A). Fluorescent photomicrographs demonstrate that hMSCs on substrates that promote attachment but do not promote spreading (i.e. 0.01 mole percent HS---EG6---N3) do not stain positively for focal adhesion complexes and lack any distinguishable organization of F-actin filaments, as expected. However, hMSCs adhering to surfaces that do promote spreading (i.e. ≥0.05 mole percent HS---EG6---N3) stain positively for focal adhesion complexes and display organized F-actin cytoskeletal filaments. Comparison of the number of focal adhesion complexes per cell area on substrates with variable RGDSP density (Figure 9B) demonstrates significant differences, but no direct correlation, between RGDSP density and focal adhesion complex density. The focal adhesion complex density is significantly greater on SAMs with 5.0 mole percent HS---EG6---N3 than on SAMs with 0.1−1.0 mole percent HS---EG6---N3, similar to results presented for hMSC attachment and spreading (Fig. 8). Additionally, the minimum RGDSP intermolecular spacing required for focal adhesion complex formation is 11.4 nm, identical to the minimum intermolecular distance required to promote hMSC spreading. This observation is consistent with previous results from Spatz and co-workers, who identified a minimum cyclic RGD intermolecular distance of 58 nm for both cell spreading and focal adhesion complex formation55. The observed differences in intermolecular distance required for focal adhesion complex formation in our study relative to the study by Spatz and coworkers can be attributed to differences in integrin-RGD affinity, as Mrksich and co-workers have previously demonstrated that the number of focal adhesion complexes formed in Swiss 3T3 fibroblasts on 1% cyclic RGD SAMs is approximately two-fold greater than the number of focal adhesion complexes present in cells on 1% linear RGD SAMs56. Taken together, these results demonstrate that CuAAC between surface-presented azide groups and acetylene-bearing RGDSP can be used to precisely modulate hMSC focal adhesion complex formation during cell adhesion onto SAMs.
Figure 9.

Dependence of focal adhesion complex formation on Hex-RGDSP surface density. A) Fluorescent photomicrographs of the cytoskeletal protein F-actin (red) and a focal adhesion complex protein, vinculin (green) (200× magnification, scalebar = 50 mm). B) Number of focal adhesions per cell area as a function of RGDSP surface density. * denotes significant difference (p < 0.05) compared to 5.0.
Conclusion
Azide-terminated, bio-inert SAMs can be used as platforms to study hMSC adhesion, spreading, and focal adhesion complex formation. Mixed SAMs comprised of an azide-terminated oligo(ethylene glycol) alkanethiolate and a tri(ethylene glycol) alkanethiolate are resistant to non-specific protein adsorption, and are thus classified as bio-inert. Acetylene-bearing peptides react efficiently and nearly quantitatively with azide-terminated SAMs formed from ethanolic solutions containing 1−20 mole percent azide-terminated oligo(ethylene glycol) alkanethiolate in the presence of Cu(I) and a triazole-based Cu(I) ligand, TBTA. An RGDSP intermolecular spacing of 36 nm or less is sufficient for hMSC adhesion, and a spacing of 11 nm or less is sufficient for cell spreading and focal adhesion complex formation. Taken together, our results demonstrate that the CuAAC reaction is a promising mechanism to precisely control ligand density on SAMs for biochemical applications. In particular, our results demonstrate the utility of SAMs as substrates to characterize stem cell adhesion, and these substrates may be applicable to other questions of interest in stem cell biology, such as proliferation and differentiation.
Acknowledgements
The authors would like to acknowledge funding from the NIH (R21EB005374) and NSF (CAREER #0745563). PM-IRRAS data were obtained at the NSF-funded University of Wisconsin Materials Research Science and Engineering Center. SPR data were obtained at the University of Wisconsin Biophysics Instrumentation Facility, which was established with support from NSF (BIR-9512577) and NIH (S10 RR13790).
References
- 1.Chaki NK, Vijayamohanan K. Biosens. Bioelectron. 2002;17(1−2):1–12. doi: 10.1016/s0956-5663(01)00277-9. [DOI] [PubMed] [Google Scholar]
- 2.Liu L, Chen S, Giachelli CM, Ratner BD, Jiang S. J. Biomed. Mater. Res. A. 2005;74(1):23–31. doi: 10.1002/jbm.a.30221. [DOI] [PubMed] [Google Scholar]
- 3.Liu L, Ratner BD, Sage EH, Jiang S. Langmuir. 2007;23(22):11168–73. doi: 10.1021/la701435x. [DOI] [PubMed] [Google Scholar]
- 4.Mrksich M, Whitesides GM. Ann. Rev. Biophys. Biomol. Struct. 1996;25:55–78. doi: 10.1146/annurev.bb.25.060196.000415. [DOI] [PubMed] [Google Scholar]
- 5.Houseman BT, Huh JH, Kron SJ, Mrksich M. Nat. Biotechnol. 2002;20(3):270–4. doi: 10.1038/nbt0302-270. [DOI] [PubMed] [Google Scholar]
- 6.Houseman BT, Mrksich M. Chem. Biol. 2002;9(4):443–54. doi: 10.1016/s1074-5521(02)00124-2. [DOI] [PubMed] [Google Scholar]
- 7.Banga R, Yarwood J, Morgan AM, Evans B, Kells J. Langmuir. 1995;11(11):4393–4399. [Google Scholar]
- 8.Wasserman SR, Tao YT, Whitesides GM. Langmuir. 1989;5(4):1074–1087. [Google Scholar]
- 9.Pale-Grosdemange C, Simon ES, Prime KL, Whitesides GM. J. Am. Chem. Soc. 1991;113(1):12–20. [Google Scholar]
- 10.Lasseter TL, Clare BH, Abbott NL, Hamers RJ. J. Am. Chem. Soc. 2004;126(33):10220–10221. doi: 10.1021/ja047642x. [DOI] [PubMed] [Google Scholar]
- 11.Sun B, Colavita PE, Kim H, Lockett M, Marcus MS, Smith LM, Hamers RJ. Langmuir. 2006;22(23):9598–9605. doi: 10.1021/la061749b. [DOI] [PubMed] [Google Scholar]
- 12.Bain CD, Troughton EB, Tao YT, Evall J, Whitesides GM, Nuzzo RG. J. Am. Chem. Soc. 1989;111(1):321–335. [Google Scholar]
- 13.Flynn NT, Tran TNT, Cima MJ, Langer R. Langmuir. 2003;19(26):10909–10915. [Google Scholar]
- 14.Harder P, Grunze M, Dahint R, Whitesides GM, Laibinis PE. J. Phys. Chem. B. 1998;102(2):426–436. [Google Scholar]
- 15.Nelson KE, Gamble L, Jung LS, Boeckl MS, Naeemi E, Golledge SL, Sasaki T, Castner DG, Campbell CT, Stayton PS. Langmuir. 2001;17(9):2807–2816. [Google Scholar]
- 16.Mrksich M, Sigal GB, Whitesides GM. Langmuir. 1995;11(11):4383–4385. [Google Scholar]
- 17.Porter MD, Bright TB, Allara DL, Chidsey CED. J. Am. Chem. Soc. 1987;109(12):3559–3568. [Google Scholar]
- 18.Diao P, Jiang D, Cui X, Gu D, Tong R, Zhong B. J. Electroanal. Chem. 1999;464(1):61–67. [Google Scholar]
- 19.Roberts C, Chen CS, Mrksich M, Martichonok V, Ingber DE, Whitesides GM. J. Am. Chem. Soc. 1998;120(26):6548–6555. [Google Scholar]
- 20.Lahiri J, Isaacs L, Grzybowski B, Carbeck JD, Whitesides GM. Langmuir. 1999;15(21):7186–7198. [Google Scholar]
- 21.Mrksich M, Whitesides GM. Poly(ethylene glycol) Chemistry and Biological Applications. Vol. 680. Am. Chem. Soc.; Washington, DC: 1997. pp. 361–373. [Google Scholar]
- 22.Lahiri J, Isaacs L, Tien J, Whitesides GM. Anal. Chem. 1999;71(4):777–790. doi: 10.1021/ac980959t. [DOI] [PubMed] [Google Scholar]
- 23.Houseman BT, Gawalt ES, Mrksich M. Langmuir. 2003;19(5):1522–1531. [Google Scholar]
- 24.Peelen D, Smith LM. Langmuir. 2005;21(1):266–271. doi: 10.1021/la048166r. [DOI] [PubMed] [Google Scholar]
- 25.Smyth DG, Blumenfeld OO, Konigsberg W. Biochem. J. 1964;91:589. doi: 10.1042/bj0910589. [DOI] [PMC free article] [PubMed] [Google Scholar]
- 26.Cuatrecaseas P, Parikh I. Biochemistry. 1972;11:2291–2299. doi: 10.1021/bi00762a013. [DOI] [PubMed] [Google Scholar]
- 27.Gregory JD. J. Am. Chem. Soc. 1955;77(14):3922–3923. [Google Scholar]
- 28.Brewer CF, Riehm JP. Anal. Biochem. 1967;18:248. [Google Scholar]
- 29.Kolb HC, Finn MG, Sharpless KB. Angew. Chem. Int. Ed. 2001;40(11):2004–2021. doi: 10.1002/1521-3773(20010601)40:11<2004::AID-ANIE2004>3.0.CO;2-5. [DOI] [PubMed] [Google Scholar]
- 30.Rostovtsev VV, Green LG, Fokin VV, Sharpless KB. Angew. Chem. Int. Ed. 2002;41(14):2596–2599. doi: 10.1002/1521-3773(20020715)41:14<2596::AID-ANIE2596>3.0.CO;2-4. [DOI] [PubMed] [Google Scholar]
- 31.Devaraj NK, Miller GP, Ebina W, Kakaradov B, Collman JP, Kool ET, Chidsey CED. J. Am. Chem. Soc. 2005;127(24):8600–8601. doi: 10.1021/ja051462l. [DOI] [PMC free article] [PubMed] [Google Scholar]
- 32.Collman JP, Devaraj NK, Eberspacher TPA, Chidsey CED. Langmuir. 2006;22(6):2457–2464. doi: 10.1021/la052947q. [DOI] [PMC free article] [PubMed] [Google Scholar]
- 33.Lummerstorfer T, Hoffmann H. J. Phys. Chem. B. 2004;108(13):3963–3966. [Google Scholar]
- 34.Lee JK, Chi YS, Choi IS. Langmuir. 2004;20(10):3844–3847. doi: 10.1021/la049748b. [DOI] [PubMed] [Google Scholar]
- 35.Salasznyk RM, Williams WA, Boskey A, Batorsky A, Plopper GE. J. Biomed. Biotechnol. 2004;2004(1):24–34. doi: 10.1155/S1110724304306017. [DOI] [PMC free article] [PubMed] [Google Scholar]
- 36.Goessler UR, Bugert P, Bieback K, Stern-Straeter J, Bran G, Hormann K, Riedel F. Int. J. Mol. Med. 2008;21(3):271–9. [PubMed] [Google Scholar]
- 37.Kundu AK, Khatiwala CB, Putnam AJ. Tissue Eng. Part A. 2008 doi: 10.1089/ten.tea.2008.0055. [DOI] [PMC free article] [PubMed] [Google Scholar]
- 38.Frey BL, Corn RM, Weibel SC. Handbook of Vibrational Spectroscopy. Wiley & Sons; New York: 2002. p. 1042. [Google Scholar]
- 39.Fagerstam LG, Frostell-Karlsson A, Karlsson R, Persson B, Ronnberg I. J. Chromatography. 1992;597(1−2):397–410. doi: 10.1016/0021-9673(92)80137-j. [DOI] [PubMed] [Google Scholar]
- 40.In a typical experiment, the reaction of peptide with azide-terminated SAMs was allowed to proceed for 90-minutes. In the case of kinetic analysis experiments, the reaction was terminated at the specified timepoints.
- 41.Sotiropoulou PA, Perez SA, Salagianni M, Baxevanis CN, Papamichail M. Stem Cells. 2006;24(2):462–471. doi: 10.1634/stemcells.2004-0331. [DOI] [PubMed] [Google Scholar]
- 42.Willey TM, Vance AL, van Buuren T, Bostedt C, Terminello LJ, Fadley CS. Surf. Sci. 2005;576(1−3):188–196. [Google Scholar]
- 43.Moore PL, MacCoubry IC, Haugland RP. J. Cell Biol. 1990;111:58a. [Google Scholar]
- 44.Laibinis PE, Whitesides GM, Allara DL, Tao YT, Parikh AN, Nuzzo RG. J. Am. Chem. Soc. 1991;113(19):7152–7167. [Google Scholar]
- 45.Chapman RG, Ostuni E, Takayama S, Holmlin RE, Yan L, Whitesides GM. J. Am. Chem. Soc. 2000;122(34):8303–8304. [Google Scholar]
- 46.Frey BL, Corn RM. Anal. Chem. 1996;68(18):3187–3193. [Google Scholar]
- 47.Chan TR, Hilgraf R, Sharpless KB, Fokin VV. Org. Lett. 2004;6(17):2853–2855. doi: 10.1021/ol0493094. [DOI] [PubMed] [Google Scholar]
- 48.Tanaka K, Kageyama C, Fukase K. Tetrahedron Lett. 2007;48(37):6475–6479. [Google Scholar]
- 49.The function correlating solution azide mole fraction to surface azide mole fraction in the resulting SAM (Figure 3) was used to estimate the azide surface density in each SAM based on the known solution azide mole fraction present during SAM formation.
- 50.Zhou Z, Fahrni CJ. J. Am. Chem. Soc. 2004;126(29):8862–8863. doi: 10.1021/ja049684r. [DOI] [PubMed] [Google Scholar]
- 51.Deans RJ, Moseley AB. Exp. Hematology. 2000;28(8):875–884. doi: 10.1016/s0301-472x(00)00482-3. [DOI] [PubMed] [Google Scholar]
- 52.Choi S, Murphy WL. Langmuir. 2008;24(13):6873–6880. doi: 10.1021/la800553p. [DOI] [PubMed] [Google Scholar]
- 53.Strong L, Whitesides GM. Langmuir. 1988;4(3):546–558. [Google Scholar]
- 54.Massia SP, Hubbell JA. J. Cell. Biol. 1991;114(5):1089–100. doi: 10.1083/jcb.114.5.1089. [DOI] [PMC free article] [PubMed] [Google Scholar]
- 55.Arnold M, Cavalcanti-Adam EA, Glass R, Blummel J, Eck W, Kantlehner M, Kessler H, Spatz JP. Chemphyschem. 2004;5(3):383–8. doi: 10.1002/cphc.200301014. [DOI] [PubMed] [Google Scholar]
- 56.Kato M, Mrksich M. Biochemistry. 2004;43(10):2699–707. doi: 10.1021/bi0352670. [DOI] [PubMed] [Google Scholar]
- 57.Zamir E, Geiger B. J. Cell. Sci. 2001;114(Pt 20):3583–90. doi: 10.1242/jcs.114.20.3583. [DOI] [PubMed] [Google Scholar]