

Abstract
Participants were pretrained and tested on mutually entailed trigonometric relations and combinatorially entailed relations as they pertained to positive and negative forms of sine, cosine, secant, and cosecant. Experiment 1 focused on training and testing transformations of these mathematical functions in terms of amplitude and frequency followed by tests of novel relations. Experiment 2 addressed training in accordance with frames of coordination (same as) and frames of opposition (reciprocal of) followed by more tests of novel relations. All assessments of derived and novel formula-to-graph relations, including reciprocal functions with diversified amplitude and frequency transformations, indicated that all 4 participants demonstrated substantial improvement in their ability to identify increasingly complex trigonometric formula-to-graph relations pertaining to same as and reciprocal of to establish mathematically complex repertoires.
Keywords: combinatorial entailment, construction-based training, mathematical relations, mutual entailment, matching to sample, trigonometry, relational frame theory
International indicators of mathematical performance suggest that the mathematical skills of high-school and entry-level college students in the U.S. are causes for concern. U.S. high-school students have consistently ranked lower on math literacy than many industrialized and nonindustrialized countries (24 of 29 countries) in the Organization for Economic Cooperation and Development (OECD). The Programme for International Student Assessment (PISA), a worldwide appraisal of high-school student performance, makes it obvious that the performance levels of U.S. high-school students can only be described as discouraging, with nearly every developed nation surpassing U.S. 10th-grade students in all quantitative skill areas. The most troubling areas in the 2003 evaluation were math literacy and problem solving, with U.S. students proving to be incapable of responding to items that require fundamental algebra and the most rudimentary levels of basic computations (PISA, 2003). These mathematical difficulties were also reflected in the most recent PISA outcomes on science literacy, which indicate that “when older U.S. students are asked to apply what they have learned in mathematics, they demonstrate less ability than most of their peers in other highly industrialized countries” (PISA, 2006, as cited in U.S. Department of Education, 2006, p. 24).
Insufficient exposure to mathematics instruction may account for some of these findings. In the highest achieving Asian and European countries, eighth-grade mathematics curricula include the basics of three-dimensional geometry, proportionality problems, and transformation of geometric functions (see Schmidt, Houang, & Cogan, 2002, for a detailed discussion). Japanese high-school students acquire more advanced math skills (e.g., quadratic functions, permutations and combinations, trigonometric functions, limits, derivatives, and the applications of integrals) than almost all U.S. students encounter in their required college course work (Conway & Sloane, 2005). Despite recent legislative attempts such as No Child Left Behind (2001), student performance has failed to show significant improvement.
Notwithstanding, innovative behavioral research conducted by Mayfield and Chase (2002) confirmed the beneficial effects of cumulative practice on the acquisition of math skills among low-performing college students. Also, Lynch and Cuvo (1995) illustrated that teaching fifth and sixth graders to match fraction ratios to their corresponding graphical representations and graphs to the corresponding decimal values resulted in the emergence of nontrained skills to match decimal to fraction and fraction to decimal without direct training. The emergence of untrained relations, termed stimulus equivalence (Sidman, 1994) or relational framing when the stimuli are not directly equivalent (e.g., more than, less than; Hayes, Barnes-Holmes, & Roche, 2001), represents a possible advantage for teachers with limited time for math instruction.
Relational frame theory (RFT) extends the equivalence paradigm by suggesting that verbally competent participants can learn to respond in accordance with sameness and other more complex relations among stimuli (Hayes et al., 2001). As in equivalence terminology, a frame of coordination refers to stimuli being the same as or equivalent to other stimuli; a frame of comparison involves relating stimuli along some dimension of quantity or quality (e.g., larger than, higher than). A frame of opposition refers to stimuli that can be contrasted along some dimension in which objects or events have some order (e.g., opposite of, inverse of, reciprocal of).
Ninness and colleagues have developed several computer-interactive protocols directed at establishing advanced math skills via derived stimulus relations. The protocols have employed matching-to-sample (MTS) strategies to teach formula-to-graph relations for mathematical transformations about the coordinate axes (Ninness, Rumph, McCuller, Vasquez, et al., 2005) and to teach formula-to-factored-formula and factored-formula-to-graph relations for vertical and horizontal shifts on the coordinate axes (Ninness, Rumph, McCuller, Harrison, et al., 2005). Participants were able to demonstrate derived relations by identifying standard formulas and their graphical representations and vice versa, even though the experimental preparations specifically precluded any direct training of these relations.
More recently, Ninness et al. (2006) employed similar computer-interactive protocols in the analysis of transformation of stimulus functions and found that participant preferences for either standard (the more difficult) or factored formulas alternated with the prevailing rules and independent of prevailing contingencies. As discussed by Ninness et al. (2006, pp. 315–316), derived stimulus relations appears to be well suited to facilitate the efficient acquisition of a wide array of complex mathematical relations and mathematical reasoning (e.g., Ensley & Crawley, 2005; Ensley & Kaskosz, 2008), especially as it applies to learning abstract concepts employed in algebra, trigonometry, precalculus, and calculus (e.g., Sullivan, 2002). Within mathematics, trigonometric relations address the sides and the angles of triangles and produce repeating values on the coordinate axes over a specific period identified by their formulas. Learning how the basic trigonometric relations operate on the coordinate axes is prerequisite to the acquisition of progressively more elaborate mathematical transformations employed in calculus and higher level mathematics (Sullivan, 2002).
The current study extends and differs from the previous studies by Ninness et al. (2005, 2006) in that more complex math concepts entailing same as relations and opposite of relations were trained. Specifically, during Experiment 1, we trained eight two-member trigonometric classes that address transformation of amplitude and frequency functions. The instruction was unique in that online construction-based responding was required in addition to traditional MTS selection procedures. In Experiment 2, we used offline MTS procedures to develop two four-member relational networks that are especially relevant to basic trigonometry because these functions are absent from menus of graphing calculators (i.e., students must learn these basic reciprocal identifiers to become fluent in all trigonometric relations).
EXPERIMENT 1
Method
Participants and Setting
After informed consent had been obtained, a pretest was administered to determine participants' skill levels with regard to identification of various types of trigonometric relations. Individuals who were able to identify more than four of 15 pretest formula-to-graph items were excused from the experiment. Four students, all women who ranged in age from 23 to 28 years, participated in pretraining and the two experiments. Although 1 participant had an academic history that included a precalculus class during high school, she correctly identified only three of 15 items on the pretest. Thus, she was permitted to participate. Interestingly, at the start of the experiment, this participant was unable to pronounce the names of several of the trigonometric functions used in the study. The other participants had no recollection of exposure to the subject matter of this study.
Participants were recruited from various academic disciplines by way of agreements with professors to provide extra credit for taking part in university research projects. Participants received five points on their final examinations for their involvement in the study. Also, each participant could earn $0.10 per correct response during the assessment of novel relations (maximum $6.00, which included a minimum of $2.00 for participation). After completing the study, all participants were debriefed and reimbursed according to the number of correct responses emitted during the assessment of novel trigonometric relations.
Apparatus and Software
Training, MTS procedures, and the recording of responses were controlled by the computer programs, which were written by the first author in Visual Basic and Flash ActionScript 2.0. Error patterns were identified with software written in the C++ programming language. These software systems provided interactive math instructions, displayed formulas and graphs, and recorded the accuracy of responses during both experiments. The accuracy of the computer's data compilation was confirmed prior to initiating MTS segments. Before each participant began, the computer program's data collection was compared against hand tallies of correct and incorrect responses. These were found to match precisely.
Design and Procedure
Following a brief presentation on the details of the Cartesian coordinate axes and concise definition of reciprocal relations, participants were pretrained regarding positive and negative forms of sine, cosine, secant, and cosecant functions. Then, during baseline, participants were tested on a series of novel formula-to-graph relations. This was followed by online training and testing with regard to how graphs transform in amplitude and frequency in accordance with particular types of formula-to-graph and graph-to-formula relations. We then provided another assessment of novel relations regarding these functions. Figure 1 illustrates the sequence of training and testing for Experiments 1 and 2. Note that Experiment 1 was conducted in an attempt to lay the foundation skills needed for Experiment 2.
Figure 1.

The sequence of training and testing procedures in Experiments 1 and 2.
Stage 1: Pretraining
During Step 1, participants were given a 4-min preliminary training presentation in which they were exposed to an overview of the fundamentals of the rectangular coordinate system. In Step 2, a succinct definition of reciprocal relations was provided, and in Step 3, participants were pretrained regarding positive and negative forms of sine, cosine, secant, and cosecant functions. All the pretraining procedures in Step 3 were adapted from training strategies employed by Ninness, Rumph, McCuller, Harrison, et al. (2005) and Ninness et al. (2006). During this stage, participants were pretrained and tested on A-B and B-C trigonometric relations, mutually entailed (B-A and C-B) relations, and combinatorially entailed (A-C and C-A) relations as they pertain to how the positive and negative forms of sine, cosine, secant, and cosecant transform on the coordinate axis.
Baseline
During our nonconcurrent multiple baseline, Participants 1 and 2 attempted to identify five novel MTS relations, and Participants 3 and 4 attempted to identify 10 novel MTS relations (i.e., five additional items and the same five items as Participants 1 and 2 on Items 6 through 10). All remaining items in Experiment 1 were the same for all participants. The assessment of novel relations addressed amplitude and frequency transformations. During each assessment item, participants attempted to match a novel sample formula with a comparison graph from an array of six graphs that had not been used during any previous training or testing condition (see Figure 2).
Figure 2.
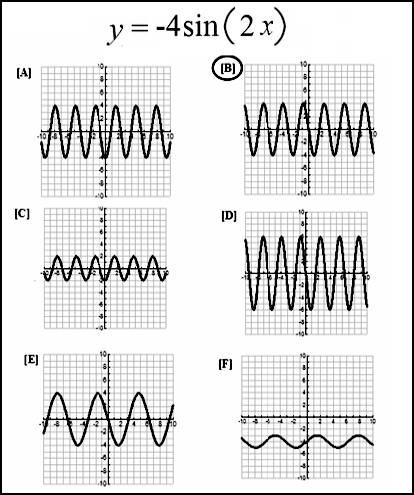
Sample function of a negative sine function transformed in amplitude and frequency.
Stage 2: Online training and testing of amplitude and frequency transformations by way of construction-based responding
Construction of graphs of trigonometric formulas requires the participant to respond in accordance with the details of each function. During this stage, participants were trained and assessed on graphical transformations of trigonometric functions built on the skills acquired during pretraining of positive and negative forms of the sine, cosine, secant, and cosecant functions. Throughout this stage, we trained and sequentially assessed eight two-member trigonometric classes that addressed transformation of amplitude and frequency. At the beginning of this stage, the experimenter provided training with online software (http://www.faculty.sfasu.edu/ninnessherbe/graphCalcCN07.html). Table 1 illustrates these trained and derived relations.
Table 1.
Training and Testing of Amplitude and Frequency
Our procedure included aspects of modeling, direct instruction, clear antecedent instructions, multiple-exemplar training, feedback, and rules for responding (Berens & Hayes, 2007). To depict a given function prior to its transformation, we first provided the basic (nontransformed) graph of each trig function on the coordinate axes. For example, in training the amplitude transformation of y = cos(x), the screen displayed a solid line representing the cosine function on the coordinate axes as it would appear prior to transformation by a change in frequency or amplitude. Participants were trained to construct a transformation of this function by adjusting the graphing anchors of the green line to draw (construct) a change in amplitude in accordance with the details of the sample formula. At the completion of each graph constructed by a participant, the experimenter produced a computer-generated graph of the same function by typing the formula into a text box, and the precise function then was displayed on-screen in conjunction with the participant's constructed graph. Accuracy of the participant's graph was determined by visually comparing it to the computer-generated graph of the same function. The experimenter and a trained observer examined each graph and formula construction. If both the experimenter and observer agreed the participant's graph was a reasonable approximation of the computer-generated graph, the participant advanced to the next assessment of graph-to-formula relations. Similarly, accuracy of the participant's formula construction was determined by comparing the participant's formula to the experimenter's formula.
During Step 1, the experimenter explained that multiplying the cosine function by a number greater than 1 stretches each point vertically, to three times its original distance along the y axis. The easiest points to observe were the high and low points. The high points stretch from 1 to 3, and the low points stretch from −1 to −3. Using the text box in the lower left field of the graphing screen, the experimenter changed the formula from y = cos(x) to y = 3*cos(x), where the asterisk was used as a multiplication operator. After the graph button above the formula was clicked, the amplitude of the graph stretched to −3 and +3 along the y axis. Next, the experimenter used the graphing anchors to construct a superimposed graph of this function directly over the existing graph. The experimenter then asked the participant to perform the same exercise using her mouse to manipulate the graphing anchors. Using numbers greater than 1 as multipliers, this process was repeated until the participant was able to arrange the graph successfully and independently. (Note that construction of a graph with this software simply requires mouse dragging each of the five red graphing anchors from the top of the screen to locations on the coordinate axis such that the desired shape of the graph is fashioned. The software system also allows users to identify where a constructed point on the graph falls on the coordinate axis by observing a floating text box that moves in conjunction with the mouse arrow or cursor; see top left side of Figure 3.)
Figure 3.

Sample online construction-based responding.
To test an A-B vertical stretch (amplitude increase) of the cosine function, the experimenter typed a formula within a text box [e.g., y = 3*cos(x)] and stated, “Using the red graphing anchors, construct the graph of this formula.” At this step in testing, the graph of the basic cosine function, y = cos(x), was displayed on-screen. To respond, the participant moved the graphing anchors to the screen locations necessary to construct a transformation of the graph in accordance with the newly displayed formula [i.e., y = 3*cos(x)]. Then, to assess B-A mutually entailed relations, the experimenter typed the same or a similar formula (multipliers always ranging between 2 and 5) into the lower right text box. This text box (outlined in red), was labeled “input values are hidden,” and did not permit a screen display of the formula typed into the text box. When the experimenter clicked the graph button, a graph of this hidden formula was displayed on-screen. Thus, the participant was unable to see the specific formula responsible for producing the graph when the experimenter stated, “Please type the formula needed to produce this graph in the far left text box.”
After typing the formula into the text box, the participant clicked the graph button to verify that her response matched the existing on-screen graph. In the event that a participant erred during the assessment of either A-B or B-A relations, the A-B training protocol for cosine was repeated immediately, and another assessment of A-B or B-A relations was conducted. A correct response to this test is illustrated on the top left side of Figure 3. If the participant had emitted more than three consecutive errors, she would have been reimbursed for her time, debriefed, and excused; however, all participants easily attained these criteria (see Table 2).
Table 2.
Number of Exposures Required to Attain Mastery on Construction of Cosine and Secant Amplitude and Frequency Functions
During Step 2, the experimenter informed the participant that multiplying the cosine function by a number less than 1 causes its graph to compress along the y axis, consistent with the value of the multiplier. The experimenter provided the following rule, “Multiplying the cosine function by a number less than 1 (e.g., 0.5) compresses each point vertically to half its original distance along the y axis. Again, the easiest points to watch are the high and low points. You will see that the high points will compress from 1 to 0.5, and the low points will compress from −1 to −0.5.” To demonstrate the operation of this rule, the experimenter changed the cosine formula by multiplying it by 0.5 in the text box in the lower left text field of the screen [y = 0.5*cos(x)].
To test an A-B relation, the experimenter typed the above formula into the text box [i.e., y = 0.5*cos(x)] and stated, “Using the red graphing anchors, construct the graph of this formula.” In response, the participant moved the graphing anchors to the screen locations necessary to construct a transformation of the graph in accordance with the newly displayed formula [i.e., y = 0.5*cos(x)]. A correct response to this test is illustrated on the top right side of Figure 3.
To assess B-A mutually entailed relations, the experimenter typed this formula into the lower right text box. As in the assessment of vertical cosine stretches described above, the participant was unable to see the formula responsible for generating the particular on-screen graph. Pointing to the text box with his mouse arrow, the experimenter asked the participant to type the formula needed to generate the graph displayed on-screen.
To test A-B and B-A relations, the multiplier was set at 0.5. If an error was emitted by a participant during the assessment of A-B and B-A relations, she was immediately reexposed to the A-B training of cosine vertical compression and an additional test of A-B or B-A relations. Reexposure was limited to training only A-B (formula-to-graph) relations in terms of the vertical cosine compression function. At no time were participants given any training addressing B-A (graph-to-formula) relations. This type of correction procedure was employed throughout assessments conducted during Experiment 1.
During Step 3, the experimenter informed participants that multiplying the argument (the variable inside the parentheses) of the cosine function by a number greater than 1 causes its graph to compress along the x axis consistent with that number. For example, if the argument of a cosine function were multiplied by 2, the graph compressed such that it became twice as frequent but half as wide within one period of the function (a period for all functions in this study consisted of 2π). In this Step, the experimenter changed the formula of the graph by multiplying it by 2 in the lower left text field of the screen where y = cos(2*x). Clicking the graph button resulted in the frequency of the graph being compressed, and the graph became twice as frequent but half as wide along the x axis.
In the assessment of A-B relations that followed, the experimenter typed the formula, y = cos(2*x), into the text box, pointed to the formula with his mouse arrow, and asked the participant to construct a graph of the formula. In response, the participant moved the graphing anchors to the screen locations necessary to construct a transformation of the graph in accordance with the newly displayed formula. The bottom left panel of Figure 3 shows an accurate construction-based response to the test of A-B relations.
To assess B-A mutually entailed relations, the experimenter typed a formula into the lower right text box. As in previous assessments, the participant was unable to see the formula responsible for generating a horizontally compressed graph on-screen. Pointing to a far left text box with his mouse arrow, the experimenter asked the participant to type the formula needed to generate the graph displayed on-screen. After typing a formula into the text box, the participant was requested to click the graph button and reveal whether her typed formula produced the correct graph. In the event that a participant erred during the assessment of either A-B or B-A relations, she was reexposed to the A-B relations training and another assessment of A-B or B-A relations.
During Step 4, the experimenter informed participants that multiplying the argument of a cosine function by a number less than 1 causes the graph to stretch horizontally along the x axis. For example, if the argument of the cosine function is multiplied by 0.5 [i.e., y = cos(0.5*x)], its graph on the coordinate appears half as frequent but twice as wide relative to the basic cosine function, y = cos(x). The experimenter changed the formula of the graph by multiplying the argument by 0.5 in the text box in the lower left text field of the screen, where y = cos(0.5*x). When the graph button above the formula was clicked, the frequency of the graph stretched horizontally, and the graph became half as frequent but twice as wide along the y axis. In the assessment of A-B relations that followed, the experimenter typed the formula, y = cos(0.5*x) into the text box, pointed to the formula with his mouse arrow, and asked the participant to construct a graph of the formula using the red anchors. To respond, the participant adjusted the graphing anchors to the screen locations required to construct a transformation of the graph in accordance with the newly displayed formula. The bottom right side of Figure 3 illustrates a correct response to this item.
To assess B-A mutually entailed relations, the experimenter typed a formula [e.g., y = cos(0.5*x)] into the lower right text box and clicked the graph button. Pointing to the far left text box with his mouse arrow, the experimenter asked the participant to type the formula needed to produce the graph displayed on-screen. In the event that a participant erred during the assessment of either A-B or B-A relations, she was reexposed to A-B relations training, and another assessment of A-B or B-A relations was immediately conducted.
Participants were exposed to the same training as described above for transformations addressing the secant function. They were not trained regarding the transformation of sine and cosecant functions; instead they were simply informed that with regard to amplitude and frequency, the sine and cosecant functions transform in the same manner as cosine and secant. Because secant transformations were trained with the same rules as the cosine transformations, the specific training graphs that addressed secant are not shown.
Interobserver agreement
Each graph and formula construction were assessed by an observer and then by the experimenter. In total, there were only six of 94 occasions (i.e., 93.6% agreement) during which the observer and experimenter disagreed with respect to the adequacy of a participant's graph or formula construction.
Assessment of novel relations before and after training
During baseline assessments, Participants 1 and 2 were tested on five novel formula-to-graph relations, and Participants 3 and 4 were assessed on 10 novel formula-to-graph relations. After completing online training and testing of amplitude and frequency transformations, each participant was assessed with 10 novel formula-to-graph relations of the same type as those employed during the baseline assessment of novel relations. These items were novel in the sense that they involved positive and negative forms of sine, cosine, secant, and cosecant as they transformed in amplitude and frequency when multiplying the function, the argument of the function, or both, by a number greater or less than 1 (see Figure 2).
Results
All exposures to training A-B (formula-to-graph) relations, including the initial exposure plus any reexposures required to demonstrate a correct construction-based response, are provided in Table 2. All 4 participants failed to construct the graph of y = 3*cos(x) on their first attempts and were reexposed to graph construction training for the amplitude transformation (A1-B1) at least once (see Column 2 of Table 2). Following reexposure to training, each successfully constructed the graph given a formula as a sample stimulus, and correctly typed the formula given a graph of y = 3*cos(x) as a sample stimulus. All participants mastered subsequent functions with similar or fewer exposures to training (follow each participant across all columns). If errors occurred during the assessment of A-B and B-A relations, participants immediately returned to the A-B training (formula to graph), and an additional test of A-B and B-A (untrained) relations.
Figure 4 shows the multiple baseline design across paired participants. Participant 1 failed to identify any of the baseline novel relations items but identified eight of 10 novel formula-to-graph assessment items after training. Participant 2 correctly responded to one of five novel assessment items during baseline and responded correctly to all 10 items after training. Participant 3 failed nine of the 10 baseline items and only one of the 10 items after training. Similarly, Participant 4 identified only two of 10 baseline items but was able to identify all 10 novel formula-to-graph assessments following training.
Figure 4.

Correct and incorrect responses displayed in a multiple baseline design across paired participants. The bold double line demarcates the locations at which treatment was implemented and terminated. Errors pertaining to tests of novel relations are identified as shaded blocks containing ones, and correct responses are depicted as zeros.
EXPERIMENT 2
Pretraining and Experiment 1 were conducted in an attempt to lay the critical foundation for Experiment 2. Indeed, pilot research in our laboratory has indicated that learning the mathematical relations in Experiment 2 depends on the skills addressed in the first part of this study.
Method
Participants and Setting
Experiment 2 was an extension of Experiment 1, the same participants served in the same setting, and this experiment was conducted within the same approximate 2- to 2.5-hr time period.
Design and Procedure
Immediately following Experiment 1, all 4 participants were exposed to MTS protocols that afforded training in accordance with frames of coordination (same as) and frames of opposition (reciprocal of) as they entail trigonometric operations. Targeting two four-member relational networks, participants were trained and tested on A-B, B-C, and C-D relations and assessed on mutually entailed (D-C, C-B, and B-A) and combinatorially entailed (B-D, D-B, A-D, D-A, A-C, and C-A) relations. This was followed by a posttreatment assessment of novel formula-to-graph relations, including complex reciprocal functions and diversified amplitude and frequency transformations. In this nonconcurrent multiple baseline design across paired participants, Participants 1 and 2 were assessed on 15 novel formula-to-graph relations (following training), and Participants 3 and 4 were assessed on 10 novel formula-to-graph relations. (Items 26 through 35 presented to Participants 1 and 2 were the same as Items 31 through 40 presented to Participants 3 and 4.)
Baseline
At the beginning of Experiment 2, participants returned to their previous computer screens and keyboards facing away from the experimenter, such that they were not in direct visual contact with the experimenter throughout the remainder of the experiment. Baseline tests of novel formula-to-graph relations involved identification of graphical transformations pertaining to positive and negative forms of sine, cosine, secant, and cosecant functions in conjunction with transformation pertaining to changes in amplitude and frequency. Moreover, the first 10 MTS items for all participants addressed formula-to-graph relations in the form of reciprocals. Participants had not been exposed to any form of training that would have prepared them to respond to these items (e.g., Figure 5).
Figure 5.

An example of a test of novel formula-to-graph relations that required identification of transformations including negative coefficients and changes in amplitude and frequency.
Stage 1: Training and testing of cosine and secant reciprocals
We trained three fundamental relations (A reciprocal of B, B same as C, and C same as D) to see if participants could derive their mutually entailed relations (D same as C, C same as B, B reciprocal of A), as well as their combinatorially entailed relations (B same as D, D same as B, A reciprocal of D, D reciprocal of A, A reciprocal of C, and C reciprocal of A) as four-member relational networks (see the top of Figure 6 as an illustration of trained and derived relations). Thus, we attempted to have participants acquire two four-member relational networks pertaining to cosine reciprocal of secant and sine reciprocal of cosecant.
Figure 6.

The top panel is a four-member relational network, with solid lines representing trained relations and dashed lines indicating derived relations (e.g., same as, reciprocal of). The bottom left panel shows assessment of B1-A1 relations in the context of reciprocal of. The bottom right panel shows an assessment of B1-D1 relations in the context of same as.
Having been exposed to the basic formula-to-graph relations addressing the positive and negative forms of the sine, cosine, secant, and cosecant functions during pretraining, participants were well positioned to identify the graphical representation of the secant function as being incorrect in the presence of the cosine formula as a sample stimulus. Having been exposed to pretraining and Experiment 1 training, participants were able to discriminate the graphical representation of cosine as being incorrect in the presence of the secant formula as a sample stimulus. Thus, during the assessment of trained and derived relations, we were able to rotate the sample and comparison stimuli across trials such that the placement of targets and distracters were counterbalanced. In the event that a participant erred while being probed on any of the tested relations, she was immediately reexposed to the training of all three A-B, B-C, and C-D primary relations and was reassessed on all derived relations within the four-member relational network.
Correction strategies and MTS fluency criteria
Fluency (in the form of rate of accurate problem solving) is a consistent and reliable indicator of the probability of occurrence of a newly learned behavior (Binder, 1996). Some form of fluency seemed to be particularly important to address when gauging math progress; thus, our software placed a limited hold on the time allocated to respond to each MTS item. Specifically, any response that required more than 30 s was identified as an error, and if such a delay took place, the programmed contingencies required the participant to engage in reexposure training. If a participant had required more than four exposures, the program would have automatically ended and that participant would have been compensated, debriefed, and excused from the study; however, all participants easily achieved these criteria (see Tables 3 and 4).
Table 3.
Stage 1: Number of Exposures Required to Attain Mastery of the Cosine-Secant Four-Member Relational Network
Table 4.
Stage 2: Number of Exposures Required to Attain Mastery of Sine-Cosecant Four-Member Relational Network
During Step 1, we trained A1-B1 [i.e., y = cos(x) reciprocal of y = 1/cos(x)] relations, in which the program presented a trigonometric rule on-screen, and the experimenter requested participants to read aloud, “Two numbers are reciprocal of one another when their product is 1. The reciprocal of 2, for example, is ½ because 2 * ½ = 1. The reciprocal of the cosine function is illustrated below.” Participants read the rules on-screen twice, and each time the experimenter used his mouse arrow to point to the respective formulas. Participants clicked “next” to advance to the screen that assessed A1-B1 performance. If the correct comparison items were selected, participants moved to the next set of instructed relations; otherwise, they were reexposed to A1-B1 (formula-to-graph) relations training.
In Step 2, the same MTS procedure was used to train and test B1-C1 [i.e., y = 1/cos(x) same as y = sec(x)] relations. As the program presented a trigonometric rule on the computer screen, the experimenter requested that participants read the mathematical rule aloud. Participants read the following rule: “The reciprocal of the cosine function is the same as the secant function. This is referred to as a fundamental identity.”
The identity formulas were depicted immediately below the rule, and the experimenter used his mouse arrow to point from one formula to the next. Participants then read the following rule at the bottom of the screen: “In other words, when you see 1/cos(x), you should say ‘secant.’” After reading these rules aloud twice, participants clicked “next” and advanced to the screen that assessed B1-C1 relations. If the correct comparison item were selected in the context of same as, participants were exposed to the next set of instructed relations; if not, the software reexposed participants to training beginning at Step 1 of Stage 1.
In Step 3, a similar procedure was employed to train and test C1-D1 [i.e., y = sec(x) same as the graphed representation of the secant function] relations. Participants read the following rule: “From formula to graph, the secant function is illustrated below.” The basic secant formula and its graph were depicted immediately below the rule, and the experimenter used his mouse arrow to point to the formula and then to its graph. Subsequent to reading these rules aloud twice, participants clicked “next” and advanced to the assessment of C1-D1 relations. (Note that the C1-D1 relations had been assessed for combinatorial entailment as part of the pretraining protocol.) If the correct comparison item were identified in the context of same as, the program moved participants to a series of assessments addressing four-term relations that pertained to combinatorially entailed frames of coordination (same as) and frames of reciprocity (opposite of). If, in any test, the correct comparison item was not identified, participants were reexposed to training, beginning with Step 1 of Stage 1.
During Step 4, participants were assessed on mutually entailed (D1-C1, C1-B1, and B1-A1) relations, as well as all combinatorially entailed (B1-D1 and D1-B1) relations, frames of coordination, and frames of reciprocity (A1-D1, D1-A1, A1-C1, and C1-A1; see bottom of Figure 6 for examples of B1-A1 and B1-D1 test questions). In conjunction with these primary assessments, several probe items were provided (i.e., tests in which the secant function was an incorrect response) such that the placement of targets and distracters was counterbalanced. At each assessment, if the correct comparison item was identified, participants advanced to the next set of assessments. If the correct comparison item was not identified, participants were reexposed to training beginning at Step 1 of Stage 1.
Stage 2: Training and testing of sine and cosecant reciprocals
After completing the training and testing of cosine and secant reciprocal functions, participants were exposed to a series of parallel steps pertaining to the sine and cosecant reciprocal functions. Addressing the training and testing of sine and cosecant reciprocal relations, participants were trained and tested on A2-B2 [i.e., y = sin(x) reciprocal of y = 1/sin(x)], B2-C2 [i.e., y = 1/sin(x) same as y = csc(x)], C2-D2 [i.e., y = csc(x) same as the graphed representation of the cosecant function] relations and then assessed regarding the mutually entailed (D2-C2, C2-B2, and B2-A2) and combinatorially entailed (B2-D2, D2-B2, A2-D2, D2-A2, A2-C2, and C2-A2) relations. Just as in Stage 1, the placement of targets and distracters was counterbalanced with probe items. Because training and testing of the sine and cosecant reciprocals employed the same procedures as those directed at the training of cosine-secant relations, the details of these procedures are not included.
Results
Complete outcomes for each participant across Stages 1 and 2 of Experiment 2 are provided in Table 3. Participant 1 failed to identify the combinatorially entailed formula-to-graph relation of A1-D1 [y = cos(x) reciprocal of secant graph] and was reexposed to all A1-B1, B1-C1, and C1-D1 relations training in Stage 1. She then passed the assessment of all derived relations within the four-member cosine-secant network. Participant 2 failed to identify the formula-to-graph combinatorially entailed relation of A1-C1 [y = cos(x) reciprocal of y = sec(x)] during Stage 1. She was reexposed to A1-B1, B1-C1, and C1-D1 relations training in Stage 1 and then passed the assessments of all mutually entailed and combinatorially entailed relations within the cosine-secant network. During Stage 2, this participant erred while attempting to derive a combinatorially entailed formula-to-graph relation of A2-D2 in the form y = sin(x) reciprocal of cosecant graph and was reexposed to Stage 2 A2-B2, B2-C2, and C2-D2 relations training. Following reexposure, she passed all assessments in the sine-cosecant relational network. Participants 3 and 4 emitted no errors throughout the duration of the assessments that addressed A2-B2, B2-C2, and C2-D2 trained relations; the mutually entailed D2-C2, C2-B2, and B2-A2 relations; or the combinatorially entailed relations including B2-D2, D2-B2, A2-D2, D2-A2, A2-C2, and C2-A2.
Posttreatment assessment of novel formula-to-graph relations
Figure 7 (top) shows a binary graph depicting trial-by-trial responding with the results of the novel trigonometric assessment items obtained in Experiment 1, followed by those obtained in Experiment 2. All 4 participants were assessed on 10 novel formula-to-graph relations prior to training. After completion of training and testing of reciprocal identities, each participant was assessed with 10 novel formula-to-graph relations that were of the same type employed prior to training. These items were novel in the sense that they addressed positive and negative forms of sine, cosine, secant, and cosecant as they transform when multiplying the function, the argument of the function, or both, by a number greater or less than 1. Prior to training in Experiment 2, Participant 1 identified two of 10 formula-to-graph assessments (Items 16 to 25 in Experiment 2; Figure 7, top); after training, she identified 13 of 15 novel formula-to-graph assessments correctly (Items 26 to 40 in Experiment 2). Prior to training in Experiment 2, Participant 2 correctly responded to one of 10 novel assessments (Items 16 to 25); following training, she correctly responded to 13 of 15 assessments of novel relations (Items 26 to 40). Before training, Participant 3 correctly identified only one of the 10 pretraining formula-to-graph assessments (Items 21 to 30); after training, she identified nine of the 10 novel formula-to-graph assessments (Items 31 to 40). Prior to training in Experiment 2, Participant 4 identified only one of 10 baseline formula-to-graph assessments (Items 21 to 30); after training, she identified eight of 10 novel formula-to-graph assessments (Items 31 to 40). Moreover, these assessments of novel relations used sample formulas in reciprocal format (Figure 7, bottom). Participants 1 and 2 were exposed to five fewer baseline items during Experiment 1 and received five additional test items following treatment during Experiment 2. Otherwise, all items in the assessment of novel relations were the same for all participants. In conjunction with these novel assessments of reciprocal relations, we provided one probe item [y = 2 sin(−x)]. Participant 3 emitted an incorrect response to this test item. All other participants responded correctly to the probe item.
Figure 7.

The top panel depicts trial-by-trial responding for novel trigonometric assessment items obtained in Experiment 1, followed by Experiment 2 with the transition between experiments indicated by the dotted lines. Within each experiment, training is designated by the solid heavy double lines. Problem numbers are listed along the x axis. Accurate responses are represented by zeros, and errors are shaded and represented by ones. The bottom panel represents novel relations test items.
GENERAL DISCUSSION
Experiment 1 showed that online construction-based training and testing of amplitude and frequency relations were sufficient to prepare participants to address more complex reciprocal trigonometric relations. During Experiment 2, we trained two four-member relational networks addressing reciprocal of and same as trigonometric relations in accordance with reciprocal identities. All participants derived mutually entailed relations (D same as C, C same as B, B reciprocal of A), and combinatorially entailed relations (B same as D, D same as B, A reciprocal of D, D reciprocal of A, A reciprocal of C, and C reciprocal of A) that constituted four-member relational networks (see Figure 6, top). Participants then performed well on tests of novel complex formula-to-graph relations, including positive and negative forms of sine, cosine, secant, and cosecant transformed by multiplying the trigonometric formulas, the argument of the formulas, or both, by varied numbers above or below 1. Moreover, the formula-to-graph relations identified during the assessment of novel relations included a large and diverse network of relations that extended beyond the exemplars used during pretraining, construction-based training, and MTS training. These findings suggest that participants were not constructing or relating samples and comparisons as unitary stimuli, but were learning to identify the relations among all formulas and graphs, consistent with outcomes from other relational frame studies of similar learned relations (e.g., same as, more than) and spatial and mathematical relations (Dymond & Barnes, 1995; Ninness et al., 2006).
What makes relational networks in trigonometry and precalculus powerful is their ability to extend existing abstract relations so that they contribute to the student's ability to derive similar networks while the basic characteristics of the original are retained. For example, the four-term cosine-secant reciprocal relations network contains all combinatorially entailed relations that form the basis of the four-term sine-cosecant network. Although these trigonometric functions transform graphically according to patterns that are analogous, the graphical transformations of the “even” cosine-secant reciprocal functions are not the same as those of the “odd” sine-cosecant reciprocal functions. Each of the trigonometric functions trained in this study has unique transformation characteristics, and our baseline outcomes suggest that the patterns for each of these functions are not intuitively obvious. However, our data suggest that once students have acquired the pretraining skills that pertain to positive and negative forms of the sine, cosine, secant, and cosecant functions; learned the mutually entailed relations pertaining to amplitude and frequency; and acquired the combinatorially entailed relations addressing the functional identities; they are well positioned to respond to a wide range of complex and novel formula-to-graph relations.
This study employed a novel strategy of online construction-based responding rather than selection-based MTS procedures. The construction procedure is somewhat similar to Sidman's (1994) pretraining strategies used prior to the implementation of MTS training. Although construction-based responding is somewhat more time consuming than MTS procedures, the additional instructional time may be well worth the effort. Perhaps, somewhat analogous to the way in which multiple-choice test items allow faster responding than short essay test items, selecting correct comparison graphs via MTS procedures is more efficient but less demanding than constructing graphs. The more demanding task of graph construction may produce more robust responding during training of abstract concepts, although this statement is speculative at this point and requires empirical verification.
Presently, we are pursuing variations of construction-based responding in conjunction with MTS procedures with the ambition of developing more relational networks that establish trigonometric identities, inverse trigonometric functions, and conversion of polar coordinates to rectangular coordinates and vice versa. Although these topics may appear to be beyond the grasp of students who lack well-established mathematical repertoires, the present study and our ongoing investigations suggest that mathematically inexperienced but verbally competent adolescents and adults are capable of mastering complex and multifaceted abstract concepts efficiently when procedures based on derived relational responding are used. Future research might contrast protocols based on stimulus relations training with existing behavioral strategies that address higher level math operations.
Considering that the math literacy levels of U.S. high-school students are inferior to almost all peers from OECD countries and also considering the potential benefits of blending components of high-school and college-level math curricula with strategies based on derived stimulus relations, our ambition has been to lay some of the groundwork for more sophisticated computer-interactive procedures. An instructional technology of mathematics based on derived stimulus relations might provide one method that contributes to addressing the challenges that face many of this nation's high schools and colleges in the area of basic mathematics. We believe the emerging research in derived stimulus relations may add an important dimension to the technology of teaching described so elegantly in the writings of Skinner (1968).
Acknowledgments
Portions of this paper were presented at the 33rd annual conference of the Association for Behavior Analysis. Earlier versions of the Web-based training protocols used in Experiment 1 are described in Ninness et al. (2009).
REFERENCES
- Berens N.M, Hayes S.C. Arbitrarily applicable comparative relations: Experimental evidence for a relational operant. Journal of Applied Behavior Analysis. 2007;40:45–71. doi: 10.1901/jaba.2007.7-06. [DOI] [PMC free article] [PubMed] [Google Scholar]
- Binder C. Behavioral fluency: Evolution of a new paradigm. The Behavior Analyst. 1996;19:163–197. doi: 10.1007/BF03393163. [DOI] [PMC free article] [PubMed] [Google Scholar]
- Conway P.F, Sloane F.C. International trends in post-primary mathematics education. 2005. Report to the National Council for Curriculum and Assessment, Dublin, Ireland.
- Dymond S, Barnes D. A transformation of self-discrimination response functions in accordance with the arbitrarily applicable relations of sameness, more than, and less than. Journal of the Experimental Analysis of Behavior. 1995;64:163–184. doi: 10.1901/jeab.1995.64-163. [DOI] [PMC free article] [PubMed] [Google Scholar]
- Ensley D, Crawley W. Discrete mathematics: Mathematical reasoning with puzzles, patterns and games. New York: Wiley; 2005. [Google Scholar]
- Ensley D, Kaskosz B. Flash and math applets learn by example: Introduction to ActionScript programming for mathematics and science teaching and learning. Charleston, SC: BookSurge; 2008. [Google Scholar]
- Hayes S.C, Barnes-Holmes D, Roche B, editors. Relational frame theory: A post-Skinnerian account of human language and cognition. New York: Kluwer Academic/Plenum; 2001. [DOI] [PubMed] [Google Scholar]
- Lynch D.C, Cuvo A.J. Stimulus equivalence instruction of fraction-decimal relations. Journal of Applied Behavior Analysis. 1995;28:115–126. doi: 10.1901/jaba.1995.28-115. [DOI] [PMC free article] [PubMed] [Google Scholar]
- Mayfield K.H, Chase P.N. The effects of cumulative practice on problem solving. Journal of Applied Behavior Analysis. 2002;35:105–123. doi: 10.1901/jaba.2002.35-105. [DOI] [PMC free article] [PubMed] [Google Scholar]
- Ninness C, Barnes-Holmes D, Rumph R, McCuller G, Ford A, Payne R, et al. Transformation of mathematical and stimulus functions. Journal of Applied Behavior Analysis. 2006;39:299–321. doi: 10.1901/jaba.2006.139-05. [DOI] [PMC free article] [PubMed] [Google Scholar]
- Ninness C, Holland J, McCuller G, Rumph R, Ninness S, McGinty J, et al. Mathematical reasoning. In: Rehfeldt R.A, Barnes-Holmes Y, editors. Derived relational responding: Applications for learners with autism and other developmental disabilities. Oakland, CA: New Harbinger; 2009. pp. 313–334. [Google Scholar]
- Ninness C, Rumph R, McCuller G, Harrison C, Ford A.M, Ninness S. A functional analytic approach to computer-interactive mathematics. Journal of Applied Behavior Analysis. 2005;38:1–22. doi: 10.1901/jaba.2005.2-04. [DOI] [PMC free article] [PubMed] [Google Scholar]
- Ninness C, Rumph R, McCuller G, Vasquez E, Harrison C, Ford A.M, et al. A relational frame and artificial neural network approach to computer-interactive mathematics. The Psychological Record. 2005;51:561–570. [Google Scholar]
- No child left behind. (2001). 34 CFR Part 200.
- Programme for International Student Assessment. Learning for tomorrow's world: First results from PISA 2003. 2003. Retrieved July 8, 2007, from http://www.pisa.oecd.org/dataoecd/1/60/34002216.pdf.
- Schmidt W, Houang R, Cogan L. A coherent curriculum: The case of mathematics. American Educator. 2002;26:10–26, 47–48. [Google Scholar]
- Sidman M. Equivalence relations and behavior: A research story. Boston: Authors Cooperative; 1994. [Google Scholar]
- Skinner B.F. The technology of teaching. New York: Appleton-Century-Crofts; 1968. [Google Scholar]
- Sullivan M. Precalculus (6th ed.) Upper Saddle River, NJ: Prentice Hall; 2002. [Google Scholar]
- U.S. Department of Education, National Center for Education Statistics. U.S. students and adult performance on international assessments of educational achievement: Findings from the condition of education 2006. 2006. Retrieved July 8, 2007, from http://www.nces.ed.gov/pubs2006/2006073.pdf.