Abstract
Background
Although we always want to select the best signal-processing strategy for our hearing-aid and cochlear-implant patients, no efficient and valid procedure is available. Comparisons in the office are without listening experience, and short-term take-home trials are likely influenced by the order of strategies tried.
Purpose
The purpose of this study was to evaluate a new procedure for comparing signal-processing strategies whereby patients listen with one strategy one day and another strategy the next day. They continue this daily comparison for several weeks. We determined (1) if differences existed between strategies without prior listening experience and (2) if performance differences (or lack there of) obtained at the first listening experience are consistent with performance after two to three months of alternating between strategies on a daily basis (equal listening experience).
Research Design
Eight subjects were tested pretrial with a vowel, sentence, and spondee recognition test, a localization task, and a quality rating test. They were required to listen to one of two different signal processing strategies alternating between strategies on a daily basis. After one to three months of listening, subjects returned for follow-up testing. Additionally, subjects were asked to make daily ratings and comments in a diary.
Results
Pre-trial (no previous listening experience), a clear trend favoring one strategy was observed in four subjects. Four other subjects showed no clear advantage. Post-trial (after alternating daily between strategies), of the four subjects who showed a clear advantage for one signal processing strategy, only one subject showed that same advantage. One subject ended up with an advantage for the other strategy. Post-trial, of the four subjects who showed no advantage for a particular signal processing strategy, three did show an advantage for one strategy over the other.
Conclusion
Patients are willing to alternate between signal processing strategies on a daily basis for up to three months in an attempt to determine their optimal strategy. Although some patients showed superior performance with initial fittings (and some did not), the results of pre-trial comparison did not always persist after having equal listening experience. We recommend this daily alternating listening technique when there is interest in determining optimal performance among different signal processing strategies when fitting hearing aids or cochlear implants.
Keywords: Bilateral, cochlear implants, hearing aids, hearing devices, hearing loss, localization, signal processing, speech perception
Individuals who suffer from hearing loss are often fit with hearing devices in an attempt to provide better speech recognition and localization abilities. Although much research has been done looking at the effects of various signal-processing algorithms (Parkinson et al, 1998; Kompis et al, 1999; Dorman et al, 2002; Psarros et al, 2002; Spahr and Dorman, 2004; Dunn et al, 2006), there is still no clear rule or method for choosing the best strategy for each patient. Often, various signal-processing strategies are offered during the initial device fitting, and patients are encouraged to try those strategies in their own communication environment to determine what works best for them. Although this recommendation may have good intent, some patients may be hesitant to try various programs or may not know how long they should listen with each program. In the end, they may miss finding their “best” strategy.
When patients compare signal-processing algorithms, most research trials require them to wear a device configured according to a specific signal-processing strategy for a predetermined amount of time, to test with that strategy, and then to switch to another strategy. There are some disadvantages to this methodology. Namely, the listening experience may be short, giving patients only a few minutes or hours to acclimate to the new sound, whereas listening acclimation may take place over many days or months. Sometimes, each strategy is worn for a specific block of time (for example, 4 weeks or 1 month to 8 weeks) before the next strategy is introduced. The human auditory system, however, has great plasticity. Research has shown that the brain has the capacity to reorganize and change neural pathways on the basis of new experiences (Rosen et al, 1999; Fu et al, 2005; Iverson et al, 2005; Kacelnik et al, 2006). Because of this capacity, we feel that it is important to offer multiple signal-processing strategies at the time of device fitting in combination with a regulated daily wearing routine. Alternating strategies daily may allow the brain to determine which strategy is best for an individual. We hypothesize that through alternating between strategies used (thereby giving each strategy equal wearing time), the brain will determine—over time and with experience—which strategy is best, which will result in improved speech perception and localization abilities for each individual.
In this study, subjects alternated daily between two signal-processing strategies. The purpose of this study was (a) to determine if differences exist in performance between signal-processing strategies at initial stimulation without any previous listening experience and (b) to determine if performance differences, or lack thereof, obtained at the first listening experience predict performance after 2–3 months of equal listening experience. In addition, we were interested in the compliance of the subjects in regard to alternating between different signal-processing strategies.
METHOD
Participants
The subjects for this study consisted of nine individuals (three males and six females), who received bilateral cochlear implants during a single operation. Six patients received an Advanced Bionics 90 K internal device, while three patients received a Cochlear Corporation CI24RE (CA) internal device. Table 1 displays individual biographical information. Subjects ranged in age from 31 to 81 years, with an average of age 59.
Table 1.
Demographic Information for Each Subject
| Duration of Deafness (years) |
||||||
|---|---|---|---|---|---|---|
| Subject | Age (years) at Implantation | Sex | Left | Right | Etiology | Cochlear Implant Device |
| Z34b | 31 | M | 14 | 14 | Meningitis | Advanced Bionics 90 K |
| Z30b | 57 | M | 5 | 5 | Unknown | Advanced Bionics 90 K |
| Z25b | 66 | F | 0 | 0 | Hereditary | Advanced Bionics 90 K |
| Z33b | 54 | M | 28 | 28 | Autoimmune | Advanced Bionics 90 K |
| Z48b | 71 | F | 12 | 12 | Hereditary | Advanced Bionics 90 K |
| Z63b | 62 | F | 5 | 5 | Noise Exposure | Advanced Bionics 90 K |
| E12b | 44 | F | Unknown | Unknown | Unknown | Cochlear Corporation CI24RE(CA) |
| E23b | 81 | F | 0 | 0 | Unknown | Cochlear Corporation CI24RE(CA) |
| E14b | 69 | F | 10 | 10 | Unknown | Cochlear Corporation CI24RE(CA) |
Initial Stimulation Programming
At the time of initial stimulation, all subjects were programmed bilaterally with two different signal-processing strategies. Table 2 lists the individual programming details for each subject for each ear. The Advanced Bionics patients received an 8-channel, 829-pulses-per second (pps), continuous interleaved strategy (CIS) and either a 16-channel Advanced Bionics HiResolution Paired (HiRes P) or HiResolution Sequential (HiRes S) strategy. The CIS program was created using a HiRes S program with all even channels turned off and with pulse width increased to 75.4 microseconds (μs). The HiRes P and HiRes S programs used all 16 electrodes and had a default pulse width of 10.8 μs. The HiRes P program stimulates in a paired fashion, producing a rate of 5156 pps, whereas the HiRes S program stimulates sequentially, producing a rate of 2,900 pps.
Table 2.
Programming Parameters for Each Device for Each Subject
| Programming Parameters | ||||||||||||
|---|---|---|---|---|---|---|---|---|---|---|---|---|
| Initial Stimulation | 1-Month Follow-Up | 3-Month Follow-Up | ||||||||||
| Subject Z34b | ||||||||||||
| Strategy | HiRes S | CIS | HiRes S | CIS | HiRes S | CIS | ||||||
| Ear | R | L | R | L | R | L | R | L | R | L | R | L |
| Channels | 15 | 16 | 8 | 8 | 15 | 16 | 8 | 8 | 15 | 16 | 8 | 8 |
| Rate | 3093 | 2900 | 829 | 829 | 3093 | 2900 | 829 | 829 | 3093 | 2900 | 829 | 829 |
| Microphone Type | 50/50 | 50/50 | 50/50 | 50/50 | Aux Only | Aux Only | Aux Only | Aux Only | Aux Only | Aux Only | Aux Only | Aux Only |
| IDR | 60 | 60 | 60 | 60 | 60 | 60 | 60 | 60 | 60 | 60 | 60 | 60 |
|
| ||||||||||||
| Subject Z25b | ||||||||||||
| Strategy | HiRes S | CIS | HiRes S | CIS | HiRes S | CIS | ||||||
| Ear | R | L | R | L | R | L | R | L | R | L | R | L |
| Channels | 16 | 16 | 8 | 8 | 16 | 16 | 8 | 8 | 16 | 16 | 8 | 8 |
| Rate | 2320 | 2320 | 829 | 829 | 2677 | 2320 | 829 | 829 | 2677 | 2486 | 829 | 829 |
| Microphone Type | 50/50 | 50/50 | Aux Only | Aux Only | Aux Only | Aux Only | Aux Only | Aux Only | 50/50 | 50/50 | 50/50 | 50/50 |
| IDR | 60 | 60 | 60 | 60 | 60 | 60 | 60 | 60 | 60 | 60 | 60 | 60 |
|
| ||||||||||||
| Subject Z63b | ||||||||||||
| Strategy | HiRes P | CIS | HiRes P | CIS | HiRes P | CIS | ||||||
| Ear | R | L | R | L | R | L | R | L | R | L | R | L |
| Channels | 16 | 16 | 8 | 8 | 16 | 16 | 8 | 8 | 16 | 16 | 8 | 8 |
| Rate | 5156 | 5156 | 829 | 829 | 5156 | 5156 | 829 | 829 | 5156 | 5156 | 829 | 829 |
| Microphone Type | 50/50 | 50/50 | 50/50 | 50/50 | 50/50 | 50/50 | 50/50 | 50/50 | 50/50 | 50/50 | 50/50 | 50/50 |
| IDR | 60 | 60 | 60 | 60 | 60 | 60 | 60 | 60 | 60 | 60 | 60 | 60 |
|
| ||||||||||||
| Subject E23b | ||||||||||||
| Strategy | ACE | ACE (RE) | ACE | ACE (RE) | ACE | ACE (RE) | ||||||
| Ear | R | L | R | L | R | L | R | L | R | L | R | L |
| Channels | 22 | 22 | 22 | 22 | 22 | 22 | 22 | 22 | 22 | 22 | 22 | 22 |
| Rate | 900 | 900 | 1800 | 1800 | 900 | 900 | 1800 | 1800 | 900 | 900 | 1800 | 1800 |
| # of Maxima | 8 | 8 | 10 | 10 | 8 | 8 | 10 | 10 | 8 | 8 | 10 | 10 |
|
| ||||||||||||
| Subject Z48b | ||||||||||||
| Strategy | HiRes P | CIS | HiRes P | CIS | HiRes P | CIS | ||||||
| Ear | R | L | R | L | R | L | R | L | R | L | R | L |
| Channels | 15 | 16 | 8 | 8 | 15 | 16 | 8 | 8 | 15 | 16 | 8 | 8 |
| Rate | 5156 | 5156 | 829 | 829 | 5156 | 5156 | 829 | 829 | 5156 | 5156 | 829 | 829 |
| Microphone Type | 50/50 | 50/50 | 50/50 | 50/50 | 50/50 | 50/50 | 50/50 | 50/50 | 50/50 | 50/50 | 50/50 | 50/50 |
| IDR | 60 | 60 | 60 | 60 | 60 | 60 | 60 | 60 | 60 | 60 | 60 | 60 |
|
| ||||||||||||
| Subject E12b | ||||||||||||
| Strategy | ACE | ACE (RE) | ACE | ACE (RE) | ACE | ACE (RE) | ||||||
| Ear | R | L | R | L | R | L | R | L | R | L | R | L |
| Channels | 22 | 22 | 22 | 22 | 22 | 22 | 22 | 22 | 22 | 22 | 22 | 22 |
| Rate | 900 | 900 | 1800 | 1800 | 900 | 900 | 1800 | 1800 | 900 | 900 | 1800 | 1800 |
| # of Maxima | 8 | 8 | 10 | 10 | 8 | 8 | 10 | 10 | 8 | 8 | 10 | 10 |
|
| ||||||||||||
| Subject E14b | ||||||||||||
| Strategy | ACE | ACE (RE) | ACE | ACE (RE) | ACE | ACE | ||||||
| Ear | R | L | R | L | R | R | L | R | L | R | R | L |
| Channels | 22 | 22 | 22 | 22 | 22 | 22 | 22 | 22 | 22 | 22 | 22 | 22 |
| Rate | 900 | 900 | 1800 | 1800 | 900 | 900 | 900 | 1800 | 1800 | 900 | 900 | 900 |
| # of Maxima | 8 | 8 | 10 | 10 | 8 | 8 | 8 | 10 | 10 | 8 | 8 | 8 |
|
| ||||||||||||
| Subject Z33b | ||||||||||||
| Strategy | HiRes S | CIS | HiRes S | CIS | HiRes S | CIS | ||||||
| Ear | R | L | R | L | R | L | R | L | R | L | R | L |
| Channels | 16 | 16 | 8 | 8 | 16 | 16 | 8 | 8 | 16 | 16 | 8 | 8 |
| Rate | 2320 | 2900 | 829 | 829 | 1657 | 1832 | 829 | 829 | 1832 | 1740 | 829 | 829 |
| Microphone Type | Aux Only | Aux Only | Aux Only | Aux Only | Aux Only | Aux Only | Aux Only | Aux Only | Aux Only | Aux Only | Aux Only | Aux Only |
| IDR | 60 | 60 | 60 | 60 | 60 | 60 | 60 | 60 | 60 | 60 | 60 | 60 |
|
| ||||||||||||
| Subject Z30b | ||||||||||||
| Strategy | HiRes P | CIS | HiRes S | CIS | HiRes S | CIS | ||||||
| Ear | R | L | R | L | R | L | R | L | R | L | R | L |
| Channels | 16 | 16 | 8 | 8 | 16 | 16 | 8 | 8 | 16 | 16 | 8 | 8 |
| Rate | 5156 | 5156 | 829 | 829 | 5156 | 5156 | 829 | 829 | 5156 | 5156 | 829 | 829 |
| Microphone Type | 50/50 | 50/50 | 50/50 | 50/50 | 50/50 | 50/50 | 50/50 | 50/50 | 50/50 | 50/50 | 50/50 | 50/50 |
| IDR | 60 | 60 | 60 | 60 | 60 | 60 | 60 | 60 | 60 | 60 | 60 | 60 |
The Cochlear Corporation patients received a standard 20-channel, Advanced Combination Encoders (ACE), 900-pps strategy and a 20-channel high-ACE (ACE [RE]) (1800-pps) strategy. Threshold and comfort levels were set using the standard recommendations provided by each cochlear implant company. Individual programming differences occurred across subjects and across visits to ensure that the subjects were receiving the most optimal map. Programs were placed in position 1 (P1) and position 2 (P2) of each speech processor. Details about the signal processing and map configurations were not given to the subjects.
One- and Three-Month Programming
At 1 and 3 months after implantation, all subjects were asked to return to our clinic for testing and tuning.
Procedures
Speech perception and localization tests were administered at initial stimulation and again after 1 and 3 months of use. Both signal-processing strategies were tested at each visit. Subjects were instructed to alternate daily between strategies for the entire 3-month period. Subjects were given calendars to remind them which program they were supposed to use (P1 or P2), and they were given a daily questionnaire and journal for their comments (see appendix). Subjects were unaware of any details of the signal processing for each program. The order in which programs were worn was counterbalanced among subjects. Specifically, some subjects started out wearing P1, while other subjects started out wearing P2. However, the position of each strategy (for example, CIS = P1; HiRes = P2) for each subject remained constant throughout the study. Thus, if CIS was placed in P1 for subject 1, then CIS remained in that position for the entire study and was never moved into P2.
Materials
The tests varied from subject to subject and depended on the performance level of each subject, as well as the time constraints. Subjects were evaluated on their speech recognition and localization abilities and were additionally assessed using a quality rating test. Because of time constraints, not all tests were given at each test session. The following tests were used:
CUNY (City University of New York) sentences (Boothroyd et al, 1985) in quiet or noise. Speech and noise were both presented from the front of the person (0° azimuth), with speech set at 70 dB(C) and noise consisting of a multitalker babble. Signal-to-noise ratios (S/N) were individually set to avoid ceiling and floor effects. CUNY sentences were scored by dividing the total number of words correctly identified by the total number of words possible. A total of 72 lists of 12 CUNY sentences were available for presentation to the subject. Four randomized lists were administered to each subject with a total of 102 key words per list. No lists were repeated to any subject twice.
Iowa Vowel Feature Test (Tyler et al, 1991) in quiet. This test consists of 20 monosyllabic words sorted into five sets of four words each (chance score of 25%). Each word was presented twice as a target for a total number of 40 presentations, and the test was administered twice for a total of 80 items. Test items were presented in either a consonant-vowel or a consonant-vowel-consonant format.
An adaptive, 12-choice Spondee Recognition Test (SRT; see Turner et al, 2004). Speech and babble were both presented from the front of the person, with the babble consisting of a two-talker (one female and one male) voice repeating different sentences. The level of the speech or target was set individually for each subject and was kept constant while testing with the two strategies. The level of the babble was initially set to equal the target level and, through an adaptive procedure, changed throughout the test. The subject manually selected the correct spondee from a closed set of 12 spondees arranged alphabetically on a computer screen. Using an adaptive 75% correct rule, the S/N was calculated in dB from a minimum of two runs. Performance on this test was reported by the S/N necessary for the subject to achieve 75% word understanding.
Everyday sound localization. This test was administered using the methodology and everyday-sound stimuli described in Dunn et al (2005). In summary, 16 everyday sounds were presented at 70 dB(C) from one of eight loudspeakers placed 15.5° apart at the subject’s 0° azimuth, forming an 108° arc (Byrne et al, 1998). Subjects were seated facing the center of the speaker array at a distance of approximately 1.4 meters. Each sound item was repeated six times and was presented randomly from one of the eight loudspeakers. Subjects were asked to identify the speaker number from which the sound originated. Smaller RMS (root mean square)-average-error scores represent better localization ability. Chance performance was a score of about 40 degrees or more.
Subjective quality ratings. These ratings were obtained through a test that consisted of five subcategories of sounds: adult voices, children’s voices, everyday sounds, music, and speech in noise. Each category contained 16 sound samples for a total of 96 items. Subjects were asked to listen to each randomly played sound, which was presented at 70 dB(C) and emanated from a loudspeaker placed in front. Using a computer touch screen and a visual analog scale, subjects rated each sound for clarity on a scale of zero (unclear) to 100 (clear).
RESULTS
Nine subjects participated in this study. Eight subjects alternated daily between two strategies without any complaints for a total of 3 months. One subject (Z25b) had a strong preference for one strategy over the other and stopped participating after 2 months of wearing use. She reported that she didn’t mind alternating between strategies and that she felt she could hear speech and music equally well with both strategies. However, she stated that one strategy (CIS) was like “wearing a shirt with a tag on the back that slightly irritates you, and you know you can remove it but are not allowed to.” She reported that she simply could not continue to wear a device programmed with that particular strategy even for one more day. Therefore, data from subject Z25b is not included in the first two analyses, but it is included in the section describing data over time.
Data for this study are expressed in difference scores. A difference score for each test was calculated and graphed for all eight subjects. Statistical significance was calculated for each test. The binomial model at the 0.05 level was used to determine statistical significance for CUNY sentences in both quiet (CunyQuiet) and noise (CunyNf) and for the Iowa Vowel Feature Test (Vowel). A paired t-Test at the 0.05 level was used to determine statistical differences for total scores on the subjective quality rating test (Quality) and localization. The average S/Ns were graphed with +/−1 standard error bars for the adaptive, 12-choice SRT.
Performance at Initial Stimulation
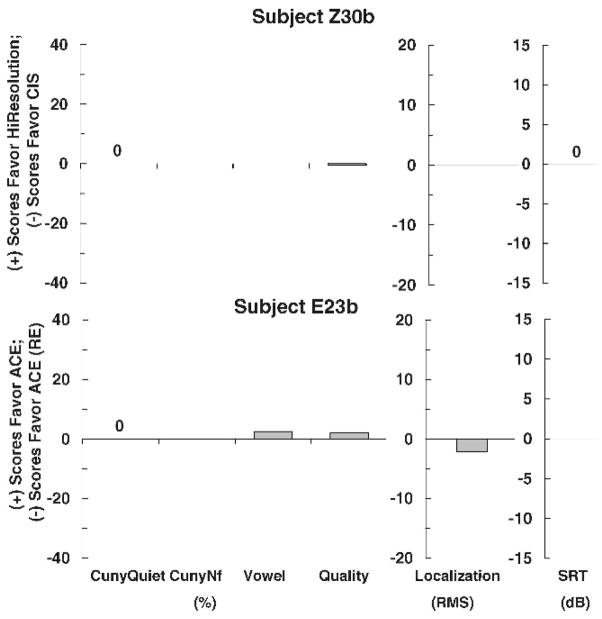
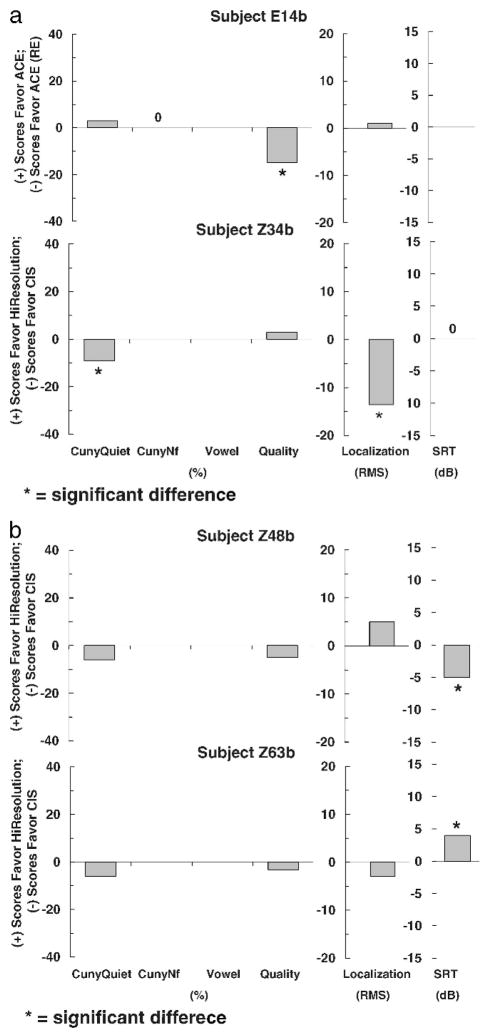
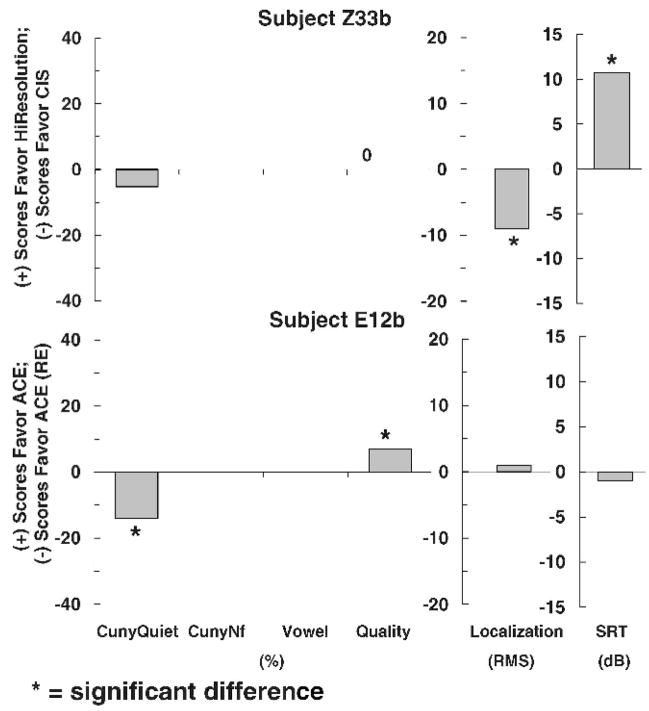
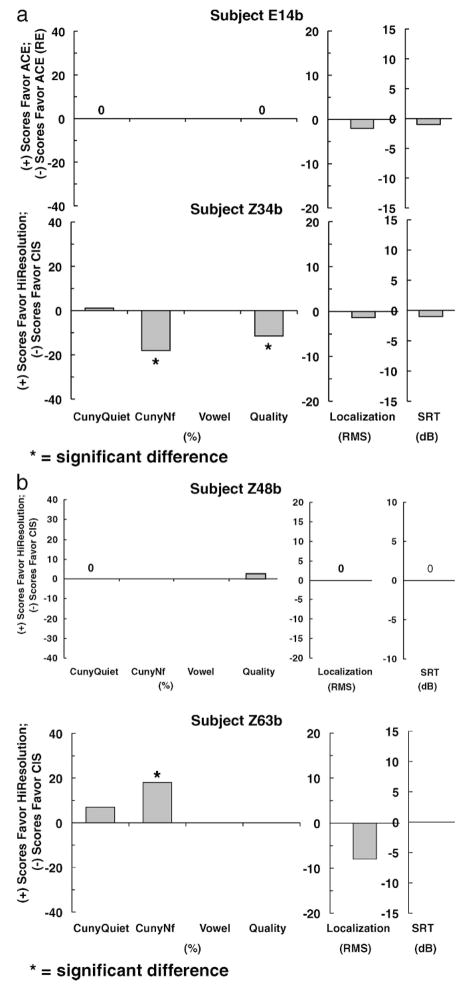
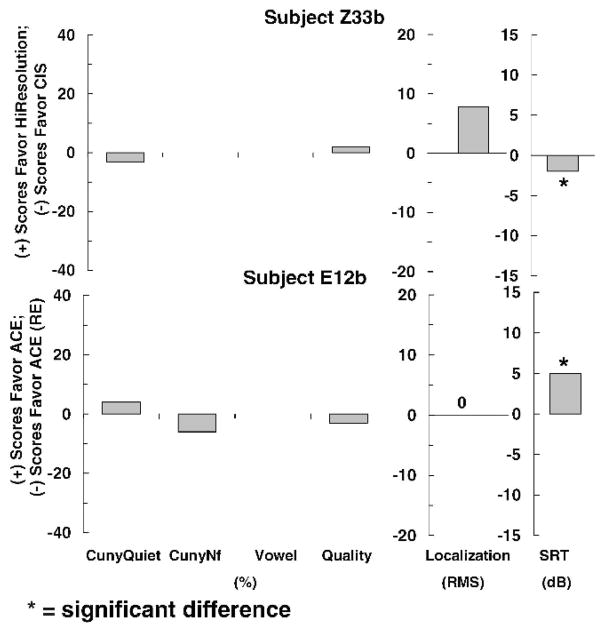
Figures 1–3 show individual difference scores for each test for each subject at the time of initial stimulation. Figure 1 shows results for subjects (Z30b and E23b) who showed no differences between strategies. Figure 2 shows results for subjects (Z33b and E12b), who did show differences between strategies. However, the differences were mixed. One strategy performed better on one test, whereas the other strategy performed better on another test. No clear trend for either strategy was found. Figures 3 shows results for four subjects (E14b, Z34b, Z48b, and Z63b) who did show statistically significant differences in favor of one strategy on at least one test. A clear trend in favor of one strategy was found for all four subjects.
Figure 1.
Individual difference scores for subjects Z30b and E23b for each test at the time of initial stimulation.
Figure 3.
Individual difference scores for subjects E14b, Z34b (a), Z48b and Z63b (b) for each test at the time of initial stimulation.
Figure 2.
Individual difference scores for subjects Z33b and E12b for each test at the time of initial stimulation.
Performance after 3 Months of Listening Experience
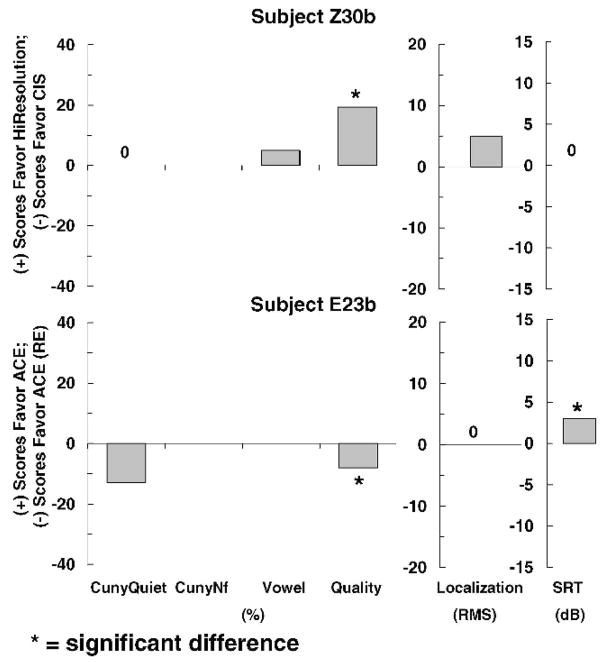
For clarity, we maintain the same order of subjects in Figures 4–6 as in Figures 1–3. Figures 4–6 show individual difference scores for each test for each subject after 3 months of use. Figure 4 shows that the two subjects who had no difference between strategies at initial stimulation did show differences between strategies after 3 months of use. Subject Z30b showed a statistically significant difference in favor of HiResolution processing over CIS for sound quality, whereas subject E23b had mixed responses. A statistically significant difference favoring ACE processing was found for sound quality. However, a statistically significant difference favoring ACE (RE) was found for spondee recognition in noise.
Figure 4.
Individual difference scores for subjects Z30b and E23b for each test after 3 months of use.
Figure 6.
Individual difference scores for subjects E14b and Z34b (a), and Z48b and Z63b (b) for each test after three months of use.
Figure 5 shows 3-month results for the two subjects who showed no consistent difference at initial stimulation. After 3 months of use, both subjects showed a clear trend favoring one particular strategy. Subject Z33b scored significantly better for spondee recognition in noise when wearing a device programmed with CIS than when wearing one programmed with HiResolution processing, whereas subject E12b scored significantly better for spondee recognition in noise when wearing a device programmed with ACE than when wearing one programmed with ACE (RE) signal processing.
Figure 5.
Individual difference scores for subjects Z33b and E12b for each test after 3 months of use.
Figure 6 displays data for the four subjects (E14b, Z34b, Z48b, and Z63b) who showed a statistically significant difference in favor of one strategy on at least one test at initial stimulation. After 3 months of wearing use, E14b and Z48b showed no differences across strategies on any test. Subject E14b scored similarly with ACE and ACE (RE) signal processing, and subject Z48b scored similarly with CIS and HiResolution processing. Subject Z34b showed the same statistical difference in favor of CIS after 3 months of wearing use as this subject did at initial stimulation. Subject Z63b showed a statistically significant difference in the opposite direction after 3 months of wearing use. At initial stimulation, Z63b scored better for spondee recognition in noise with HiResolution processing than with CIS. After 3 months of wearing use, Z63b scored better for understanding sentences in noise with CIS processing. All other tests showed no significant differences across the two strategies.
Performance over Time
In general, most subjects did not show large effects favoring one strategy over the other, nor did they state strong preferences in their daily journals. However, three subjects (Z34b, Z25b, and Z63b) did report a strong preference for one strategy over the other in their daily logs, and objective data showed a consistent statistically significant difference in the same direction as their preference.
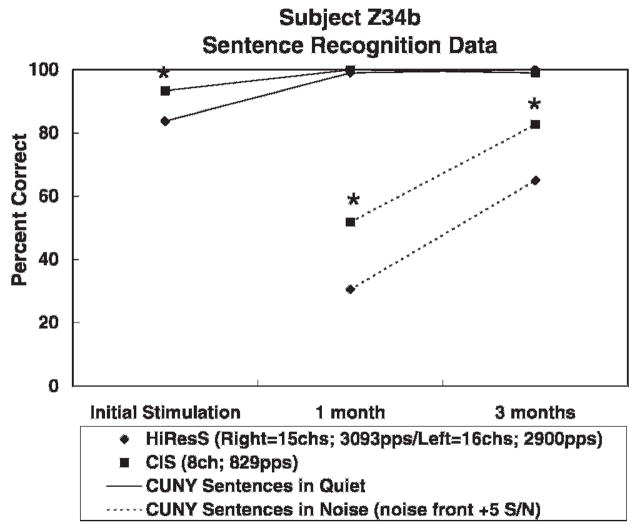
Figure 7 shows CUNY sentence recognition scores over time in quiet and in noise for subject Z34b. A statistically significant difference (p <.05) was found in favor of an 8-channel CIS strategy over a 15-channel HiResolution strategy (see Table 2 for programming details) for sentences in quiet at initial stimulation and for sentences in noise at 1 and 3 months after implantation. Sentence recognition scores in quiet reached a ceiling level at 1 month, which remained at 3 months after implantation.
Figure 7.
CUNY sentence recognition scores over time in quiet and in noise for subject Z34b.
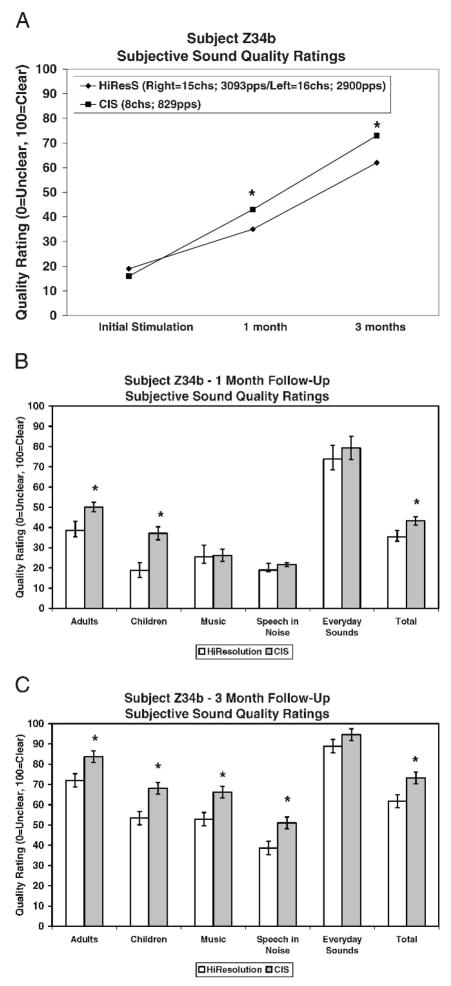
Figure 8a shows results over time for subjective sound-quality ratings. Only the total score is graphed in Figure 8a. A statistically significant difference (p<.05) was found in favor of CIS at 1 and 3 months after implantation. Figures 8b and 8c show results for each of the five subcategories and the total score collected at 1 and 3 months. Subject Z34b showed a statistically significant (p<.05) preference for the sound quality of the 8-channel CIS strategy over the 15-channel, high-resolution strategy in two out of the five subcategories (adult and children’s voices) at 1 month and in four out of the five subcategories (adult voices, plus children’s voices, music, and speech in noise) at 3 months. Daily logs revealed that by 2 weeks after implantation, subject Z34b felt that CIS was more helpful than HiResolution in understanding both music and speech. In addition, after the 3-month trial, this subject chose to wear only the CIS strategy and asked that we remove the high-resolution program from his speech processor.
Figure 8.
(a) Results over time for the total subjective sound-quality rating score for subject Z34b. (b) Results for each subcategory and the total score for the subjective sound-quality rating test for subject Z34b after 1 month of listening experience. (c) Results for each subcategory and the total score for the subjective sound-quality rating test for subject Z34b after 3 months of listening experience. *= statistically significant difference.
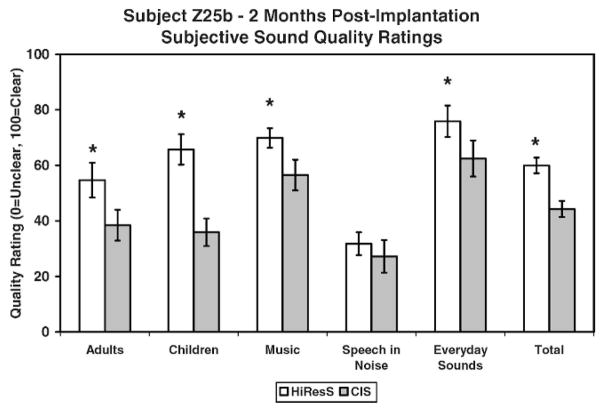
Subject Z25b was asked to alternate between CIS and high-resolution processing (see Table 2) for 3 months. Daily logs revealed that within days of initial stimulation subject Z25b strongly preferred HiResolution processing over CIS and refused to wear CIS after 2 months. Figure 9 shows results for a subjective sound-quality test completed at 2 months. A statistically significant difference (p<.05) was found in favor of HiRes S for four out of the five subcategories of adult voices, children’s voices, music, and everyday sounds) and a total score.
Figure 9.
Results for subject Z25b for the subjective sound-quality test completed after 2 months of listening experience. *= statistically significant difference.
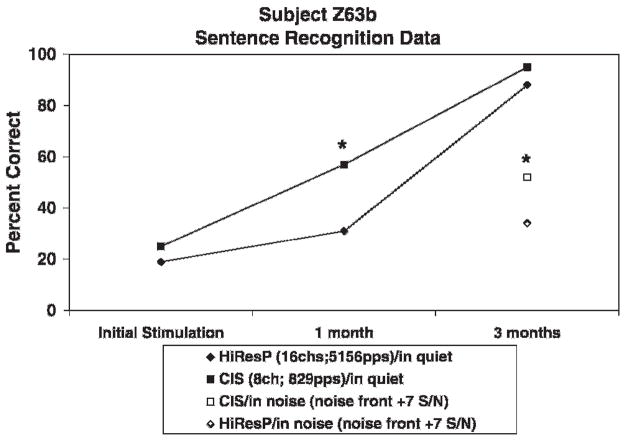
Subject Z63b alternated between an 8-channel CIS and a 16-channel HiResolution strategy (see Table 2 for programming details). Daily logs revealed that, after 1.5 months of use, subject Z63b reported a preference for CIS processing in more difficult noisy situations. In addition, she reported a 20% increase in speech understanding in quiet. After the 3-month trial, Z63b chose to wear the 8-channel CIS strategy exclusively. Figure 10 shows CUNY sentence recognition scores over time in quiet and in noise. A statistically significant difference (p<.05) was found in favor of CIS for sentences in quiet at the 1-month follow-up visit and for sentences in noise at the 3-month follow-up visit. Sentence recognition scores in quiet reached a ceiling level at 3 months after implantation.
Figure 10.
CUNY Sentence recognition scores over time in quiet and in noise for subject Z63b after 1 month of listening experience. *= statistically significant difference.
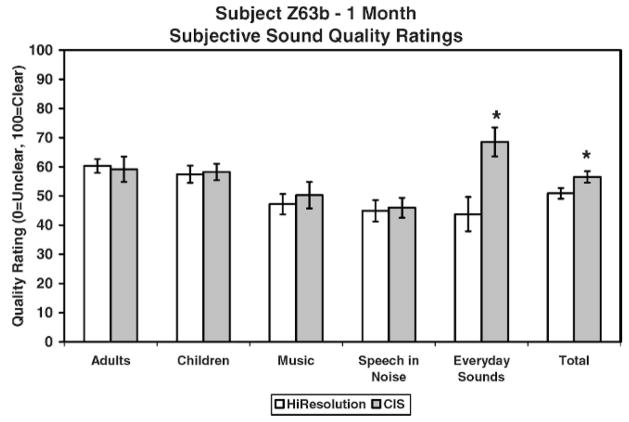
Figure 11 shows results for each of the five subcategories and the total score for quality ratings. Subject Z63b showed a statistically significant (p <.05) preference for the sound quality of the 8-channel CIS strategy over the 16-channel HiResolution strategy in one out of the five subcategories (everyday sounds) and in the total score.
Figure 11.
Results for each of the five subcategories and the total score for quality ratings for subject Z63b after 3 months of listening experience. *= statistically significant difference.
DISCUSSION
In this study, adult recipients of bilateral cochlear implants were asked to alternate daily between two signal-processing strategies for a period of 3 months from the time of initial stimulation. One of the most important observations of this study was that none of the subjects found this task to be difficult, nor did they feel that it disrupted their daily listening activities. All subjects willingly alternated daily between processing strategies. One subject did refuse to complete the study. However, this refusal was due to a negative percept given by one particular processing strategy and not due to the task itself. Given such a high compliance rate (100%), we feel that this practice might work well with others and could perhaps become a new clinical method for trying various signal-processing strategies.
One purpose of this study was to determine if differences in signal processing exist at initial stimulation without any previous listening experience. All but one subject willingly completed testing at initial stimulation, a practice that is not typical in most clinical settings. Subject Z25b was extremely emotional on the day of hookup, and the clinician felt that it was not in her best interest to complete testing at that time. However, eight out of nine subjects willingly completed testing at initial stimulation suggesting that this practice too might be useful in a clinical setting. Of the eight subjects who completed testing at initial stimulation, six showed a difference in performance between types of signal processing. This result clearly indicates that differences in signal processing can exist without any previous listening experience. In this study, a large battery of tests was administered. Closer review of the data shows that no one test was responsible for capturing the differences found between strategies. This finding indicates that more than one test should be administered to determine which strategy may or may not be the best for each patient.
Another purpose of this study was to determine if performance differences (or lack thereof) obtained at the first listening experience predict performance after 2–3 months of equal listening experience. Out of eight subjects, only one subject (Z34b) had consistent results at 3 months after implantation in comparison to initial stimulation. The data from all of the other subjects changed over time. Three subjects (Z30b, Z33b, and E12b) showed either no differences or mixed results (no clear trend) regarding a clear difference after three months. This finding would suggest that some individuals can determine a strategy preference at device hookup or need as little as a few months to allow their brain to determine which sound might be best. However, some caution should be noted with this approach. One subject (E23b) still had mixed results after 3 months of listening experience; two subjects (E14b and Z48b), who had clear preferences at initial stimulation, ended up with no preference after 3 months of wearing use; and one subject (Z63b) switched her preference from favoring one strategy at initial stimulation to favoring another strategy after listening experience. Some individuals may take more time to determine which strategy is best, whereas other individuals may be able to make this decision at device hookup or just a few months beyond.
Perhaps most important is the idea of giving equal wearing time or allowing the brain to sort out which processing strategy might be best for each individual patient. For example, subject Z63b performed best with HiResolution processing at initial stimulation. However, by 1 month after implantation, Z63b scored better with CIS on both sentence recognition and sound-quality ratings; at 1.5 months, she wrote in her daily journal that she preferred CIS processing when in noisy environments. Had this subject not been provided with the opportunity to explore each strategy equally, she might not have had time to find her optimal map. We do recognize, however, that we compared only two strategies and that there might be yet an even better strategy for this subject. One advantage to hearing devices that provide more than one programming location is the ability to assess multiple programs at any given time.
For this study, we selected four different signal-processing strategies to compare: CIS versus HiResolution (Advanced Bionics) and ACE versus ACE (RE) (Cochlear Corporation). Many more programming options are available, and the ideal strategies for any given patient might not have been selected in this comparison. Interesting, however, is the fact that there were a few subjects who performed better and preferred a signal-processing strategy that is not currently marketed by its own manufacturer. Had only the newest and most marketable strategies been studied, maybe this preference would have been missed. We strongly recommend that audiologists remain flexible with their programming and consider programming parameters (that is, channel and rate) rather than trade names and marketed strategies.
Finally, there is still no clear relationship between speech perception and localization. In this study, there were at least two situations in which one strategy worked best for speech recognition and the other strategy worked best for localization. More research is needed to better understand the programming parameters that work best for each task.
CONCLUSIONS
In conclusion, we feel that this study has provided us with the following valuable observations:
Some individuals need more than 3 months to determine strategy preferences. How much time is needed to determine optimal preferences requires further research.
Some individuals can determine a strategy preference at device hookup. However, time is still needed to confirm this preference.
None of the subjects complained about switching programs daily. This technique may be a new useful clinical method that works well with others.
All but one subject was able to complete testing at initial stimulation. This practice may be a new useful clinical method that works well with others.
Audiologists must remain flexible with their programming and must consider programming parameters (that is, channel and rate) rather than trade names and marketed strategies.
Acknowledgments
This research was supported in part by research grant 5 P50 DC00242 from the National Institutes on Deafness and Other Communication Disorders, National Institutes of Health; grant M01-RR-59 from the National Center for Research Resources, General Clinical Research Centers Program, National Institutes of Health; the Lions Clubs International Foundation; and the Iowa Lions Foundation. We would like to thank Beth MacPherson for all of her hard work and dedication to collecting data for this project.
Abbreviations
- ACE
Advanced Combination Encoders
- ACE (RE)
High Advanced Combination Encoders
- CA
compressed analogue
- CIS
continuous interleaved strategy
- CUNY
City University of New York
- HiRes P
HiResolution Paired
- HiRes S
HiResolution Sequential
- P1
position 1
- P2
position 2
- PPS
pulses per second
- S/N
signal-to-noise ratio
- SRT
Spondee Recognition Test
APPENDIX A. DAILY SUBJECTIVE EVALUATIONS
Name: __________
Date: __________
Program Position: P1
Instructions
Please rate this program as best as you can according to your subjective impressions of the sound. Assign each category a number between 0 and 100, in which 0 is “very poor” and 100 is “excellent.” Please complete this scale at the end of your day before taking your processors off for the night.
| 1. | Speech understanding | __ (0–100) |
| 2. | Quality of sound | __ (0–100) |
| 3. | Understanding speech in quiet | __ (0–100) |
| 4. | Understanding speech in noise | __ (0–100) |
| 5. | Recognizing everyday sounds | __ (0–100) |
| 6. | Noise in program | __ (0–100) |
| 7. | Appreciation of music | __ (0–100) |
| 8. | Quality of my voice | __ (0–100) |
Comments:
_______________
_______________
_______________
_______________
_______________
_______________
_______________
References
- Boothroyd A, Hanin L, Hnath T. A Sentence Test of Speech Perception: Reliability, Set Equivalence, and Short-Term Learning. New York: Speech and Hearing Sciences Research Center, City University of New York; 1985 . [Google Scholar]
- Byrne D, Sinclair S, Noble W. Auditory localization for sensorineural hearing losses with good high-frequency hearing. Ear Hear. 1998;19:62–71. doi: 10.1097/00003446-199802000-00004. [DOI] [PubMed] [Google Scholar]
- Dorman MF, Loizou PC, Spahr AJ, Maloff E. A comparison of the speech understanding provided by acoustic models of fixed-channel and channel picking signal processors for cochlear implants. J Speech Lang Hear Res. 2002;45:783–788. doi: 10.1044/1092-4388(2002/063). [DOI] [PubMed] [Google Scholar]
- Dunn CC, Tyler RS, Witt SA. Benefit of wearing a hearing aid on the unimplanted ear in adult users of a cochlear implant. J Speech Lang Hear Res. 2005;48:668–680. doi: 10.1044/1092-4388(2005/046). [DOI] [PubMed] [Google Scholar]
- Dunn CC, Tyler RS, Witt SA, Gantz BJ. Effects of converting bilateral cochlear implant subjects to a strategy with increased rate and number of channels. Ann Otol Rhinol Laryngol. 2006;115:425–432. doi: 10.1177/000348940611500605. [DOI] [PubMed] [Google Scholar]
- Fu QJ, Nogaki G, Galvin JJ., III Auditory training with spectrally shifted speech: Implications for cochlear implant patient auditory rehabilitation. J Assoc Res Otolaryngol. 2005;6:180–189. doi: 10.1007/s10162-005-5061-6. [DOI] [PMC free article] [PubMed] [Google Scholar]
- Iverson P, Hazan V, Bannister K. Phonetic training with acoustic cue manipulations: A comparison of methods for teaching English/r/-/l/ to Japanese adults. J Acoust Soc Am. 2005;118:3267–3278. doi: 10.1121/1.2062307. [DOI] [PubMed] [Google Scholar]
- Kacelnik O, Nodal FR, Parsons CH, King AJ. Training-induced plasticity of auditory localization in adult mammals. PLoS Biol. 2006;4:627–638. doi: 10.1371/journal.pbio.0040071. [DOI] [PMC free article] [PubMed] [Google Scholar]
- Kompis M, Vischer MW, Hausler R. Performance of compressed analogue (CA) and continuous interleaved sampling (CIS) coding strategies for cochlear implants in quiet and noise. Acta Otolaryngol. 1999;119:659–664. doi: 10.1080/00016489950180595. [DOI] [PubMed] [Google Scholar]
- Parkinson AJ, Parkinson WS, Tyler RS, Lowder MW, Gantz BJ. Speech perception performance in experienced cochlear-implant patients receiving the SPEAK processing strategy in the Nucleus Spectra-22 cochlear implant. J Speech Lang Hear Res. 1998;41:1073–1087. doi: 10.1044/jslhr.4105.1073. [DOI] [PubMed] [Google Scholar]
- Psarros CE, Plant KL, Lee K, Decker JA, Whitford LA, Cowan RSC. Conversion from the SPEAK to the ACE strategy in children using the Nucleus 24 cochlear implant system: Speech perception and speech production outcomes. Ear Hear. 2002;23:18S–27S. doi: 10.1097/00003446-200202001-00003. [DOI] [PubMed] [Google Scholar]
- Rosen S, Faulkner A, Wilkinson L. Adaptation by normal listeners to upward spectral shifts of speech: Implications for cochlear implants. J Acoust Soc Am. 1999;106:3629–3636. doi: 10.1121/1.428215. [DOI] [PubMed] [Google Scholar]
- Spahr AJ, Dorman MF. Performance of subjects fit with the Advanced Bionics CII and Nucleus 3G cochlear implant devices. Arch Otolaryngol Head Neck Surg. 2004;130:624–628. doi: 10.1001/archotol.130.5.624. [DOI] [PubMed] [Google Scholar]
- Turner CW, Gantz BJ, Vidal C, Behrens A, Henry BA. Speech recognition in noise for cochlear implant listeners: Benefits of residual acoustic hearing. J Acoust Soc Am. 2004;115:1729–1735. doi: 10.1121/1.1687425. [DOI] [PubMed] [Google Scholar]
- Tyler RS, Fryauf-Bertschy H, Kelsay D. Children’s Vowel Perception Test. Iowa City, IA: University of Iowa; 1991. [Google Scholar]


