Abstract
The structure of galactoxylomannan, a capsular polysaccharide from the opportunistic yeast Cryptococcus neoformans, was reexamined by NMR spectroscopy and GC–MS. The residue that is 3-linked to the side chain galactose and was previously assigned as β-D-xylose [Vaishnav, V. V.; Bacon, B. E.; O'Neill, M.; Cherniak, R., Carbohydr. Res., 1998, 306, 315–330] was determined to be β-D-glucuronic acid. A revised structure for this polymer is presented, along with a proposal that this compound be termed glucuronoxylomannogalactan (GXMGal).
Keywords: Cryptococcus neoformans, GalXM, CPS, Glucuronic acid, Polysaccharides, structure
1. Introduction
Cryptococcus neoformans is an opportunistic fungal pathogen of humans and other mammals. This organism causes serious disease, including lung infections and fatal meningitis.1 It presents a substantial therapeutic challenge, especially in the developing world.1 The main virulence factor of C. neoformans is the carbohydrate capsule surrounding the cell. Strains of C. neoformans lacking this structure do not cause disease in animal models,2 suggesting that the mechanisms of capsule synthesis are potential drug targets.
The cryptococcal capsule consists of two polysaccharides. Most of the capsule mass is composed of a glucuronoxylomannan (GXM) of at least 1000 kDa. NMR-based studies of this polymer determined that it has an α-(1→3)-mannan backbone substituted with GlcA and Xyl.3 The remainder of the capsule is composed of a smaller polymer that has been termed galactoxylomannan (GalXM).
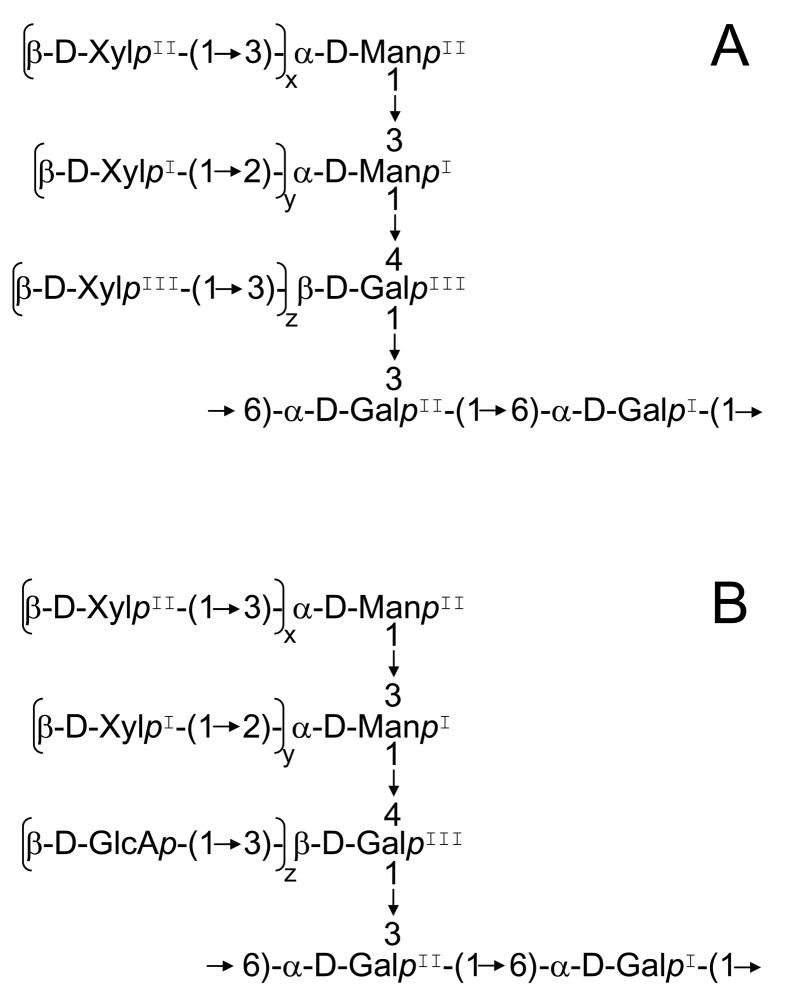
The NMR spectra of intact GalXM are highly complex due to the structure of this polysaccharide and the non-stoichiometric glycosylation of some of its residues. Despite these challenges, Cherniak and colleagues proposed a structure for this polysaccharide a decade ago.4 According to that report, GalXM is a 100 kDa polysaccharide, consisting of an α-(1→6)-galactan backbone with galactomannan side chains that are further substituted with variable numbers of xylose residues (Fig 1A). In this structure determination, the authors relied primarily upon degradation studies, using NMR to elucidate the structures of fragments from periodate oxidation and acetolysis. Xylose residues did not survive either of the depolymerization protocols and therefore were not observed in these experiments. An HMBC experiment on the intact polysaccharide confirmed the linkage of two xylose residues to mannose, but the identity of the substituent on O-3 of the side chain galactose (GalIII in Fig.1) could only be inferred by indirect evidence.
Figure 1.
Structure of GalXM. A: Previously published structure; B: Revised structure. Subscripts indicate the coefficient of substitution. Previously published data for the structure in panel A (4) indicate that these coefficients are between 0 and 1, but specific values were not provided. Values from our studies (5) for the revised structure are: wild type: x = 0.7, y = 1, z = 0.3; cxt1Δ: x and y < 0.02, z = 0.4 (ref. 5). Superscripts are included for easier reference.
In the course of studying C. neoformans capsule synthesis, we identified a β-(1→2)-xylosyltransferase (Cxt1p) and generated a mutant strain (cxt1 )devoid of this activity. The cxt1 strain produces GalXM that lacks both of the mannose-linked xylose residues.5 This change simplifies the NMR spectra and aids in their interpretation through comparison with spectra of the wild type polysaccharide. While performing such analyses, we discovered a discrepancy between our composition, linkage, and 2-D NMR data and the published GalXM structure. Here we propose a revised structure of this capsular polysaccharide.
2. Results and discussion
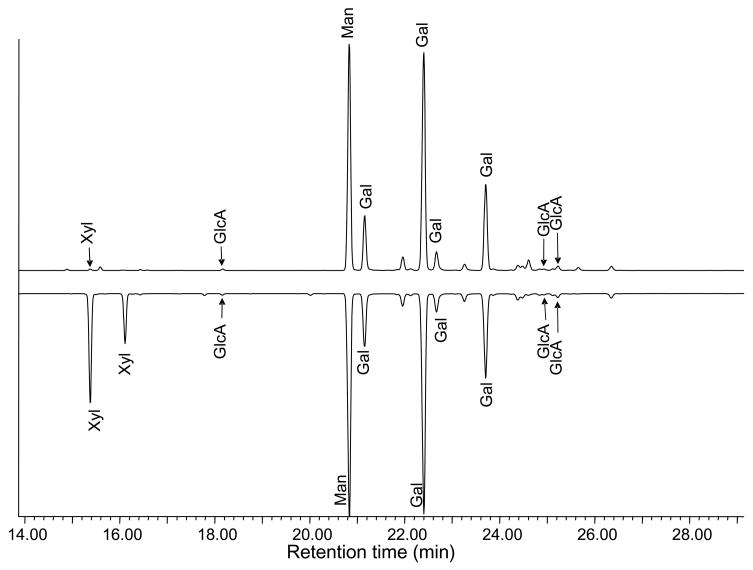
We initiated parallel structural analyses of GalXM isolated from cells with (wild type) and without (cxt1Δ) the gene encoding the xylosyltransferase Cxt1p. Monosaccharide composition analysis of GalXM by GC–MS of the per-O-TMS methyl glycoside derivatives showed the expected levels of xylose in the wild-type polysaccharide, but only traces of xylose in the polysaccharide from strains lacking Cxt1p activity (Fig. 2). Assuming that this xylose is part of the polymer, the amount found corresponds to a degree of substitution of less than 2%. Likewise, methylation analysis of wild type GalXM detected terminal xylose, but no terminal xylose was detected in mutant GalXM.5
Figure 2.
A comparison of the GC–MS profiles of TMS methyl glycosides of GalXM. Lower trace, wild type; upper trace, cxt1Δ.
Our composition and methylation analysis experiments indicated that the cxt1Δ mutation essentially abolished incorporation of xylose into the polymer. However, the ratio of 4-Gal to 3,4-Gal was the same in both wild type and mutant, indicating that a residue linked to O-3 of GalIII was still present in the mutant at wild type levels. The identification of this residue as xylose in the published structure raised the question of why we had not detected xylose in methylation analysis and why we had detected only a trace in the composition analysis of the mutant polysaccharide. We had previously attributed the lack of xylose in our GC–MS analysis to evaporation of the volatile partially permethylated xylitol acetate derivative,5 but our results from NMR spectroscopy have led us to reexamine this conclusion.
The COSY spectrum of wild type GalXM showed three H-1/H-2 cross peaks in the region where xylose might be expected, i.e. in the region between 4.7 and 4.4 ppm (H-1) and between 3.3 and 3.4 ppm (H-2). Although two separate complete spin systems consistent with xylose were identifiable, the third one appeared to be partially obscured by the first two (data not shown). Based on the published structure of GalXM, we had previously assumed all three of these residues to be xylose. 2-D NOESY demonstrated NOE contacts between H-1 of each of these residues and their linking sugars, providing us with the position of each residue on the GalXM side chain. Thus, XylI is linked to O-2 of ManI, XylII to O-3 of ManII, and the third residue to O-3 of GalIII.
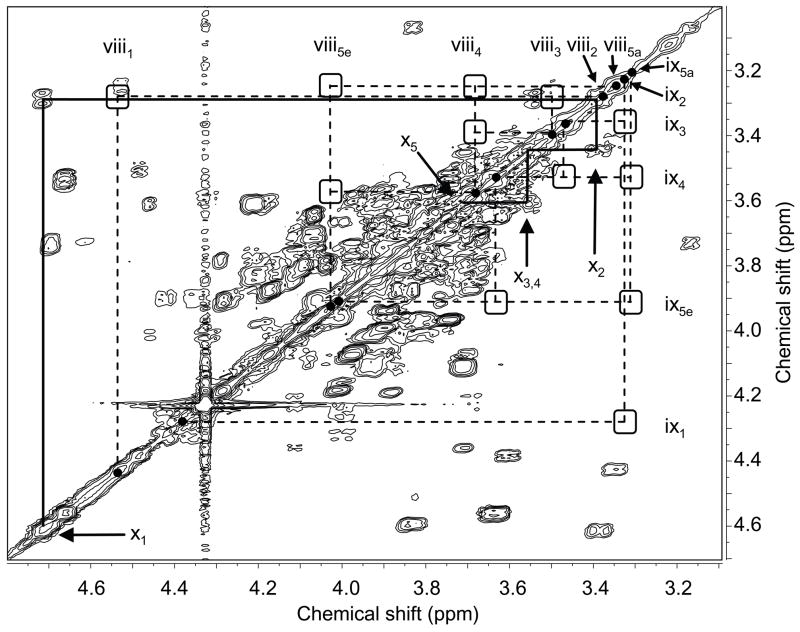
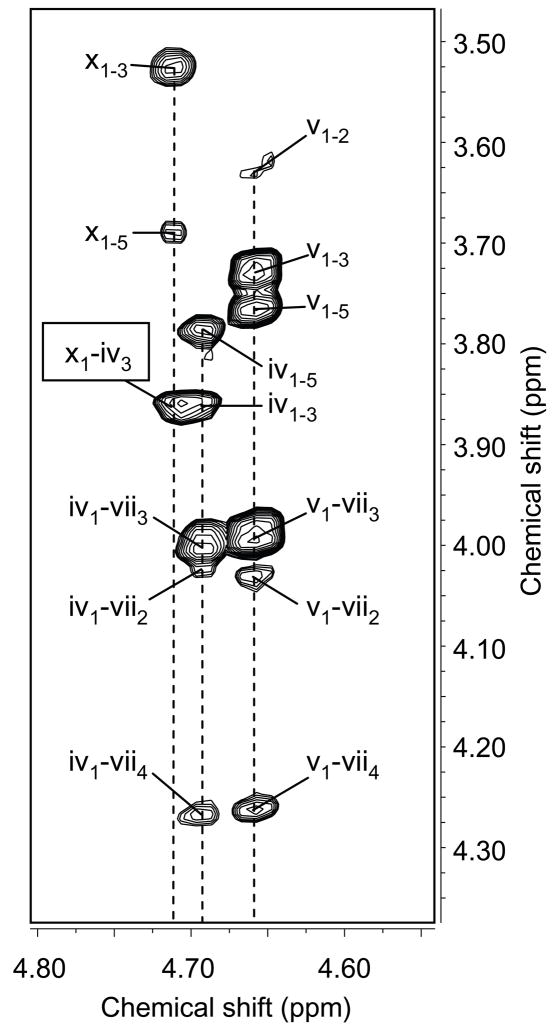
The COSY spectrum of mutant GalXM was missing the two xylose spin systems that had been completely assigned in the wild type, whereas the third residue, previously thought to be xylose, was still present. Figure 3 shows part of the COSY spectrum of mutant GalXM, marked to indicate the positions at which the xylose cross peaks are located in the wild-type spectrum. It is clear that the xylose spin systems are missing in the mutant; in particular the conspicuous absence of the cross peaks between H-4 and H-5 and between H-5a and H-5e proves that the sugar residue in question is not xylose. According to NOESY, this residue is linked to O-3 of GalIII (Fig. 4). The critical NOESY cross peak (x1-iv3) overlaps with the GalIII H-1/H-3 intraresidue cross peak (iv1–3). However, the increased linewidth and the center position of the resulting, combined cross peak, just between the two spin systems, indicate that it is made up of two overlapping signals.
Figure 3.
Partial gCOSY NMR spectrum of cxt1Δ. GalXM. The GlcA spin system is connected by solid lines. The positions of the xylose peaks from the wild-type spectrum are marked by empty squares (cross peaks) and filled circles (diagonal peaks) and are connected by broken lines. Lower case Roman numerals correspond to the entry number in Table 1. Abbreviations include: e, equatorial; a, axial. The data were acquired at a spectrometer frequency of 500 MHz.
Figure 4.
Partial NOESY NMR spectrum of cxt1Δ. GalXM, demonstrating the linkage between GlcA and O-3 of GalIII. Lower case Roman numerals correspond to the entry number in Table 1. The data were acquired at a spectrometer frequency of 600 MHz.
We did observe a weak COSY cross peak near the position of H-1 of one of the xylose residues (Fig. 3), which we previously attributed to a Man-linked xylose residue present in low levels in the mutant GalXM (~10% of wild type levels).5 However, the other resonances in this spin system are not consistent with that of xylose, suggesting that xylose is essentially absent in cxt1Δ GalXM. The coefficients given in Fig. 1 for Xyl reflect this new information.
Having concluded that the substituent on O-3 of GalIII was not xylose, we began to suspect that this residue might be glucuronic acid (GlcA). The chemical shifts of H-1, H-2, and H-3 of glucuronic acid are similar to those of xylose. Furthermore, H-3 and H-4 of GlcA have nearly identical chemical shifts, and H-5 of GlcA resonates at the same chemical shift as H-4 of xylose. Thus the GlcA spin system looks like that of xylose without the H-5 signals. We reasoned that if the residue were GlcA, then its chemical shifts should change with pD and the associated acid dissociation. To test our hypothesis, we acquired TOCSY spectra at two different pD values and discovered that the chemical shifts of the residue in question are indeed dependent on solution pD (Table 1). Furthermore, the carbon chemical shifts of this spin system, obtained from HSQC experiments of both wild-type and mutant GalXM, were also consistent with β-GlcA. (Table 1). Since carbonyl carbons are not seen by HSQC, and HMBC was not sensitive enough to detect C-6 of GlcA, we acquired a 100 000-scan, directly-detected carbon spectrum on wild type GalXM and found a weak signal at 176 ppm, further indicating the presence of a uronic acid (data not shown). The low intensity of this signal is accounted for by its carbonyl character and the non-stoichiometric presence of GlcA. Importantly, the proton chemical shift changes observed with varying pD agree with those published previously,6 demonstrating downfield movement upon protonation. A 1-D carbon spectrum to measure the chemical shift of the carboxyl carbon was only acquired at pD 7.4; the other GlcA carbon shifts are nearly the same at both pD values, although C-5 experiences a minor upfield shift upon protonation. This shift is opposite to the downfield movement of the proton chemical shifts, but such apparently counterintuitive behavior has been observed previously for carboxylic acids and amino acids,7 and has been explained by theory.8
Table 1.
Proton/carbon chemical shift assignment of wild type GalXM.a
| Entry | Residue | Chemical Shift (ppm)b | NOE | |||||||
|---|---|---|---|---|---|---|---|---|---|---|
| 1 | 2 | 3 | 4 | 5 | 6 | |||||
| i | →3)-α-ManpII | 1H | 5.22 | 4.25 | 4.03 | 3.81 | 4.04 | 3.69/3.74 | iii-3 | |
| 13C | 102.6 | 68.6 | 79.1 | 66.0 | 70.5 | 61.5 | ||||
| ii | α-ManpII | 1H | 5.16 | 4.07 | ND | ND | ND | ND | ||
| 13C | 103.1 | ND | ND | ND | ND | ND | ||||
| iii | →2,3)- α-ManpI | 1H | 4.99 | 4.12 | 4.07 | 3.87 | 4.08 | 3.86/3.84 | iv-4, v-4 | |
| 13C | 100.6 | 79.2 | 76.5 | 67.2 | 71.0 | 61.3 | ||||
| iv | →3,4)-β-GalpIII | 1H | 4.69 | 3.84 | 3.86 | 4.30 | 3.79 | 3.80/3.75 | vii-3,4 | |
| 13C | 105.1 | 71.6 | 81.5 | 76.8 | 74.2 | 62.0 | ||||
| v | →4)-β-GalpIII | 1H | 4.66 | 3.64 | 3.75 | 4.09 | 3.77 | 3.89/3.80 | vii-3,4 | |
| 13C | 105.4 | 72.3 | 73.1 | 78.4 | 75.8 | 62.0 | ||||
| vi | →6)- α-GalpI | 1H | 4.98 | 3.85 | 3.89 | 4.04 | 4.20 | 3.93/3.71 | vii-6 | |
| 13C | 99.2 | 69.3 | 70.5 | 70.5 | 69.8 | 67.6 | ||||
| vii | →3,6)- α-GalpII | 1H | 5.01 | 4.06 | 4.01 | 4.29 | 4.20 | 3.93/3.71 | vi-6 | |
| 13C | 99.1 | 68.3 | 80.9 | 70.1 | 69.8 | 67.6 | ||||
| viii | β-XylpII | 1H | 4.54 | 3.39 | 3.49 | 3.68 | 4.02/3.32 | i-2,3 | ||
| 13C | 101.9 | 73.9 | 76.6 | 70.1 | 66.1 | |||||
| ix | β-XylpI | 1H | 4.39 | 3.31 | 3.46 | 3.64 | 4.02/3.34 | iii-2 | ||
| 13C | 104.4 | 73.6 | 76.6 | 70.2 | 66.1 | |||||
| x | β-GlcAp | pD 4.6 | 1H | 4.75 | 3.39 | 3.56 | 3.56 | 3.87 | iv-3 | |
| pD 7.4 | 4.70 | 3.37 | 3.53 | 3.56 | 3.68 | |||||
| pD 4.6 | 13C | 105.1 | 74.0 | 76.4 | 72.7 | 75.7 | ND | |||
| pD 7.4 | 105.0 | 74.3 | 76.5 | 72.5 | 76.4 | 176.0 | ||||
All chemical shifts were the same (± 0.02 ppm for 1H and ± 0.2 ppm for 13C) at pD 4.6 and pD 7.4 except for those of the GlcA residue.
ND, not determined.
Our experiments at different pD supported our hypothesis that the GalIII substituent was GlcA. We next re-examined the gas chromatograms from monosaccharide composition analysis (Fig. 2) and detected a minor amount of GlcA in both wild type and mutant. Although the peaks were small, they were clearly identified as uronic acid peaks by their mass spectra. The spectrum of the signal at 18.17 min had an abundant ion at m/z 230 and the spectra of peaks at 24.93 and 25.23 min had significant ions at m/z 234; these masses are characteristic for uronic acids.9,10 The retention times and the relative peak intensities were also the same as those of a GlcA standard. The GlcA peaks appear small because the response factor of GlcA in GC–MS is low (0.38 or about 50% relative to those of the other sugars present), because of sub-stoichiometric substitution, and because the other sugars are beyond the linear range of the TMS composition analysis. We have previously observed overestimation of sugars present at high levels (unpublished results). Table 2 lists the experimentally determined compositions for both samples.
Table 2.
Monosaccharide composition analysis of wild-type and cxt1Δ. GalXM.
| Glycose | Mole % | |
|---|---|---|
| Wild type | cxt1Δ. | |
| Xylose | 21 | 0.30 |
| Glucuronic Acid | 1.5 | 2.0 |
| Mannose | 26 | 32 |
| Galactose | 51 | 63 |
| Glucose | 0.30 | 3.0 |
| Arabinose | 0.20 | 0.20 |
We noted that the mutant sample contained a significant amount of glucose, which derived most likely from a lower molecular weight contamination. It is likely that the signal in the NMR spectrum that was previously attributed to Man-linked Xyl (see above) arises from this contamination. According to the chemical shift of its C-1 (104.0 ppm), this glucose is not free. However, there are no cross peaks to this signal in NOESY, indicating that this glucose has an NOE correlation time distinct from that of GalXM and is therefore not part of that polysaccharide. We also noted trace arabinose in each of the samples, which we attribute to contamination.
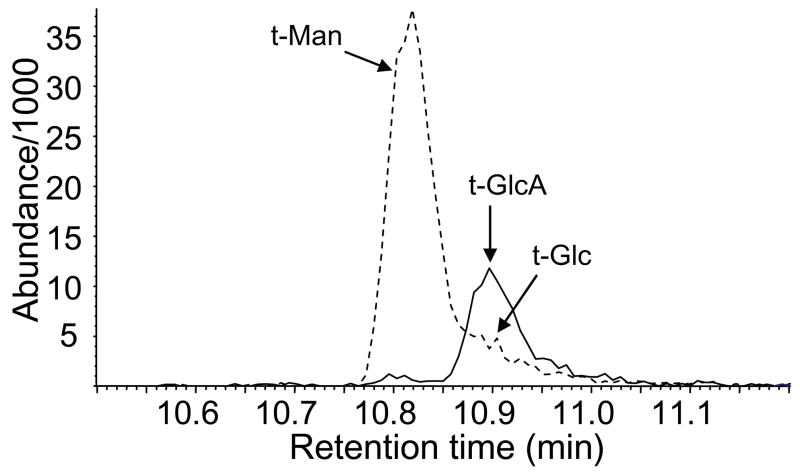
To further demonstrate the presence of GlcA in GalXM, we performed methylation analysis. GlcA is not detected in methylation analysis protocols using NaOH because the strongly basic conditions cause dehydration of GlcA by β-elimination, formation of a C-4–C-5 double bond, and further degradation. Although GlcA can be methylated without major degradation if dimsyl anion is used as base, it is necessary to reduce the carboxyl group of the resulting methyl ester to the alcohol; without reduction the ester would be hydrolyzed in the subsequent acid treatment, leading to a nonvolatile carboxylate. For these reasons we performed our analysis with Hakomori permethylation and prereduction of carboxyl groups. This study demonstrated the presence of (terminal) GlcA (Table 3). Prereduction of GlcA with Super-Deuteride® yields doubly 2H-labeled glucose; we detected this compound in GC–MS by extracting the ion at m/z = 207 (solid trace in Fig. 5); it was thus distinguished from contaminating Glc already present before prereduction, which has an ion at m/z = 205 (broken trace in Fig. 5). We did note that t-Xyl was low and 3-Man was high in the wild-type GalXM, which may indeed be due to evaporation of the volatile partially methylated xylitol acetate, but overall the results of the analysis are in excellent agreement with the structure proposed in Fig. 1B.
Table 3.
Methylation analysis with prereduction and Hakomori permethylation of GalXM.a
| Residue | Mole % | |
|---|---|---|
| Wild type | cxt1Δ | |
| t-Xyl | 3.6 | NF |
| t-Man | 5.8 | 14.6 |
| t-Glc | 1.0 | 1.9 |
| t-GlcA | 2.1 | 4.6 |
| t-Hexf | 3.0 | 2.2 |
| t-Gal | 1.6 | 1.3 |
| 3-Glc | NF | 0.5 |
| 4-Xyl | 0.9 | NF |
| 3-Man | 14.4 | 18.1 |
| 3-Gal | NF | 1.7 |
| 4-Man | 3.8 | 1.7 |
| 4-Gal | 10.0 | 9.8 |
| 6-Glc | 1.7 | 2.0 |
| 4-Glc | 3.5 | 1.2 |
| 2,3-Man | 14.0 | NF |
| 6-Gal | 14.0 | 17.8 |
| 3,4-Gal | 5.7 | 6.3 |
| 3,6-Glc | NF | 0.3 |
| 3,6-Man | NF | 0.2 |
| 4,6-Gal | NF | 0.3 |
| 3,6-Gal | 12.5 | 15.4 |
| 2,3,6-Man | 2.0 | NF |
| 2,3,6-Gal | 0.4 | NF |
NF, not found; Hexf, unidentified hexofuranose.
Figure 5.
Extracted ion chromatograms of the methylation analysis with Hakomori permethylation and prereduction. Solid line: m/z 207; broken line: m/z 205.
Finally, we performed GC–MS analysis of the TMS (R)-(−)-2-butyl glycosides (not shown). This further confirmed the presence of GlcA and revealed that it is in the D-form.
The question arises of why GlcA was not detected in the previous structure determination of GalXM. Monosaccharide composition in that work was obtained from GC of per-O-acetylated aldononitriles, a method that is unable to detect uronic acids without prior carboxyl reduction;11 this reduction was not performed.4 Likewise, methylation analysis detects GlcA only if performed with prereduction. It is therefore not surprising that this monosaccharide was not detected in the earlier study. For technical reasons mentioned above, the NMR identification of GlcA in this structural context is also challenging.
In conclusion, we propose that the residue that is (1→3)-linked to the side chain galactose of GalXM is β-D-glucuronic acid, instead of β-D-xylose as previously determined. We note that the presence of GlcA is consistent with early characterization of GalXM12 and a later compositional study using high pH anion-exchange chromatography,13 although not with the structure that has been generally accepted.4
We further propose that this polymer be renamed. The original designation of this material as ‘galactoxylomannnan’ was based on compositional analyses that indicated it contained galactose, xylose, and mannose. However, previous analysis has demonstrated that this polymer is a galactan, rather than a mannan,4 and we now show that it further includes GlcA. The structure shown in Fig. 1B is therefore a ‘glucuronoxylomannogalactan’, which could be abbreviated as GXMGal. This nomenclature accurately represents both the polymer composition and structure, and parallels the common terminology for the second capsule polysaccharide: glucuronoxylomannan abbreviated as GXM.
Our revision of structure explains the chromatographic properties of this polymer, namely its binding to anion-exchange resin.4,5 It also has significant implications for studies of capsule polysaccharide biosynthesis. For example, the previous structure implied the action of up to three xylosyltransferases in GalXM (GXMGal) synthesis; our revision indicates that one of the activities should instead be a glucuronosyltransferase. Our results, consistent with the earlier analysis of this polysaccharide, indicate that the side branches of the polymer are not completely substituted (see coefficients in Fig. 1 legend). Biosynthetic explanations for this heterogeneity could include incomplete sequential modification of a previously assembled core structure, polymer assembly from heterogeneous subunits, or a combination of processes. Additional studies of the GXMGal biosynthetic pathway that characterize its enzymatic features and identify any precursor units will be required to elucidate this question.
Cryptococcal polysaccharides differ dramatically from those of the mammals afflicted by this pathogen. Complete determination of these polysaccharide structures and their biosynthetic pathways will advance our understanding of basic biochemical functions and may bring us nearer to developing effective antifungal therapies.
3. Experimental
3.1 Strains
Like the cells used for the original analysis of GalXM structure,4 the strains used in this work are serotype D ‘Cap67’ strains. These cells do not produce GXM, simplifying purification and analysis of GalXM. For text clarity, we refer below to Cap67 strains with normal Cxt1p activity as wild type, and to Cap67 strains lacking the gene encoding Cxt1p as cxt1Δ.
3.2 Purification of GalXM
Growth of cells and isolation of GalXM were carried out as described previously.5 The final gel filtration step was of particular importance for obtaining high-quality samples for analysis.
3.3 Monosaccharide composition analysis
A 200-μg aliquot of GalXM was heated for 16 h in 1 M methanolic HCl at 80°C. The sample was then per-O-trimethylsilylated by treatment with Tri-Sil® (Pierce) at 80°C for 20 min. GC–MS analysis of the TMS methyl glycosides was performed on an Agilent 6890N gas chromatograph interfaced to a 5975B mass-selective detector, using an Alltech EC-1 fused silica capillary column (30 m × 0.25 mm ID).
3.4 Methylation analysis
A 600 μg aliquot of the GalXM sample was suspended in about 200 μL DMSO and magnetically stirred for 5 d. The sample was then permethylated by the method of Anumula and Taylor.14 NaOH (200 μL) were added and, after 10 min, 100 μL of CH3I were added, and the sample was stirred for 40 min. An additional 200 μL of base and 100 μL of CH3I were then added and stirring was continued for 40 min. The reaction was worked up by addition of 2 mL of H2O, removal of excess CH3I by sparging with N2, and CH2Cl2 extraction. The permethylated material was hydrolyzed using 2 M TFA (2 h in a sealed tube at 121°C), reduced with NaBD4, and acetylated using Ac2O/TFA. The resulting partially methylated alditol acetates (PMAAs) were analyzed on a Hewlett–Packard 5890 GC interfaced to a 5970 MSD (mass selective detector, electron-impact ionization mode); separation was performed on a 30-m Supelco 2330 bonded-phase fused-silica capillary column.
3.5 Methylation analysis with prereduction of carboxyl groups
For glycosyl linkage analysis, the sample was permethylated, reduced, repermethylated, depolymerized, reduced, and acetylated; and the resultant PMAAs were analyzed by GC–MS as described by York et al.15 First, an aliquot of the sample was suspended in about 200 μL of DMSO and placed on a magnetic stirrer for 5 d, at which time 0.6 mL of potassium dimsylate (3.6 M) was added to each sample. After 7 h of stirring at room temperature, the reaction mixture was cooled to 0°C, excess CH3I (0.7 mL) was added dropwise, and the tube was sealed. The incubation was then continued overnight at room temperature. After quenching the reaction with H2O, removing excess CH3I with N2, and extracting with CH2Cl2, the permethylated samples were reduced with 200 μL of 1.0 M Super Deuteride® in THF under an N2 atmosphere (105 min, 25 °C). The mixture was neutralized with 3 drops of glacial HOAc, dried under a stream of N2, taken up in 50% EtOH, and passed through an On-Guard H® column. After drying, the samples were re-methylated with NaOH and CH3I in DMSO and analyzed as described under subheading 3.4.
3.6 NMR spectroscopy
Samples were deuterium-exchanged by lyophilization from D2O and dissolved in 0.7 mL of D2O. Proton, carbon, gradient-enhanced COSY (gCOSY), TOCSY, NOESY, and HSQC NMR spectra were acquired on Varian Inova-500 MHz and 600 MHz spectrometers at 70 °C using standard Varian pulse sequences. Chemical shifts were measured relative to internal acetone (δH 2.225 ppm, δC 31.07 ppm). Mixing times were 100 ms for TOCSY and 300 ms for NOESY.
3.7 Determination of D- or L-forms
A sample (1 g) was hydrolyzed in 2 M TFA at 125 °C for 90 min. The water and acid were evaporated by a stream of nitrogen, and the nonvolatile residue was heated with (R)-(−)-2-BuOH and 15 μL of TFA at 125 °C for 18 h. TMS derivatization and GC–MS were performed as described above for monosaccharide analysis. D-GlcA was derivatized with (R)-(−)-2-BuOH and (S)-(+)-2-BuOH to provide reference standards.
Acknowledgments
Studies of capsule polysaccharides in the Doering lab are supported by NIH grant R01 GM71007 and in the Azadi lab by DOE grant DE-FG09-93ER-20097. We thank Steven Levery for helpful suggestions on the manuscript and T.L.D. thanks Robert Cherniak for encouragement.
Footnotes
Publisher's Disclaimer: This is a PDF file of an unedited manuscript that has been accepted for publication. As a service to our customers we are providing this early version of the manuscript. The manuscript will undergo copyediting, typesetting, and review of the resulting proof before it is published in its final citable form. Please note that during the production process errors may be discovered which could affect the content, and all legal disclaimers that apply to the journal pertain.
References
- 1.Chayakulkeeree M, Perfect JR. Infect Dis Clin North Am. 2006;20:507–544. doi: 10.1016/j.idc.2006.07.001. [DOI] [PubMed] [Google Scholar]
- 2.Kwon-Chung KJ, Rhodes JC. Infect Immun. 1986;51:218–223. doi: 10.1128/iai.51.1.218-223.1986. [DOI] [PMC free article] [PubMed] [Google Scholar]
- 3.Cherniak R, Valafar H, Morris LC, Valafar F. Clin Diagn Lab Immunol. 1998;5:146–159. doi: 10.1128/cdli.5.2.146-159.1998. [DOI] [PMC free article] [PubMed] [Google Scholar]
- 4.Vaishnav VV, Bacon BE, O'Neill M, Cherniak R. Carbohydr Res. 1998;306:315–330. doi: 10.1016/s0008-6215(97)10058-1. [DOI] [PubMed] [Google Scholar]
- 5.Klutts JS, Doering TL. J Biol Chem. 2008;283:14327–14234. doi: 10.1074/jbc.M708927200. [DOI] [PMC free article] [PubMed] [Google Scholar]
- 6.Lahaye M, Ray B. Carbohydr Res. 1996;283:161–173. doi: 10.1016/0008-6215(95)00407-6. [DOI] [PubMed] [Google Scholar]
- 7.Horsley WJ, Sternlicht H. J Am Chem Soc. 1968;90:3738–3748. doi: 10.1021/ja01016a025. [DOI] [PubMed] [Google Scholar]
- 8.Batchelor JG, Feeney J, Roberts GCK. J Magn Res. 1975;20:9–38. [Google Scholar]
- 9.Kennedy JF, Robertson SM. Carbohydr Res. 1978;67:1–15. [Google Scholar]
- 10.Petrzika M, Linow F. Eur J Mass Spectrom Biochem, Med Environ Res. 1982;2:53–61. [Google Scholar]
- 11.Seymour FR. Methods Carbohydr Chem. 1993;9:59–85. [Google Scholar]
- 12.Cherniak R, Reiss E, Turner SH. Carbohydr Res. 1982;103:239–250. [Google Scholar]
- 13.Corradini C, Canali G, Cavazza A, Delfino D, Teti G. J Liq Chrom Rel Technol. 1998;21:941–951. [Google Scholar]
- 14.Anumula KR, Taylor PB. Anal Biochem. 1992;203:101–108. doi: 10.1016/0003-2697(92)90048-c. [DOI] [PubMed] [Google Scholar]
- 15.York WS, Darvill AG, McNeil M, Stevenson TT, Albersheim P. Methods Enzymol. 1985;118:3–40. [Google Scholar]


