Abstract
In this paper, we describe a 250 GHz gyrotron oscillator, a critical component of an integrated system for magic angle spinning (MAS) dynamic nuclear polarization (DNP) experiments at 9T, corresponding to 380 MHz 1H frequency. The 250 GHz gyrotron is the first gyro-device designed with the goal of seamless integration with an NMR spectrometer for routine DNP-enhanced NMR spectroscopy and has operated under computer control for periods of up to 21 days with a 100% duty cycle. Following a brief historical review of the field, we present studies of the membrane protein bacteriorhodopsin (bR) using DNP-enhanced multidimensional NMR. These results include assignment of active site resonances in [U-13C,15N]-bR and demonstrate the utility of DNP for studies of membrane proteins. Next, we review the theory of gyro-devices from quantum mechanical and classical viewpoints and discuss the unique considerations that apply to gyrotron oscillators designed for DNP experiments. We then characterize the operation of the 250 GHz gyrotron in detail, including its long-term stability and controllability. We have measured the spectral purity of the gyrotron emission using both homodyne and heterodyne techniques. Radiation intensity patterns from the corrugated waveguide that delivers power to the NMR probe were measured using two new techniques to confirm pure mode content: a thermometric approach based on the temperature-dependent color of liquid crystalline media applied to a substrate and imaging with a pyroelectric camera. We next present a detailed study of the mode excitation characteristics of the gyrotron. Exploration of the operating characteristics of several fundamental modes reveals broadband continuous frequency tuning of up to 1.8 GHz as a function of the magnetic field alone, a feature that may be exploited in future tunable gyrotron designs. Oscillation of the 250 GHz gyrotron at the second harmonic of cyclotron resonance begins at extremely low beam currents (as low 12 mA) at frequencies between 320–365 GHz, suggesting an efficient route for the generation of even higher frequency radiation. The low starting currents were attributed to an elevated cavity Q, which is confirmed by cavity thermal load measurements. We conclude with an appendix containing a detailed description of the control system that safely automates all aspects of the gyrotron operation.
1. Introduction
Due to the excellent resolution of nuclear magnetic resonance (NMR) spectra, NMR has evolved as the preferred spectroscopic approach for the solution of problems in many areas of science, including physics, chemistry, biology, materials science, and more recently medicine. The excellent resolution is a consequence of long nuclear relaxation times that are in turn due to the small magnetic moments of the nuclear spins that couple weakly to the surrounding lattice. However, a deleterious effect of the small size of these magnetic moments is that the sensitivity of NMR experiments is low when compared to other spectroscopic approaches. Furthermore, since both high resolution solid state and solution NMR are utilized with increasing frequency in structural studies of macromolecular biological systems – proteins, nucleic acids, etc. – sensitivity continues to be an issue of paramount importance in the successful application of the technique.
Approaches to improving the sensitivity of NMR experiments have followed two avenues: innovations in instrumentation and developments in spectroscopic methodology. Outstanding examples of the former date from as early as the 1960’s, when the appearance of laboratory computers enabled the implementation of Fourier transform NMR techniques resulting in signal-to-noise increases of 10–100 [1]. More recently, the development of superconducting magnets that operate at increasingly higher fields has significantly improved sensitivity, since the signal-to-noise per unit time scales as ~ω03. Finally, in the last few years, cryogenically cooled probes with higher Q’s in the r.f. coil and lower noise figures in the detection r.f. preamplifiers have become routinely available, improving the sensitivity by a factor of 1.5–3 depending on the conductivity of the sample [2].
Examples of innovations in spectroscopic methodology that have improved sensitivity are also numerous. Some of the most successful approaches involve polarization transfer techniques, including cross polarization (CP) in solids [3, 4] and INEPT transfers [5] in solution, in which the polarization of a spin with a large magnetic moment is transferred to one with a smaller moment. Today, CP is an integral part of high resolution magic angle spinning (MAS) experiments in solids [6] and multiple INEPT transfers are present in essentially every biological solution NMR experiment [7]. In these approaches, the sensitivity is enhanced by a factor of (γI/γS) or about 4 for I=1H and S=13C and 10 when S=15N. Another, and in fact the original, example of a polarization transfer experiment was proposed by Overhauser [8] and involved transfer of conduction electron polarization to nuclear spins in metals. Carver and Slichter [9, 10] verified Overhauser’s hypothesis that such transfers and signal enhancements were possible with low field (3.03 mT) experiments performed on samples of Li metal and other materials with mobile electrons. During the 1970’s, the analogous nuclear Overhauser effect (NOE) was used extensively to increase sensitivity in spectra of low-γ species, and it is currently employed to estimate internuclear distances for structure determination by solution state NMR.
Extension of electron-nuclear and other high polarization transfer experiments involving noble gases, para-hydrogen, semiconductors, or photosynthetic reaction centers [11–23] to contemporary solid state and solution experiments is very appealing, since it could significantly enhance the sensitivity in a variety of NMR experiments. In particular, the theoretical enhancement for electron-nuclear polarization transfers is approximately ~(γe/γI), where now the ratio is ~660, because of the large magnetic moment of the electron relative to the 1H, making the gains in sensitivity large. Accordingly, during the 1960’s and 1970’s, there were extensive efforts to perform electron-nuclear polarization transfer in liquids [24, 25] and solids [26, 27]. All of these experiments, collectively known as dynamic nuclear polarization (DNP), require that the electron paramagnetic resonance (EPR) spectrum be irradiated with microwaves that drive the exchange of polarization between the electrons and the nuclear spins. In the case of liquids, these are Overhauser effect transitions and, in solids, other mechanisms – the solid effect (SE), thermal mixing (TM) or the cross effect (CE) – dominate the polarization transfer process. Since DNP experiments require irradiation of the EPR spectrum, they were confined to relatively low magnetic fields because of the paucity of high frequency microwave sources. In particular, the microwave sources used in both the liquid and solid state experiments were klystrons that operate at ≥ 40 GHz, constraining DNP-MAS experiments to ≥ 60 MHz 1H frequencies. Thus, for DNP to be applicable to the higher fields employed in contemporary NMR experiments, new instrumental approaches to producing microwaves were required.
To satisfy these requirements, we turned to gyrotrons, a type of cyclotron resonance maser, as microwave sources for DNP experiments [28–30]. This choice was motivated by the fact that gyrotrons are fast wave devices [31], with interaction structures whose dimensions are large compared to the operating wavelength, and as such are capable of generating high powers (10–100 watts CW) for the extended periods typical of multidimensional NMR experiments. Because the gyrotron interaction involves a resonance between the r.f. modes of an electromagnetic cavity and an axial magnetic field, the gyrotron frequency is in principle limited only by the available magnetic field strength. Furthermore, the cavity can be much larger than the operating wavelength, so the power density does not increase with the gyrofrequency, resulting in long lifetimes and high reliability. We anticipate that gyrotrons will be useful to at least the 1GHz 1H NMR frequency regime (~660 GHz for electrons) or higher. For example, a gyrotron was recently operated in pulsed mode at a frequency of a 1.03 THz [32].
In order to demonstrate the feasibility of employing gyrotrons in DNP experiments, we initially constructed a 140 GHz gyrotron oscillator that operates with a 211 MHz (1H) NMR spectrometer [30, 33]. This system permitted us to demonstrate DNP at 5T fields and to explore many important features of the experiments. For example, we established that cross effect DNP using biradical polarizing agents is the optimal mechanism [34–41] for high field experiments involving CW microwave radiation. Traditional approaches, based on the solid effect and thermal mixing, yield enhancements that are an order of magnitude smaller [38] or require high concentrations of polarizing agents that lead to significant electron-nuclear dipolar broadening [42]. In addition, the 140 GHz system permitted us to develop and refine a number of experimental techniques, for example MAS at 90 K and lower temperatures [42, 43]. Finally, over the last few years, research with the 140 GHz system led to increases in DNP enhancements in MAS experiments from ~10 to ~300 [28, 35]. However, it remains that this spectrometer is operating at a 5 T field, and as such is a low frequency instrument by present day NMR standards.
In order to move DNP experiments to higher fields, we have built two additional gyrotron oscillators operating at 250 and 460 GHz, corresponding to 380 and 700 MHz for 1H NMR, respectively. A cursory description of the 250 GHz oscillator appeared elsewhere [44] and the design and initial operation of the 460 GHz oscillator is described in detail in other publications [45–48]. However, since the appearance of the brief description of the 250 GHz gyrotron, we have implemented many important changes to the system. In this paper we characterize the operation of the 250 GHz gyrotron oscillator with detailed measurements of several important operating parameters. We have introduced two novel methods for imaging the millimeter wave beam and quantitatively determining its spectral purity. We have also demonstrated for the first time that the operating parameters of a gyrotron can be regulated under feedback control for indefinite and stable operation. In particular, this is the first gyrotron for DNP that operates continuously (in true CW mode), and we have achieved uninterrupted and regulated CW operation for a period of 21 days, a record for any gyrotron operating in this frequency regime. In addition, we have integrated the device into a low temperature solid state NMR spectrometer so that it now routinely performs multidimensional solid state NMR experiments on biological systems. Thus, the two primary goals of this paper are (1) to provide a detailed description of this new instrumentation for enhancing sensitivity in solid state NMR experiments and (2) to provide illustrative examples of the scientific possibilities afforded by the enhanced sensitivity available with this equipment. For the latter we present in this paper DNP enhanced MAS spectra of bacteriorhodopsin (bR), a 26.6 kD membrane protein embedded in a lipid bilayer. This is a more challenging test case for the DNP method than small model compounds such as urea or proline that we have used extensively in other papers demonstrating DNP [36, 49, 50]. It is also a biologically important system that poses outstanding scientific questions and therefore addresses the applicability of DNP experiments to interesting systems.
An additional important aim is to familiarize members of the magnetic resonance community with high field DNP instrumentation. In particular, while gyrotrons are well known in the microwave community, they are virtually unknown in the magnetic resonance community. Thus, the contents of this paper will serve to familiarize NMR and EPR community with the rudiments of gyrotron technology and facilitate propagation of the instrumentation to other laboratories.
In Section 2 of the paper, we present DNP enhanced MAS NMR spectra of the membrane protein bacteriorhodopsin (bR) to demonstrate what is currently achievable with high frequency DNP experiments. These spectra include the first multidimensional spectra of a biological system acquired with DNP, and illustrate that it is possible to acquire spectra that are simply not accessible in the absence of DNP. Section 3 contains a brief discussion of the r.f. and microwave components of the 250 GHz/380 MHz DNP NMR spectrometer. This includes the millimeter wave transmission line, low temperature MAS probe, and required cryogenics, although we defer complete descriptions of these three components to other manuscripts. Section 4 provides a detailed description of eleven major components of the 250 GHz gyrotron and their function including a discussion of the theory of the operation of gyrotron oscillators. Section 5 contains data on the operation of the gyrotron, including power output as a function of beam current, spectral purity and quality, frequency tuning as a function of the magnetic field, and frequency and power output stability as a function of several parameters. We also characterize the mode content in the millimeter-wave transmission line through measurements of the radiated intensity pattern by liquid crystal thermometry and pyroelectric camera technology. Finally, in Section 6 we consider the possibility of second harmonic operation in which the gyrotron frequency is double that of the fundamental frequency in the same magnetic field. This is a feature of the 460 GHz system mentioned above since operation at the second harmonic generation will reduce the cost of the magnet associated with future high frequency gyrotrons.
2. DNP Experiments on the Membrane Protein Bacteriorhodopsin
Two research areas in which high resolution MAS experiments have proved especially successful are studies of amyloid fibrils [37, 51–57] and membrane proteins [42, 58–75]. However, in both of these cases, low sensitivity currently limits the information that can be gleaned from the spectra. Accordingly, we recently demonstrated the use of DNP to enhance signal intensities in MAS spectra of amyloidiogenic nanocrystals [37] and we are currently utilizing DNP to improve the sensitivity of MAS spectra of the membrane protein bacteriorhodopsin (bR) [42, 76, 77]. In order to motivate the reader’s interest in DNP, we devote this section to illustrating some of the scientific experiments that are possible with the increased sensitivity that is currently available, and the applicability of the DNP technique to scientific questions involving membrane proteins.
Bacteriorhodopsin is a 248-residue integral membrane protein that functions as a light-driven ion pump. The protein encapsulates an all-trans, 6-s-trans retinylidene chromophore attached to the protein via a Schiff base linkage to Lys216 as illustrated in Figure 1.
Figure 1.

Nomenclature of 13C sites of the retinal chromophore and the Lys 216 side chain to which it is covalently attached. The arrow indicates that during the bR photocycle there is isomerization about the C13–C14 bond. In light-adapted bR the retinal is in an all-trans conformation and the Schiff base nitrogen is protonated, whereas in dark adapted bR, three retinal conformations are present as shown by the DNP enhanced spectra in Figure 2 (vide infra).
The photoisomerization of the chromophore about the C13–C14 double bond initiates a vectorial proton transport process involving several discrete photocycle intermediates as depicted in Figure 2. A knowledge of the precise structure of the active site (i.e., the chromophore and the nearby amino acid sidechains) in these intermediates could lead to a detailed understanding of the mechanism of proton translocation. Thus, the goal of the DNP enhanced MAS experiments is to provide the structures of these photocycle intermediates.
Figure 2.
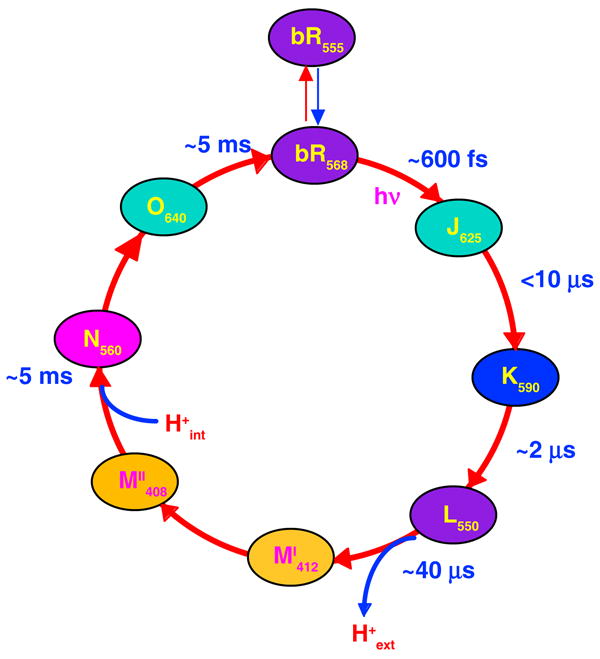
Intermediates in the bR photocycle. Deprotonation of the Schiff base occurs in the L to M transition, a switch in the accessibility of the Schiff base from the cytoplasmic to the extracellular side of the protein occurs between the early and late M states, and reprotonation of the Schiff base occurs in the M to N transition. The subscripts reflect the absorption maxima of the photocycle intermediates and the times indicate the approximate lifetimes of the states.
In order to study a particular photocycle intermediate, the sample is irradiated with the optimal wavelength of light while at a temperature low enough to inhibit its decay. The sample is then cooled further to ~90 K where the attenuated electronic and nuclear spin–lattice relaxation renders the polarization transfer more efficient. Information about the sample preparation and conditions used to generate and trap specific photocycle intermediates is provided elsewhere [62, 76, 78–81]. Briefly, we employ sapphire rotors since they attenuate microwaves less than ZrO2. However, sapphire is less robust that ZrO2 and this limits the spinning frequency to < 12 kHz. Subsequently, one of a variety of dipolar recoupling experiments is performed using DNP to enhance the sensitivity. At present we are observing enhancements of ~40 in the 1H polarization at 250 GHz/380 MHz, a number that is probably limited by the penetration of the microwaves into the sample [35] and the 1H concentration. Subsequently, this enhanced polarization is transferred to 13C or 15N for observation. Detection is via the low-γ spin since this avoids the residual 1H signal that is present in essentially all solid state probes.
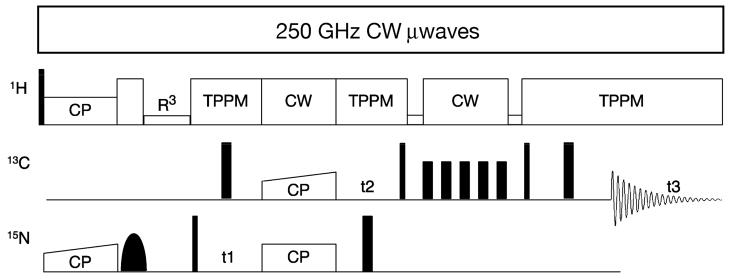
Typical pulse sequences for DNP enhanced MAS experiments are described in several papers [29, 43, 49, 50] and the sequence used to acquire the multidimensional spectra presented here is illustrated in Figure 3.
Figure 3.
Pulse sequence for a 2D 15N-13C-13C heteronuclear correlation experiment incorporating DNP. The EPR spectrum is continuously irradiated with 4–5 watts of microwave power yielding a steady state enhanced 1H polarization that is replenished during the recycle delay of the NMR experiment. Following 1H-15N cross-polarization, magnetization is labeled with the 15N chemical shift and then transferred to the 13C spins using band-selective 15N-13C cross polarization. Further homonuclear mixing is accomplished with a dipolar recoupling sequence such as RFDR or by proton-driven spin diffusion in the presence of an R3 recoupling field (DARR/RAD) [82–85]
Presently, all of our DNP experiments involve either pre- or continuous microwave irradiation, with the microwave frequency and/or magnetic field position in the EPR spectrum chosen to optimize the transfer of electron polarization to the 1H spins. In the 140 GHz system mentioned above and the 250 GHz system considered here, the optimization is accomplished with a superconducting sweep coil, but in the future tunable gyrotrons [86] will likely become available. In the case of the 140 GHz/211 MHz system described previously, we generally employ long (~15–30 s) microwave pulses since the vacuum pumping efficiency in that system is insufficient for true CW operation [30, 33] and the 1H polarization appears in 3–5 T1’s [34, 37]. In contrast, the 250 GHz gyrotron operates in true CW mode and we apply between 4.0 and 4.5 watts of microwave power continuously to maintain a steady state 1H polarization. As illustrated in Figure 3, the enhanced 1H polarization is transferred to the 13C, 15N, etc. spin reservoirs via cross polarization. We note that it is also possible to polarize the low-γ spins directly [27, 28, 87], but, because of the smaller magnetic moment, the transfer process is slower and the slower spin diffusion among the low-γ nuclei limits the sphere of polarized nuclei to the vicinity of the paramagnetic center. Nevertheless, direct polarization of low γ spins presents interesting scientific opportunities that have not yet been fully exploited.
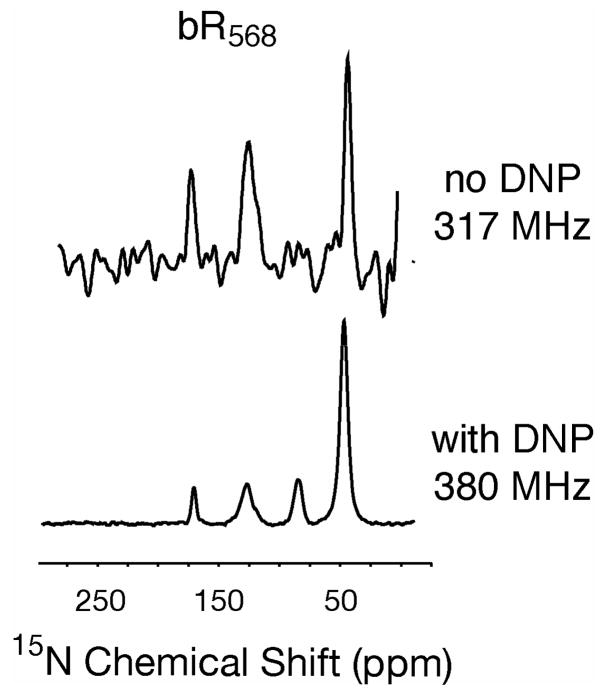
Some typical DNP enhanced spectra of bR are shown in Figures 4, 5 and 6 and illustrate the dramatic effect that the increased signal-to-noise has on our ability to address scientific questions. In Figure 4 we show 1D 15N spectra of ζ-15N-Lysine-bR in the light adapted bR568 state that illustrate that DNP results in dramatically improved signal-to-noise and reduced acquisition times, even with smaller sample quantities. As discussed elsewhere [58, 76, 88] the chemical shift of the Schiff base is extremely sensitive to its local electrostatic environment, and therefore 1D spectra of a ζ-15N-Lysine-labelled bR sample allow unambiguous assignment of many photocycle intermediates shown in Figure 2, even where multiple intermediates co-exist. In the top trace we show the spectrum acquired at 200 K on a 317 MHz spectrometer without DNP using 160 μl of sample in a 5 mm rotor. The spectrum acquired, even after extended data acquisition (10,000 scans, 3.5 days), illustrates the acute signal-to-noise problem that is present in NMR studies of membrane (and amyloid) proteins and why most of these experiments have been limited to 1D spectroscopy. In contrast, the lower spectrum was acquired at 90 K in a much shorter time period (384 scans, 30 minutes) from a 40 μl sample and displays excellent signal-to-noise, suggestive of the possibility of multidimensional spectroscopy which can be exploited for measurement of conformational parameters. The assignment of the lines in these spectra is discussed in the figure caption. The signal-to-noise enhancement for this spectrum due to microwave irradiation is ~40 when compared to the spectrum obtained at 90 K without microwaves. However, since it was acquired at 90 K (as opposed to 200 K), the total enhancement, which we define as ε, compared to the 317 MHz spectrum must also account for the increased polarization due to the Boltzmann factor [35]. Thus, ε =(200/90)×40 ≈ 90 as compared to the spectrum acquired on the 317 MHz spectrometer. This large signal enhancement permits us to record multidimensional spectra with good signal-to noise in reasonable acquisition periods.
Figure 4.
One dimensional 1H decoupled 15N MAS spectra of light adapted ζ-15N-Lys-bR. Top: Spectrum acquired on a 317 MHz spectrometer using a 5 mm ZrO2 rotor with a 160 μl sample volume, 10,000 scans, 3.5 days (~5000 min) of data acquisition, T=200K Bottom: Spectrum acquired with DNP -- 250 GHz microwave irradiation using a 4 mm sapphire rotor, 40 μl, T=90K, 384 scans, 30 minutes of data acquisition. The assignment of the lines in the spectra (left to right) are: 165 ppm --protonated Schiff base 15N; 130 ppm – natural abundance amide backbone; 80 ppm – natural abundance guanidine-HCl (only present in the 380 MHz spectrum); 50 ppm – six free ζ-15N-Lys signals in bR. ωr/2π ~ 7 kHz.
Figure 5.
Schiff base region of 2D Lys-Nζ-Ret.-C15-CX correlation spectrum of [U-13C, 15N]-bR in the light adapted state (bR568). Multiple chemical shift assignments result from a single experiment. ωr/2π ~ 7 kHz.
Figure 6.
(left) 1D spectra of ζ-15N-Lys-bR in the dark adapted state (a mixture of bR555 and bR568) with Schiff base region shown in the inset. (right) 2D Lys-Nζ-Ret.-C15-CX correlation spectrum obtained from [U-13C, 15N]-bR in the dark adapted state. Note the presence of multiple conformers of bR555 that are not visible in the 1D spectra and partial resolution of the J-doublet in C15 of bR568. The acquisition time for the 2D spectrum was 2.75 hours. ωr/2π ~ 7 kHz.
Figure 5 is an illustration of one of the initial 2D 15N-13C spectra obtained with the pulse sequence illustrated in Figure 3. Because the 15N Schiff base signal is well separated from the remainder of the 15N signals in the spectrum of the protein, it is possible to selectively excite this resonance with a Gaussian pulse as it illustrated in Figure 3 and to subsequently transfer that magnetization to 13C’s in the retinal and lysine sidechain. Thus, following 1H-15N cross-polarization, magnetization is labeled with the 15N chemical shift and then transferred to the 13C spins using band-selective 15N-13C cross polarization. Subsequent homonuclear mixing is accomplished with a dipolar recoupling sequence such as RFDR or by proton-driven spin diffusion in the presence of an R3 recoupling field (DARR/RAD) [84, 89]. This procedure yields the spectrum shown in Figure 5 where we observe cross peaks between the 15N Schiff base and C-15, C-14, C-13 and the methyl at C-20 on the retinal. By changing the offset frequency in the 15N-13C step we can transfer magnetization to the K216-Cε and K216-Cδ. The spectrum in Figure 5 was recorded in approximately 12 hours and permits us to assign all of the retinal resonances in a single experiment. This would not have been possible without the factor of ~90 signal enhancement over our previous experiments mentioned above. As illustrated Figure 2, bR undergoes a photocycle in response to the absorption of light and we are currently studying the spectra of the K, L and M intermediates with the goal of determining their structure, results that will be described in detail elsewhere [76, 77].
A more complex spectrum unfolds in studying dark-adapted bR, which is comprised of a mixture of bR568and bR555. Initially we reported [58] the 1D 15N spectrum of the bR555/bR568 mixture such as is shown in Figure 6 (left) and assigned the Schiff base line at 172 and 165 ppm to bR555 and bR568 respectively, based on their ~60:40 intensity ratio and the disappearance of the downfield signal on light adaptation. However, the 2D 15N-13C spectrum that can be acquired with DNP (Figure 6, right) clearly reveals a more complicated mixture, with two cross peaks in a ~2:1 intensity ratio associated with the bR555 component. Our current interpretation of these results is that at 90 K we are quenching protein conformational equilibria that lead to dynamically averaged spectra and single lines in 1D and room temperature spectra of bR555. The improved signal-to-noise available with DNP permits observation of these conformations as additional cross peaks in 2D 13C-15N spectra. It is possible that this heterogeneity is also related to that seen in the kinetics of retinal binding to opsin in regeneration experiments [90]. There is also a splitting in the bR568 cross peak that may be due to heterogeneity, but it is also possible to interpret this as a 13C-13C J-coupling. In the K and L photocycle intermediates we also observe conformational heterogeneity and show that is results from multiple substates [77].
In summary, the DNP enhanced MAS bR spectra presented here illustrate signal enhancements ε ~90 over spectra that we have published previously. This increase in sensitivity permits us to obtain high quality 2D spectra of bR in a routine manner and to address interesting scientific issues such as the heterogeneity of the bR lattice and the structure of photocycle intermediates. Finally, we emphasize that the spectra offer convincing evidence that cross effect DNP experiments using biradical polarizing agents provide significant enhancements in experiments involving a real membrane protein rather than a small molecule, model system.
3. DNP/NMR Spectrometer
The 250 GHz/380 MHz DNP/NMR spectrometer is a marriage of millimeter wave components with components of a standard NMR spectrometer. This NMR components include a conventional triple resonance NMR console and a triple resonance transmission line probe based on the design of McKay and Schaefer [91, 92] with an important exception discussed below. The console is produced by Cambridge Instruments and was designed by Dr. D.J. Ruben. The microwave section is composed of the gyrotron oscillator operating in a 9 T superconducting magnet, a corrugated waveguide that efficiently delivers the microwave power from the gyrotron to the probe (the measured loss at 250 GHz is ~0.8 dB or ~1.2 %), and a directional coupler for sampling the forward and reverse power. Finally, the NMR probe uses an air dielectric transmission line and the inner conductor of the line serves as a corrugated waveguide that ultimately transmits the microwaves to the sample. The DNP enhanced NMR experiment is performed in a second 9 T NMR magnet, located 2.4 m from the gyrotron magnet to minimize the overlap of the two fringe fields. The MAS probe operates at 90 K for the duration of the experiment, and has operated continuously for a period of 30 days. We note that DNP experiments are also possible at higher temperatures. For example, prior to our high frequency experiments, Wind and Schaefer and coworkers reported enhancements of ε ~25 for BDPA dispersed in polystyrene, and we reported an ε~10 in the same system at 140 GHz. Both experiments were performed at ~300 K. Thus, ambient temperature DNP is possible but the enhancements are significantly smaller when compared to what can be achieved at 90 K or lower.
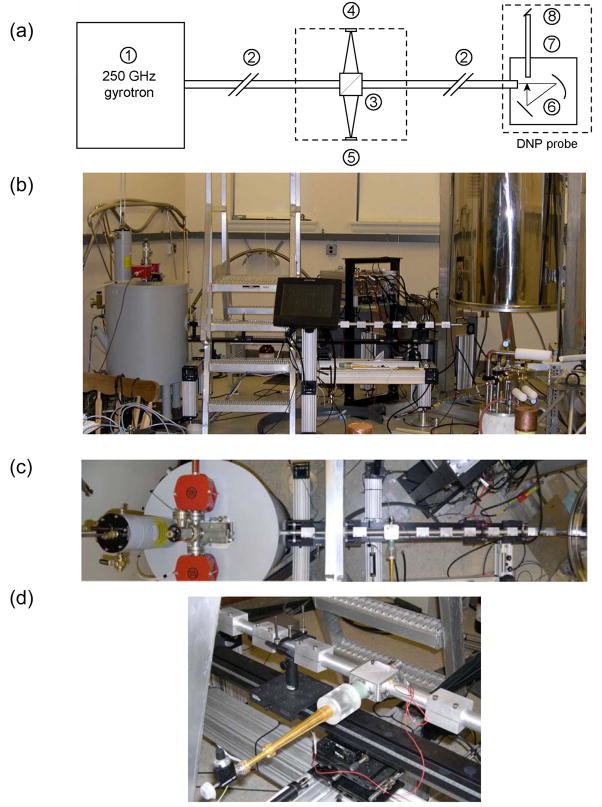
Figure 7a schematically illustrates the millimeter wave components of the spectrometer that are clearly labeled, and in Figures 7b and 7c we show photographs of the equipment. In both photos the gray gyrotron magnet is visible on the left, the aluminum corrugated transmission line, supported on an inexpensive optical rail, can be seen running from the gyrotron towards the large NMR magnet located on the right side of the photo. The directional coupler is visible in this figure and is shown in more detail in Figure 7d, and is discussed elsewhere [93]. The details of the construction of the NMR probe will appear in separate publication. In this paper we focus on the design and operation of the gyrotron which is the major microwave component.
Figure 7.
(a) Schematic representation of the 250 GHz gyrotron, corrugated transmission system, and 380 MHz NMR probe. (1) 250 GHz gyrotron oscillator (2) Corrugated waveguide (22 mm i.d.). (3) Beam splitter; (4) Forward power detector; (5) Reflected power detector; (6) Focusing and reflecting mirror optics; (7) Helically corrugated waveguide (8 mm i.d.); and (8) Miter mirror.
(b) Photograph of the 250 GHz DNP experiment. The gyrotron magnet, on the left, is interfaced to a corrugated waveguide which leads to the NMR magnet, on the right. A touch-sensitive control interface is located midway on the waveguide support and alignment system.
(c) Composite photograph of the system illustrated schematically in Figure 7a (left) 250 GHz gyrotron the gyrotron tube is shown with vacion pumps in the gray superconducting magnet, (center) corrugated transmission system with the directional coupler visible in the center of the photograph, and (right) 380 MHz NMR magnet is visible on the edge of the photo. The NMR probe is not visible since it is under the magnet. The view in this photo is from above the gyrotron and waveguide looking down.
(d): Photograph of the 250 GHz quasi-optical directional coupler. Forward power is coupled to the detector diode by means of a short dielectric taper, dielectric horn, and a circular-to-rectangular transition. An attenuator allows the power to be adjusted to the linear range of the diode. The detection circuit has been designed with high loss to avoid reflections across the beam splitter.
4. Gyrotron Oscillators
4.1 General Background
In this section, we provide a brief introduction to the design, theory, and operation of the 250 GHz gyrotron used in the DNP experiments described previously. We begin with an overview of the design and principles of operation of a gyrotron, and then consider the construction of the 250 GHz oscillator in detail. We subsequently discuss the theory of the operation of gyro-devices, from both quantum mechanical and classical perspectives. For more detailed and complete discussions of gyrotron principles and technology we refer the reader to one of the excellent introductory texts or review articles on this topic [31, 94–99].
A gyrotron is a vacuum electron tube that operates in a strong, static magnetic field. It functions as an electron cyclotron resonance maser that emits coherent radiation near the relativistic electron cyclotron frequency,
or its harmonics (sωc/γ′ with s an integer greater than one). Here is the electron charge, m the electron mass, γ′ a relativistic mass factor (vide infra) [note that γ′ is not the gyromagnetic ratio conventionally employed in the magnetic resonance literature], and B0 is the external DC magnetic field generated by a superconducting magnet. When other experimental constraints are satisfied, the frequency of the radiation, ωc, is determined primarily by the strength of the magnetic field.
An overview of the principal components of the gyrotron is shown schematically in Figure 8. An electron gun (A) contains a cathode that emits electrons that are accelerated by a voltage (~10–30 kV) applied between the anode and the cathode, moving them through the magnetic field where they precess in cyclotron motion. In the cavity region (B) a phenomenon referred to as bunching, described in more detail below, leads to the generation of microwaves. In (C) the microwaves are extracted by a step-cut mode converter through a cross bore in the magnet dewar and directed to the NMR sample through a waveguide. Finally, (D) shows the spent electron beam impinging on a water-cooled collector.
Figure 8.
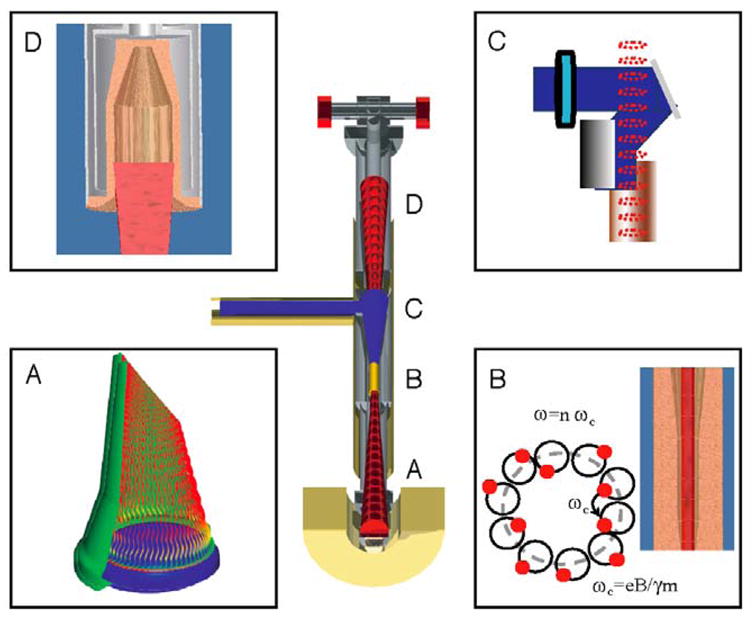
Schematic representation of the four major sections of a gyrotron tube that resides in the bore of a superconducting solenoid (see Figure 9). The central figure illustrates the assembled gyrotron tube and the four panels the function of each of the major sections. (A) shows the annular cathode of the electron gun from which the electrons are emitted forming beamlets and the cyclotron motion that initiates as a result of the presence of the magnetic field. The red dots represent cross sections of the beamlets and a given point in time. In addition, the magnetic field adiabatically compresses the electron beamlets so that they are focused into the cavity with a radius optimized to interact with the cavity mode. (B) illustrates the cavity region where electron bunching occurs that leads to microwave generation. The electrons are depicted in the initial stage of the dephasing process. The Cu colored piece is the cavity which is tapered at the bottom and flared at the upper end. (C) shows the quasi-optical mode converter (consisting of a step-cut waveguide and steering mirror) that extracts the microwave beam and directs it an angle of 90° through the cross bore of the magnet and into the waveguide for sample irradiation. Note the spent electron beam (red dots) continues through the tube to the collector region. In (D) the electron beam (in red) is collected in a water-cooled collector.
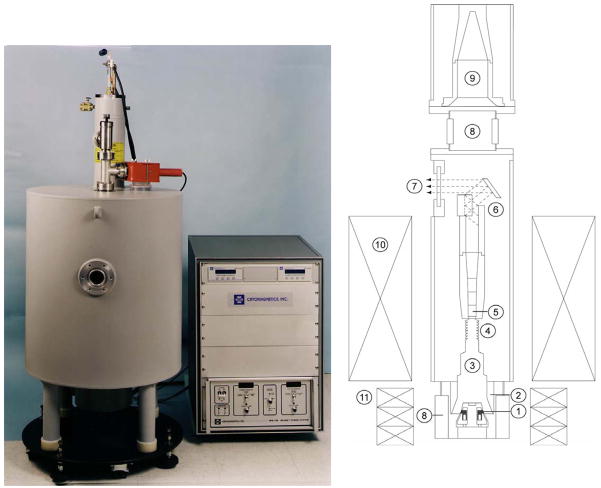
The actual physical layout of the 250 GHz gyrotron oscillator is shown in Figure 9. While this gyrotron is constructed in a manner that is very similar to other demountable tube gyrotrons used in academic research [100–102], our desire to make it compact and compatible with operation in close proximity to an NMR spectrometer necessitated special design considerations.
Figure 9.
(left) photograph of the 250 GHz gyrotron and the superconducting magnet power supply. The high voltage/heater power supply and control electronics are hosted in an additional rack similar to the magnet power supply. (right) Schematic of a gyrotron tube indicating the key components. (1) cathode; (2) anode; (3) drift tunnel; (4) microwave absorber; (5) cylindrical resonant cavity; (6) quasi-optical mode converter; (7) output window; (8) high voltage ceramic insulator; (9) electron beam collector; (10) persistent superconducting magnet; (11) electromagnet.
Superconducting Magnet
The output frequency of a gyrotron requires a peak magnetic field equal to 0.036γ′ Tesla/GHz, where γ ′ is the relativistic mass factor defined below. Electrons accelerated in a potential of 10–100 kV are only moderately relativistic (i.e. their energy is much smaller than the electron rest mass of 511 kV), and so γ ′ ~1. This limit corresponds to the familar g~2 electrons and leads to a gyrotron operating frequency of ~28 GHz/Tesla. Therefore, production of ~250 GHz microwaves requires a ~9 T gyrotron magnet.
The requirements for a gyrotron magnet are quite modest when compared to those of an NMR magnet. Most notably, the gyrotron oscillator requires that the cavity be located in a region spanning 10–30 free space wavelengths of the operating frequency and that the homogeneity over this region be ± 0.1 %. For 250 GHz, λ=1.2 mm corresponding to region of ~120–360 mm with this homogeneity. Outside of this “flat field” region, the solenoidial magnetic field should decay with a ~1/z3 (dipole) dependence, where z is the distance along the solenoid axis. This dependence is especially important near the electron gun region for generation of a high quality beam. Thus, a typical actively shielded NMR magnet, which exhibits an abrupt decrease in the magnetic field outside the flat field region, is not compatible with a traditional gyrotron electron gun design. A partially shielded magnet with more radial than axial shielding or an unshielded magnet is desirable in a gyrotron system. The second critical specification for the magnet is field drift, and, typically, the frequency drift of a gyrotron operating in a TEmp1 mode (vide infra ) is at least of an order of magnitude lower than the magnet field drift rate. Nevertheless, with current technology a drift rate of ~0.01 ppm/hr is easily obtained in NMR magnets fabricated from NbTi and Nb3Sn conductor, and therefore matches the drift of the gyrotron to the drift of the NMR magnet. This is most desirable for applications of gyrotrons to DNP experiments where it is essential to maintain a stable irradiation position in the EPR spectrum.
Electron Gun
The electron beam is generated in a diode electron gun with an annular thermionic emitter and a hollow anode. In order to avoid poisoning of the emitter when the tube is operated in true CW mode, it is necessary to maintain the vacuum at a base pressure <10−9 torr. The electron beam is born at a finite magnetic field generated from the decaying field of the main superconducting magnet and a local room temperature copper solenoid (10 and 11 respectively, in Figure 9). The electron gun is very similar to that used in a magnetron tube [94] and hence is referred to as a magnetron injection gun (MIG). The 250 GHz gyrotron uses a diode electron gun because it is simple to fabricate and requires a single power supply, but it is not unusual to have a triode electron gun for more precise control of the electron beam properties. The electron beam is adiabatically compressed as it traverses up the magnetic hill created by the main superconducting magnet and achieves the final beam radius in the resonator that is appropriate for exciting the desired interaction mode. The section through which the electron beam drifts during its compression is called the beam tunnel (3 in Figure 9) and is designed to suppress the generation of any spurious interaction modes that can compromise the beam quality. For this purpose, the beam tunnel has slotted tubes and rings of lossy ceramics to lower the quality factor and prevent excitation of spurious oscillations.
Cavity Resonator
The heart of the microwave generation system is a cavity resonator formed by a profiled cylindrical waveguide open at both ends. The simplest manifestation of the resonator is a straight cylinder with a down taper through which the electron beam enters the resonator and an up taper through which the electron beam and the generated microwave radiation exit (see Figure 8B). The cavity operates in a TEmpq mode where m, p and q are the number of azimuthal, radial and axial variations of the mode respectively. Gyrotrons typically operate in a TEmp1 mode, which has a single axial variation of the field and results in high efficiency microwave generation and a stable output frequency. The frequency is determined by the radius of the straight section of the cavity and is only weakly dependent on the operating voltage, current or magnetic field. Hence, the operating mode is often designated as TEmp with the understanding of one axial variation (q=1). The 250 GHz gyrotron operates typically in the TE032 mode because the TE032 mode frequency in this case is closer to the desired electron excitation frequency corresponding to 380 MHz 1H frequency.
Mode converter
The microwave radiation is generated in a high order cavity mode such as the TE03 that cannot be easily extracted from the gyrotron tube and most importantly cannot be transmitted over a simple waveguide transmission line which may involve switches, bends, directional couplers and other elements. Hence, the operating mode is transformed into a linearly polarized free space TEM00 Gaussian beam in the tube using an internal mode converter (6, in Figure 9) and then extracted from the tube. The mode converter is designed using quasioptical techniques and consists of a launcher that in this case is waveguide with a step-cut to radiate the operating mode in the radial direction. The radiation is collected by a parabolic reflector that focuses it on another mirror or a series of mirrors that direct the beam out of the gyrotron tube radially through a vacuum window. In the 250 GHz tube, the mode converter has two mirrors that include the parabolic reflector facing the launcher. A second crucial function performed by the mode converter is the separation of the electron beam from the microwave radiation. This allows the electron beam to be collected in a simple collector described in the next section.
In many gyrotron designs the collector and output window are located above the magnet dewar and therefore the mode converter requires multiple mirrors-- sometimes four or more-- to eventually direct the radiation out of the tube over the top of the superconducting magnet dewar. To reduce the number of mirrors in the 250 GHz gyrotron, a cross bore arrangement, as shown in Figure 9 (left), was employed. The cross bore simplifies the mode converter design while allowing the magnet dewar to have sufficient volume to satisfy the helium hold time requirements. However, the cross bore requires precise alignment of the tube and the internal mode converter to extract the radiation out through the narrow opening, but it has been used successfully in the 250 GHz gyrotron considered here and in the 460 GHz device described elsewhere.
Collector
The spent electron beam exiting the cavity is separated from the microwaves by the internal mode converter and is allowed to expand adiabatically in the decaying field of the superconducting magnet. After the beam radius is sufficiently large, it is collected on a water-cooled collector. The beam is allowed to expand in order to maintain the thermal load on the collector at ≤100 W/cm2. Since the gyrotron typically operates at ~5% efficiency, the remaining power in the beam (12 kV × 20 mA ~250 watts) is dissipated in the water cooled collector, where a flow rate of few gallons per minute is sufficient to extract the generated heat. In the 250 GHz tube the collector operates at ground potential, but it can be designed to operate at a negative potential to recover the spent electron energy and boost the overall efficiency. This was not the option of choice for the 250 GHz tube because safety from high voltage was clearly more desirable than an increase in efficiency. The ceramic break (8, in Figure 9) allows independent measurement of the collector current from any body current which can be generated due to premature beam interception.
Control System
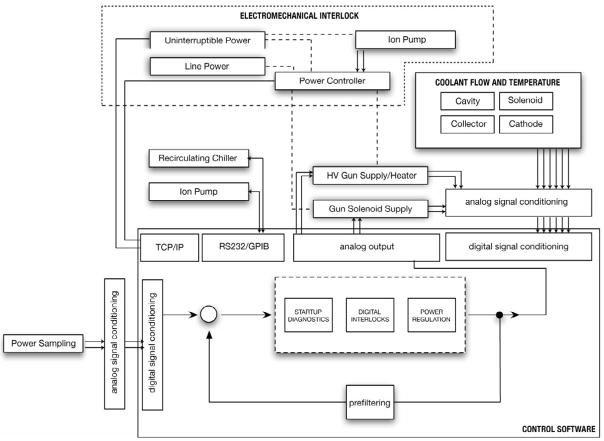
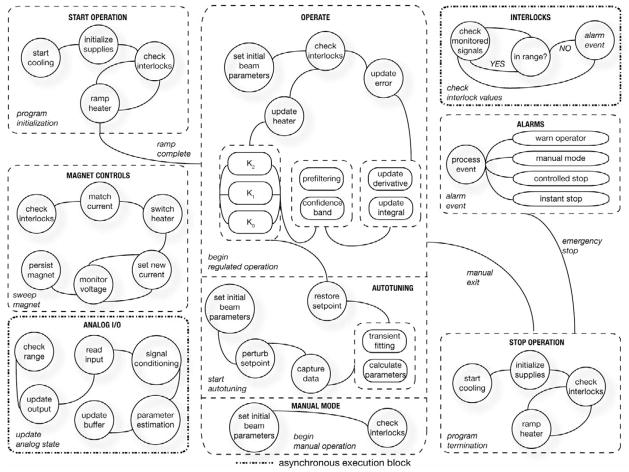
The control system consists of both electromechanical and digital controls and interlocks. Electromechanical interlocks involving the gyrotron tube pressure, coolant flow, and ambient temperature and humidity are implemented using power control hardware which also controls uninterruptible power (UPS) service to critical aspects of the experiment. Digital controls and interlocks are implemented in a combination of LabVIEW interface elements (National Instruments Inc.) operating under a Windows PC environment and, for some functions, in C++ programs which make use of the Comedi measurement device interface under Linux. Digital I/O occurs via UDP over ethernet network or through RS-232C/GPIB terminal servers (National Instruments Inc.). Analog I/O is accomplished through integrated data acquisition boards (Computerboards Inc.; National Instruments Inc.). Analog signal conditioning is limited to high-voltage isolation, amplification of signals, and low-pass audio filtering; further signal conditioning and parameter estimation is performed in software. Finally, standard microwave components such as video detectors, attenuators, and scalar horns etc. were purchased from Millitech Inc., Pacific Millimeter, and Aerowave and incorporated into the system. The transmission line has other specialized components that are described in the later sections.
4.2 Theory
As mentioned above the gyrotron can operate either as an oscillator or amplifier and it functions by converting the transverse kinetic energy of a moderately relativistic electron beam into electromagnetic radiation. Specifically, when the beam current in the device exceeds threshold (the starting current of the oscillation), then the resonant interaction of the cyclotron mode of the electron beam and the electromagnetic mode of the cavity resonator leads to energy exchange.
Cyclotron Mode
The electron beam supports cyclotron modes that obey the equation,
| (1) |
where ω is the radiation frequency, kz is the wave vector, vz is the axial electron velocity, s is the cyclotron harmonic number, and γ′ is the relativistic mass factor,
| (2) |
Here is the total electron velocity. The beam pitch factor α = (v⊥/vz) determines the transverse energy in the electron beam, where v⊥ and vz are the parallel and perpendicular velocities respectively of the electron beam with respect to the external DC magnetic field B0. Specifically, (1) and (2) are a statement that the radiation frequency ω lies near to the cyclotron frequency, but that it is upshifted by the Doppler term, vzkz. The Doppler term arises because the synchronous precession of the electrons is in turn perturbed by the oscillating electromagnetic field. While the Doppler term in the resonance condition indicates that the radiation frequency can, in principle, be much higher than the cyclotron frequency, gyrotrons typically operate in the regime kzvz ≪ ωc. This prevents a velocity spread of the electron beam from broadening the width of the output radiation and reducing the gain. In addition, we note from (1) and (2) that as v → c (as the energy increases) then γ′ increases and the frequency of the radiation ω decreases. This leads to bunching and the conversion of beam power to microwaves (vide infra).
Waveguide Mode
The cavity resonator used in a gyrotron supports a transverse electric (TE) electromagnetic wave with the following dispersion relation:
| (3) |
where k⊥ = vmp/R, R is the waveguide radius, c is the speed of light, vmp is the pth root of , Jm(x) is the Bessel function of order m, and kz is the axial wave number of the TEmpq mode in the waveguide. For a simple right circular cylinder resonator, kz = qπ/L, where q is an integer and L is the cavity length. For a more general cavity shape, kz is obtained by solving for the appropriate cavity eigenmode.
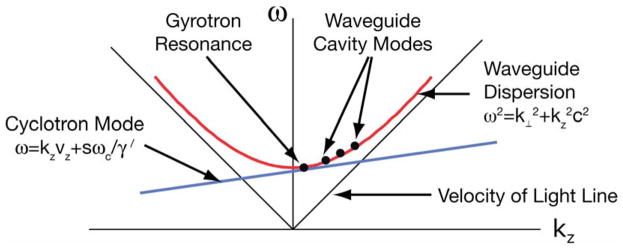
The condition for excitation of the electron cyclotron maser instability requires simultaneously satisfying both the resonance condition and the wave equation, that is (1) and (3) above, and this is illustrated graphically using the uncoupled ω-k diagram in Figure 10. In the figure, the dispersion relations of both the waveguide mode and the cyclotron resonance mode are shown. The gyrotron instability is excited near the point of intersection of the beam-wave and waveguide dispersion relation.
Figure 10.
The uncoupled dispersion relations for the electron beam (cyclotron mode) and the waveguide mode (waveguide dispersion). Cyclotron maser emission can occur when the two modes coincide, as shown in the figure by the arrow at gyrotron resonance.
4.3 Quantum Theory of Gyrotrons
The gyrotron interaction can be explained understood quantum mechanically by considering the energy levels of an electron placed in a homogeneous magnetic field. For a nonrelativistic electron, the energy levels in a DC magnetic field were solved by Landau and are harmonically quantized according to [103, 104]
where n is the integer index of eigenvalues. These levels are evenly spaced and do not yield stimulated emission. On the other hand, a solution of the Dirac equation for an electron in a homogeneous magnetic field shows, in the weakly relativistic limit, that the energy eigenspectrum is given by:
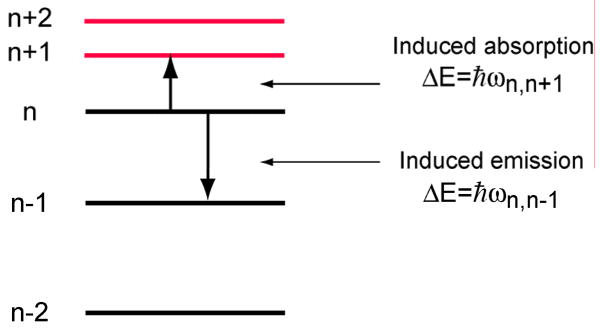
[105, 106]. As shown in Figure 11, these levels are not equally spaced, that is they are not harmonic, because the relativistic cyclotron frequency (ωc/γ′) decreases with increasing energy (i,e., v→c and γ increases). Stimulated emission is possible in a manifold of unequally spaced states, and this is the gain mechanism of the gyrotron oscillator. Further, the unequal spacing leads to absorption and radiation frequencies that are different. When the electromagnetic fields are tuned to induce the n → (n − 1) transition they also induce stimulated emission. Hence, the emission frequency is slightly higher than the cyclotron frequency as shown in the example below.
Figure 11.
The energy spectrum of a relativistic gyrating electron showing the nonuniform spacing of the energy levels.
The quantum theory of the gyrotron was first discussed by Schneider [105]and provides a clear picture of the gain mechanism. The results of Schneider were expanded by Robinson [106] and more recently by Sokolov and Ternov [107], and we recommend that the interested reader consult these two sources for additional details. We adopt Robinson’s notation and approach in what follows.
Following the approach of Robinson [106], one can show the net energy absorption of weakly relativistic electrons to be
where Nn is the number of electrons in the nth state, q is the charge of an electron, ξ0 is the amplitude of the electromagnetic field in a uniform resonator of length L, t = L/vz is the interaction time, m is the rest mass of an electron and Γ is half of the relative phase shift of the electrons with respect to the electromagnetic wave, defined as
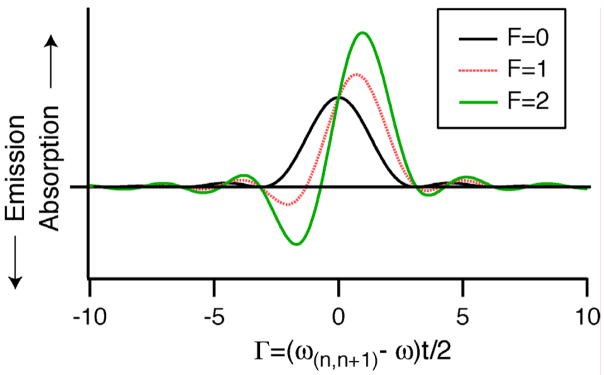
In Figure 12 the absorption (W) is plotted as a function of Γ for different values of the factor F defined as
Figure 12.
The energy absorption, W, (in arbitrary units) of an electron passing through a uniform resonator, as a function of the detuning from resonance. The plots are shown for different values of the parameter F. Significant energy emission ( E < 0 ) requires a value of F~2. F increases with both the electron energy (electrons that are more relativistic) and the number of cyclotron orbits in the interaction region.
where we have factored the equation into a term corresponding to the ratio of the electron kinetic energy to the electron rest mass energy, and a second term that is 2π times the number of cyclotron orbits in the resonator. The condition for emission, as illustrated in Figure 12, is that the value of F be large compared with unity. This can occur when the weakly relativistic electrons execute many orbits in the gyrotron resonator (N = (ωct) ≫ 1).
For moderately relativistic electrons (F>0), a proper choice of Γ, which is related to the detuning as [Γ/2 = (ωc −ω)t] can lead to negative absorption or gain. In practice, for a resonator mode, the frequency ω is constant and the magnetic field is changed to vary ωc and satisfy the beam/wave resonance condition.
However, we note that a 10 to 100 keV electron possesses an energy ~108 times the energy of the cyclotron photons (100 GHz = ~ 4 × 10⁻³ eV). Thus, since the energies are large compared to the photons, the gyrotron can also be understood with classical theory, especially in the nonlinear regime.
Phenomenological Description of Gyrotron Interaction
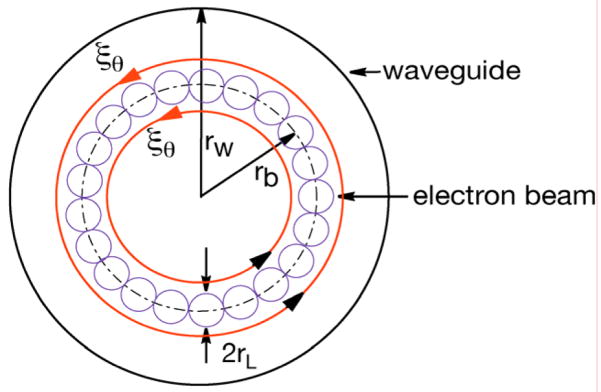
The gyrotron interaction can also be described as a process in a vacuum electron device (microwave tube), where, under the force of the electromagnetic field, the phenomenon of electron bunching occurs in phase space. In this process, the electrons, whose phases are initially randomly distributed, either acquire or lose phase because of the non-uniform perturbation of the oscillating electromagnetic field. Thus, the bunched electrons are eventually decelerated to generate electromagnetic radiation. Let us consider a hollow annular gyrating electron beam drifting through a waveguide supporting a TE01 mode and immersed in a static background magnetic field as shown in Figure 13.
Figure 13.
Schematic of the cross section of a gyrotron interaction region at the resonator, showing the annular electron beam of radius rb, consisting of electron beamlets of is the azimuthal radius rL. rw specifies the radius of the resonator and ξθ is the azimuthal electric field.
The gyrating electrons with Larmor radii of rL = v⊥/(ωc/γ′) are located on a circle of radius rb (the electron beam radius). The electrons are initially emitted from a cathode of much larger radius, but in passing from the electron gun, situated in a lower magnetic field region, to the resonator, in a higher field region, they are adiabatically compressed to a final radius of rb, as shown in Figures 8 and 13 and also discussed below. When they enter the interaction region the electrons are initially randomly distributed in phase space. But, due to relativistic effects the cyclotron frequency of the electron decreases as they gain energy and increases as they lose energy, resulting in bunching as shown in Figure 14.
Figure 14.
The sequence of bunching, its evolution and eventual energy extraction in a gyrotron [108]. (a) Electrons randomly distributed in phase space, (b) and (c) the E field accelerates half the electrons (d) electrons end up as a bunch in the decelerating phase.
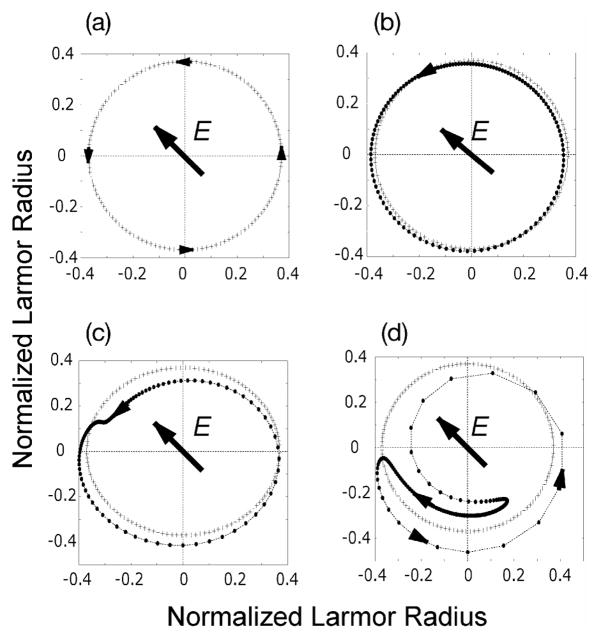
Each panel of this figure shows a snapshot of the electron distribution at a series of time steps taken at an integer multiple of the E- field oscillation period so that the E- field appears stationary. The dots in the panels show the electrons within one of the beamlets shown in Figure 14. In (a) the electrons are initially randomly distributed in phase space and have equal Larmor radii. In (b) and (c) the electromagnetic field accelerates half the electrons, and they gain energy and are retarded in phase space due to the decrease in cyclotron frequency due to their increased relativistic mass. The other half are decelerated by the electric field, lose energy and are accelerated in phase space due to an increase in their cyclotron frequency. Furthermore, the Larmor radii of the faster gyrating electrons decrease, while those of the slower gyrating electrons increase, resulting in a change in the shape of each beamlet as shown above. The bunch continues to grow as the electron beam traverses the cavity as shown in (c). If the frequency of the electromagnetic field is slightly higher than the cyclotron frequency the bunch slips in phase with respect to the wave and eventually ends up in the decelerating phase of the electromagnetic field (where the bunch is moving parallel to the electric field) as shown in (d). The electrons end up as a bunch in the decelerating phase, giving up their energy to the electromagnetic field, resulting in energy extraction.
5. Characterization of the 250 GHz Gyrotron
In multidimensional magnetic resonance experiments it is important to have the experimental variables such as rf power levels stable to 1% since signal averaging and coherence selection requires that the spectrum must be reproducible from scan to scan. Similarly, in an experiment incorporating DNP, the enhancement depends on the microwave power output, the frequency stability, and spectral purity of the gyrotron radiation, and this dependence places constraints on the operational stability of the device. In order to understand the manner in which these three parameters vary, we have systematically investigated the performance of the 250 GHz oscillator under a variety of conditions. In particular, we have measured the power output as a function of voltage, current, magnetic field, and temperature, and observed the fluctuation of the power as a function of time. The stability of the frequency is monitored simultaneously in these experiments. The spectral purity of the radiation was measured with a combination of heterodyne and homodyne techniques that assess the average and instantaneous purity of the gyrotron emission. The results demonstrate that the gyrotron can operate safely under feedback control with a power stability <1%, typically for periods of 10 days. The spectral purity is excellent, showing a bandwidth of <10 ppm determined by the local oscillator bandwidth in the heterodyne experiments and no strong contaminating resonances in the homodyne experiment.
5.1. Power and Frequency Stability
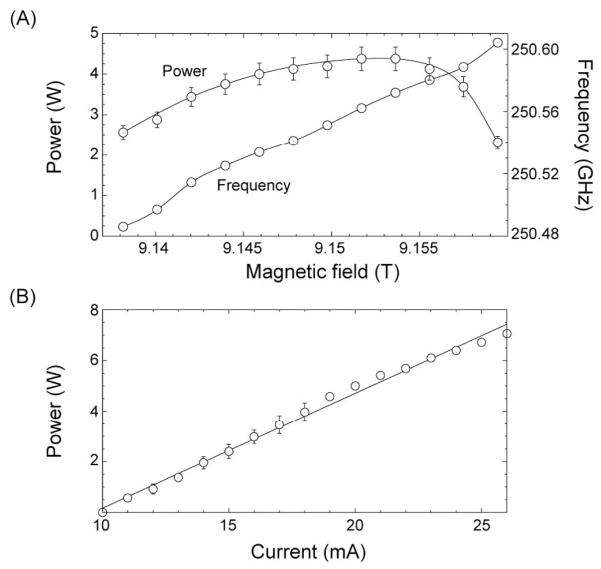
Figure 15 illustrates the output power of the 250 GHz gyrotron as a function of magnetic field and beam current and in Figure 15a and 16 we show the frequency as a function of magnetic field, gun field and applied voltage. Normally the gyrotron operates in the TE0,3,2 mode (to be discussed further below) with a beam voltage of 12.2 kV and beam current of 15–30 mA. The operating mode corresponds to the output frequency that maximizes the DNP enhancement for a 1H NMR frequency of 380 MHz, but operation in other modes is possible. In addition, the oscillation begins at a low beam current and generates a sufficient amount of output power for DNP. Figure 15A illustrates that the power output does not vary dramatically with magnetic field, and thus with a stable superconducting magnet (drift < 0.01 ppm/hr) the power output should not be affected by changes in the magnetic field.
Figure 15.
(A) Frequency and power of the operating TE0,3,2 mode as a function of magnetic field. (B) Power in the TE0,3,2 mode as a function of beam current. Power measurements were performed with a Scientech laser calorimeter that has been calibrated for millimeter waves.
Figure 16.
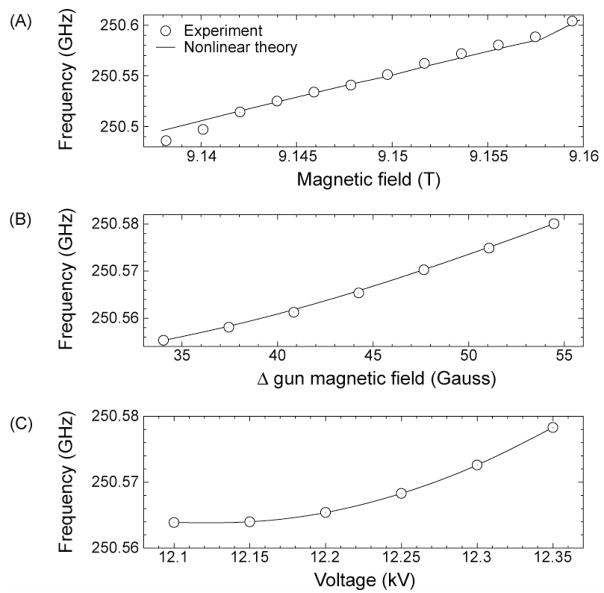
Frequency pulling in the TE0,3,2 mode as a function of (A) the main magnetic field, (B) the gun magnetic field, and (C) the beam voltage. Simulations (solid lines in the figures) were conducted in MAGY [112]
Figure 15b depicts the variation of the output power of the TE0,3,2 operating mode with beam current where it is a linear function of the beam current, suggesting that feedback control of the beam current could be sufficient to regulate the output power. However, fluctuations in other gyrotron operating parameters over long time scales modify this linear correlation, and so regulation of the beam current alone is insufficient to guarantee stable output power. In Figure 15b we show a maximum CW output power of 7 W that is achieved at beam parameters of 26 mA and 12.2 kV, yielding an efficiency of 2.2%. Output powers of up to 25 W have been observed in the TE0,3,1 mode (beam voltage and current of 11.8 kV and 49 mA, corresponding to 4.4 % efficiency) during hour-long CW operation [44].
5.2. Frequency Tuning
The dependence of the gyrotron frequency on experimental parameters is of interest for two reasons. First, it is important to have the frequency stable in the CW DNP experiments discussed here since the enhancement in solid effect, thermal mixing and cross effect experiments [38] is strongly dependent on the position of irradiation in the EPR spectrum. Second, it would be useful to be able to tune a gyrotron oscillator across the breadth of the EPR spectrum, a feature that is discussed elsewhere [46] and mentioned in Section 3. Here we discuss relatively small variations of the output frequency, which we term frequency pulling, that describe the variation of frequency as a function of beam voltage, cathode parameters, and magnetic field while the gyroton is operating in the TE0,3,2 mode. These effects were observed and discussed previously [109–111] in other gyrotrons. As illustrated in Figures 15A and 16A, B, and C the gyrotron operating frequency (and the microwave power output) is sensitive to variations in the main or auxiliary magnetic fields, the beam voltage, or beam current, and the cavity temperature (data not shown). Measurements of the frequency pulling characteristics of the 250 GHz gyrotron were performed using a heterodyne receiver system consisting of a WR-3 harmonic mixer and a K-band local oscillator (18–28 GHz) along with signal conditioning and data acquisition instruments. The local oscillator is stabilized to within 1 Hz using a phase-locked loop (PLL), and these measurements used the 11th harmonic of the oscillator and are limited only by its phase noise at high harmonics.
The data in Figure 16 show that when the gyrotron is operating in the TE0,3,2 mode, we observe that changes in the main magnetic field by 0.02 T, the cathode magnetic field by 20 gauss, and the beam voltage by 250 V result in frequency pulling while still maintaining acceptable power output. Individually tuning the beam voltage and gun magnetic field in these ranges resulted in 14 and 25 MHz of frequency tuning, respectively, while the main magnetic field yields the widest tuning amounting to 118 MHz. This wider tuning range is a result of the use of the second longitudinal mode as the operating mode. In Figure 16(A), the experimentally observed magnetic tuning is compared to nonlinear theory simulated in MAGY [112] using experimental parameters with good agreement. The dependence of the operating frequency on external parameters is summarized in Table 1. We also examined the effects of changing the cavity temperature assuming it to be that of the thermally regulated coolant at the cavity inlet. These results demonstrate that the gyrotron operating frequency is most sensitive to variations in the magnetic field. At this frequency, DNP typically requires frequency stability of less than 1 MHz for experiments lasting up to ten days, which limits the maximum permissible magnetic field drift to 0.08 ppm/hr under these operating conditions. To achieve these magnetic field control tolerances, the superconducting magnet must operate in persistent mode, and, in the 250 GHz DNP installation, the magnet must be recharged approximately monthly to counteract its intrinsic drift. Currently, the magnet drift and the capacity of the magnet cryogenic dewar are the only factors which limit the length of continuous operation. Since only small changes in the frequency can be accomplished through changes in the operating parameters, these results demonstrate that a gyrotron operating in a single axial mode is effectively fixed in frequency; this explains the rationale for using NMR magnets with superconducting sweep coils in DNP experiments.
Table 1.
Dependence of frequency on operating parameters
| Parameter | Sensitivity |
|---|---|
| Magnetic field | 5.3 GHz/T |
| Beam voltage | 86 MHz/kV |
| Cathode magnetic field | 12.3 GHz/T |
| Cavity temperature | <1.0 MHz/°C |
5.3. Spectral Purity
In magnetic resonance experiments it is important to have not only a source with excellent frequency stability over time, but also one that is spectrally pure. For example, if the local oscillator in an NMR spectrometer is noisy then it will degrade the signal to noise of the instrument. In the case of DNP experiments, if the noise bandwidth of the gyrotron is comparable to the EPR linewidth, then it may compromise experiments that depend on frequency selective excitation. Thus, it is important to know the spectral purity of the 250 GHz oscillator, and, accordingly, we have performed two experiments to investigate its bandwidth. These experiments are similar to other investigations of the spectral linewidth in gyrotrons discussed earlier [113, 114]. The radiation produced by the gyrotron has a finite linewidth that can be attributed to both intrinsic and extrinsic sources [115, 116]. The intrinsic linewidth arises from the natural emission line width, shot noise, which is white noise, and flicker noise, which has a 1/f power spectrum. Extrinsic sources of noise are those coupled into the system by variations of external operating parameters such as the beam voltage, magnetic fields, or coolant circuit temperature. We have analyzed the spectral purity of the CW gyrotron emission using a combination of heterodyne and homodyne measurements. During these measurements, the gyrotron operated in CW mode with feedback regulation of the beam current rather than the microwave power.
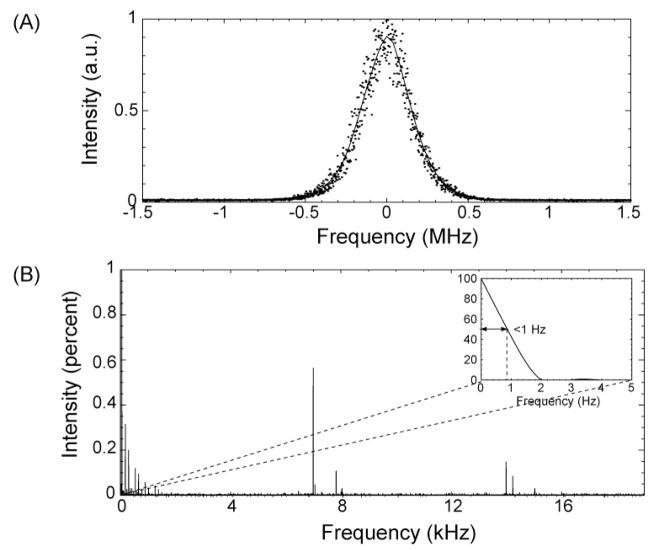
The gyrotron linewidth in the TE0,3,2 operating mode was measured using the phase-locked K-band oscillator and heterodyne receiver system used to measure the frequency stability together with a spectrum analyzer as a detector. The data shown in Figure 17A, are an average of 32 frequency sweeps lasting 0.5 s each and yield an estimated linewidth of ~300 kHz, which is close to the detection limit set by the phase noise of the local oscillator circuit at its 11th harmonic. This is comparable to the linewidths reported in other measurements [113].
Figure 17.
(a) Linewidth measurement of the operating TE0,3,2 mode using the heterodyne frequency measurement system. (b) Homodyne measurement in TE0,3,2 mode. The offset panel illustrates the natural emission linewidth.
While the heterodyne measurement is sensitive to the time-averaged absolute line width, the instantaneous modulation of a high frequency signal is best detected by demodulation using a homodyne technique [117]. We have measured the homodyne emission spectrum of the 250 GHz gyrotron using a diode detector and an oscilloscope (LeCroy, Model LT354) capable of sampling for several tens of seconds of acquisition. Typical data, shown in Figure 17B, are processed by zero-order baseline correction in the time-domain to eliminate any DC level artifacts and then Fourier-transformed without further apodization. All contaminating sidebands in the homodyne spectrum are less than 1% of the intensity of the DC component. Specifically, there is a manifold of signal sidebands with 7 kHz periodicity that arises from the switching frequency of the power supply, and a manifold of sidebands at 60 Hz that arises from AC line modulation of either the detector or the gyrotron beam. Thus, there is no low frequency noise in the frequency spectrum of the radiation that is <300 kHz. The heterodyne measurement of the gyrotron linewidth is therefore limited either by the phase noise of the local oscillator circuit or by extrinsic fluctuations in the operating parameters on the long time scale of the heterodyne measurement. Neither measurement shows the presence of significant parasitic modes or oscillations. We note that homodyne measurement is an approach to detect these parasitic oscillations and they have been detected at ~400 MHz in the operation of the 460 GHz gyrotron [45].
5.4. Radiation Patterns
Millimeter wave power is produced in the gyrotron cavity where it exists in a confined transverse electric (TE) mode. By contrast the propagation of the millimeter beam in free space is convenient only for a Gaussian beam. Therefore, a type of antenna, a mode converter, is used to efficiently couple radiation in the cavity mode to a free space Gaussian mode. The mode converter, consisting of a step-cut waveguide launcher and a cylindrical focusing mirror, also serves to separate the millimeter wave power from the energetic electron beam as is illustrated in Figure 8, thus protecting fragile structures such as the millimeter wave output window. The Gaussian beam is then directly coupled to an overmoded HE1,1 corrugated waveguide [93] which contains a quasi-optical beam splitter that acts as a directional coupler (See Figure 7 for details). At the terminus of the waveguide, the millimeter wave beam propagates again in free space and is optically focused and steered into a smaller corrugated waveguide for delivery to the sample. A miter bend at the complement of the magic angle (35.3°) is located at the end of the corrugated waveguide and allows for efficient coupling of the radiation into the sample (➇ in Figure 7a). Because the HE1,1 mode in corrugated waveguide couples efficiently to free space Gaussian propagation, HE1,1 mode purity is essential to efficient power delivery in this system. The presence of parasitic higher-order modes may otherwise compromise the experiment by introducing additional sensitivity to misalignment or vibration in the base of the NMR probe. Finally, the directional coupler that uses a beam splitter will only operate correctly for HE1,1 mode. For these reasons, we have analyzed the mode purity of the 250 GHz transmission system using three techniques: thermal paper, temperature-dependent liquid crystalline media, and a pyroelectric camera. The analysis of thermal burn patterns and calorimeter power measurements is discussed elsewhere [93] and suggests that initial higher order mode content amounts to 10% of the total coupled millimeter wave power but is filtered by the waveguide, resulting ultimately in a Gaussian-like beam at the waveguide terminus.
Millimeter wave mode patterns are most accurately mapped with motorized scanning devices, but these are difficult to use in the presence of the large fringe field of the 9 T wide-bore NMR magnet. Therefore, we have employed the temperature-dependent color of liquid crystalline media applied to a substrate transparent to millimeter waves as an indirect calorimetric measurement of the radiation pattern [118]. This method does not require any magnetic or moving components such as optical choppers or positioning motors and is easily scaled to arbitrary beam dimensions. With proper calibration, liquid crystal thermometry can provide sub-micron resolution and temperature accuracy approaching 0.1°C [119, 120]. In these experiments, we used a commercially available (Edmund Optics, Barrington, N.J.) liquid crystalline formulation that is sparsely applied to a thin polyethylene substrate. Since the substrate is nearly transparent at 250 GHz, while the encapsulated liquid crystalline particles are not, the measurement samples the millimeter wave radiation without perturbing the field structure and without excessive bleeding due to background absorption. Liquid crystal formulations that are sensitive to different temperature ranges can be combined in separate measurements to improve the overall dynamic range of the method. We employed a cross-polarized illumination and detection system to minimize optical reflections from the surface of the substrate. Collinear alignment of the substrate and camera was accomplished with the aid of a laser beam injected through the directional coupler and therefore aligned along the axis of the waveguide. Detection was accomplished through the use of an RGB-mode camera operating at 30 frames per second with a resolution of 640 × 480 pixels (Logitech, Inc.) arranged coaxially with the millimeter wave beam and normal to the surface of the LC substrate. Data were processed by first subtracting dark frame images to remove systematic artifacts and then averaging video frames over 333 ms to improve the sensitivity of the measurement. White light color calibration was accomplished through subsequent measurement of a white reflective paper. Finally, the images were converted from the RGB to an HSI color space and the incident power at each pixel was extracted by integrating images taken at different times.
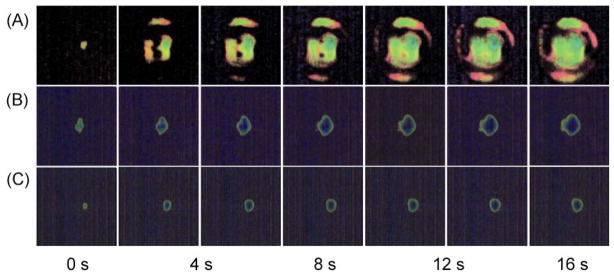
In total, 16 seconds of video were taken at each of three positions (see Figure 18) along the axis of the waveguide: (a) at 30 cm from the gyrotron window; (b) immediately before the directional coupler (120 cm from the gyrotron window); and, (c), between the directional coupler and the waveguide terminus (200 cm from the gyrotron window). In Figure 18(A), the gyrotron radiation is captured at the cross-bore exit unguided, resulting in some interference with the beam propagation. Figure 18(B) shows that the beam contains a small sidelobe, which is also seen in the pyroelectric measurements, and Figure 18(C) demonstrates that a relatively pure Gaussian mode is coupled to the NMR probe at the waveguide terminus. The Gaussian beam widths recovered in these measurements are systematically 5–8% higher than those obtained on the basis of pyroelectric measurements, partly because the measurement plane was 1.5″ from the terminus of the waveguide. In both cases, the experimental errors were assumed to be normally distributed; the values are reported at the 95% confidence interval, and the intervals were recovered from the covariance matrix of the fit.
Figure 18.
Radiated intensity of the gyrotron output while operating in the TE0,3,2 mode as recorded on liquid crystal media for (a) at the gyrotron bore and (b) after 120 cm of waveguide and (c) after 200 cm of corrugated waveguide as described in the text.
5.4.2. Pyroelectric camera
We have also used a pyroelectric camera to image the mode pattern. The advantage of this approach is its simplicity and linearity and therefore it is a well established technique in laser mode pattern measurements. Its disadvantages are first that a magnetic motor is required to modulate the CW beam through an optical chopper and second the small detector size that does not permit complete imaging of the beam. We employed a pyroelectric camera (Spiricon Pyrocamera III, Model No. PY-III-C-B, Serial No. 30507) consisting of a 124 × 124 element pyroelectric array with a 12.4 mm × 12.4 mm active area to measure the radiation pattern 190 cm along the waveguide axis. During these measurements, the gyrotron was operating in CW mode with an output power of less than 2 W to avoid damaging the detector. The CW beam was modulated at 24 Hz with an optical chopper integrated into the pyroelectric camera. The chopper motor and other magnetic components within the camera restricted its use to locations with an acceptable fringe magnetic field. The camera body was aligned with the millimeter wave beam using a laser beam injected into the waveguide through the directional coupler, and the detector element was assumed to be aligned with respect to the camera enclosure. The detector element is recessed 0.6″ from the enclosure, which was aligned with the terminus of the waveguide in these measurements. Since the detector area does not cover the entire aperture of the waveguide, the detector gain was set near the threshold of saturation to maximize the dynamic range of the measurement. All measurements were conducted in the absence of daylight to reduce background levels of infrared radiation. Data were processed by subtraction of a separately recorded dark frame to eliminate systematic dead pixel artifacts and background noise, followed by averaging of 32 captured frames to improve the sensitivity of the measurement. Near wavelengths corresponding to the pixel spacing (~0.1 mm), a rectilinear diffraction pattern becomes visible. Comparative measurements of another gyrotron oscillator operating in several modes from 150–460 GHz confirm that this is an artifact of the pixel spacing [47], and fitting of the images with and without image processing to eliminate these artifacts gives identical results for the case of a nearly Gaussian beam. These results are summarized in Figure 19, where Figure 19(A) is of the raw data, Figure 19(B) is a plot of the best-fit Gaussian, and Figure 19(C) is the fitting residual. The measurements indicate a small sidelobe and a slightly elliptical beam (c.f. Table 2), in good agreement with the liquid crystal data and close to theoretical expectations.
Figure 19.
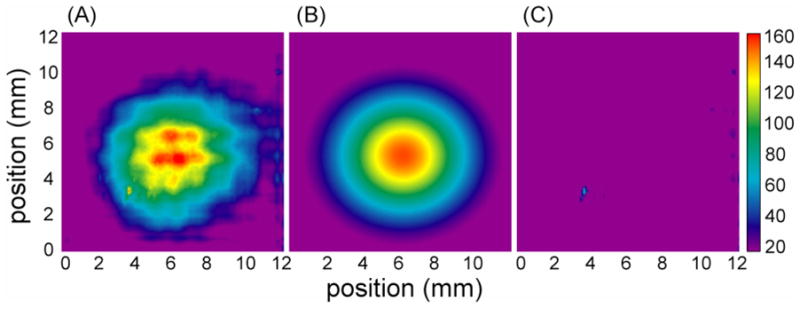
Planar section of the radiation intensity as recorded by a pyroelectric camera. (A) is the intensity 190 cm along the waveguide axis (B) is a Gaussian fit of the intensity data and (C) is the residual of the fit. The intensity is described on a linear scale in arbitrary units.
Table 2.
Gaussian parameters of the radiation field from Figures 18 and 19
| Measurement parameter | LC method | LC plane (theoretical width) | Pyroelectric camera | Camera plane (theoretical width) | Beam waist (theory) |
|---|---|---|---|---|---|
| x 1/e2 | 7.7 ± 0.2 | 7.29 | 7.25 ± 0.02 mm | 7.04 | 6.99 mm |
| y 1/e2 | 7.0 ± 0.1 | 7.29 | 6.60 ± 0.02 mm | 7.04 | 6.99 mm |
| Ellipticity (y/x) | 0.90 | - | 0.91 | - | - |
| Ellipticity (%) | 9% | - | 9% | - | - |
5.5. CW Long-term Stability and Control
Long term signal averaging is an essential feature of most magnetic resonance experiments, including experiments involving DNP. Thus, it is important that the gyrotron be capable of functioning for extended periods of unattended operation. During this period the power stability and therefore the fluctuations in the DNP enhancements should be ≤ 1% in order for multidimensional experiments to function properly. Accordingly we have assembled a control system described in detail in Appendix 1 that permits operation for periods of > 10 days with the output stability specified above. At the present time the length of an experiment is limited by the intrinsic drift of the superconducting magnet and the volume of the cryogen dewar, which must be refilled approximately every 10–11 days.
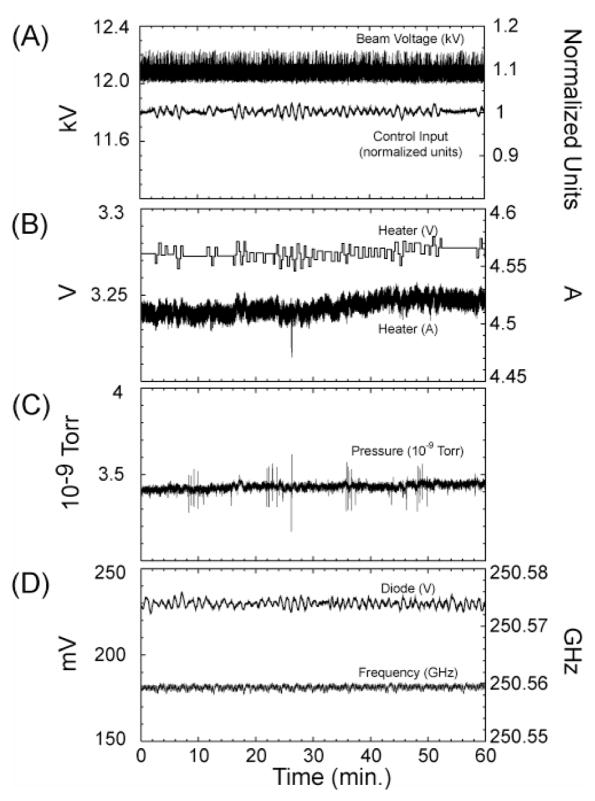
Data from a representative 10-day CW run using 4.5 W of output power are contained in Table 3 and illustrated in Figure 20. During the period all metrics of the gyrotron operation remained within acceptable tolerances for DNP experiments. The electron beam parameters and vacuum parameters are those reported by the high voltage gun and ion pump power supplies, respectively, and the heater parameters are reported by a low-voltage power supply integrated into the high voltage gun supply (Figure 20). Power is coupled into the millimeter wave diode using the directional coupler apparatus depicted in Figure 7D, and the measured values are corrected for the DC offset of the amplification and signal conditioning circuit. The proportionality of the sampled millimeter wave power and the absolute power over long time scales was demonstrated in [93] and was verified in this experiment by monitoring with a second calibrated diode which externally sampled the millimeter wave beam power at a high data rate to facilitate the analysis. The millimeter wave frequency was measured using the phase-locked heterodyne detection system discussed earlier.
Table 3.
Stability of the 250 GHz operating parameters during CW operation
| Technical parameter | Average value | Standard deviation | (%) |
|---|---|---|---|
| Filament voltage (V) | 3.274 | 0.004 | 0.1 |
|
| |||
| Filament current (A) | 4.515 | 0.008 | 0.2 |
| Beam voltage (kV) | 12.090 | 0.047 | 0.4 |
| Pressure (10−9 Torr) | 3.430 | 0.019 | 0.5 |
| Frequency (GHz) | 250.559348 | 0.000359 | 0.000143 |
| Power (diode units (mV)) | 229.75 | 1.94 | 0.8 |
Note from Table 3 that the power was stable to ~0.8% and the other parameters were well below this level including the frequency which showed a stability of 1.6 ppm.
Figure 20.
Stability of the TE0,3,2 operating mode over a representative hour of a long experiment. (A) beam voltage and control input, (B) heater voltage and current, (C) pressure, and (D) power and frequency. These parameters were measured with the directional coupler shown in Figure 7D as described in the text.
After a period of thermal equilibration of the heater, initial operation of the gyrotron at constant power requires higher heater voltages and produces higher tube pressures than is observed at equilibrium. Approximately two hours after initial CW emission with regulation of the output power, the operating parameters and tube pressure stabilize to a steady-state value about which there are only minor fluctuations. Uncontrolled operation of the gyrotron, on the other hand, results in oscillations of the output power with an overall increase in the output power after a period of equilibration. For this and other reasons, the correlation between beam current and output power is not precise, and therefore regulation of the beam current alone is sufficient to guarantee regulation of the output power only on very short time scales. Finally, while the measured tube pressure rapidly returns to its base resting value after termination of an experiment (Figure 20(C)), the gyrotron remains extremely sensitive to its operating history. We have found that regular operation of the gyrotron reduces the length of the initial equilibration period and improves the stability of operation.
Three factors limit the controlled operation of the gyrotron oscillator. First, the speed ofthe control circuit is currently limited by the need to perform signal conditioning and parameter estimation in software for a number of synchronously monitored analog signals including those involved in the safety interlock circuits (Figure A1 and A2). This effectively limits the cycle rate of the control circuit to 0.1 – 0.2 Hz with acceptable interactive performance and interrupt handling on our hardware. Next, the minimum increment and gain of the heater power supply limits control accuracy. Finally, the transient response of the heater circuit limits the degree to which rapid changes in the millimeter wave output power can be regulated by changes in the cathode heater. Figure 22 shows typical response curves for a sudden positive or negative step in the heater voltage (from 3.6 V to 3.7 V or the reverse). Note that there is a small-amplitude oscillatory modulation of the output signal on a 1–10 s time scale even in the absence of feedback regulation, which suggests that this noise is the result of power supply fluctuations or fluctuations in the pulsatile chiller circuit. The transient response of the cathode heater is characterized by a process dead time of 57 ± 8.5 s and a time constant of nearly 120 s, while we wish to regulate the gyrotron output power on the 1–10 s time scale. Proportional control alone results either in a long settling time and a large error at steady state or in highly oscillatory behavior with respect to fluctuations in the process variables. In order to achieve effective control with this transient response, we implemented a heuristic three-term error controller that gives the standard transfer function, G(s), of the form
Figure A1.
Block diagram illustrating major components of the 250 GHz gyrotron control system.
Figure A2.
State machine indicating common processing functionality of the 250 GHz control system. Transitions between blocks occur in response to events passed through a global message queue and are not explicitly illustrated. Each block has access to a global variable space and message queue, and concurrent execution blocks are indicated. Analog I/O is blocking.
Figure 22.
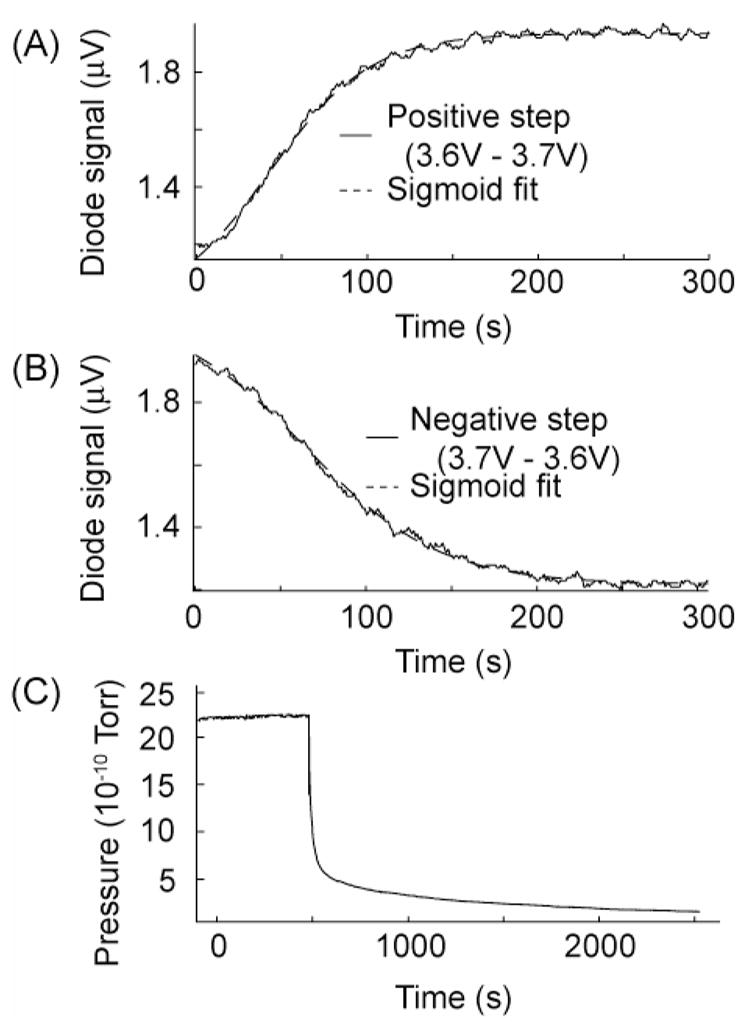
Representative transient response of the gyrotron to (A) positive and (B) negative step in the control voltage. The dashed line is a sigmoidal fit to the data from which optimal PID parameters were estimated. Note oscillations in the output power which persist even though the system is not under proportional regulation for these measurements. (C) Response of the system to termination of running power supplies following thirteen hours of CW operation.
where the Ki are parameters determined pseudo empirically and s is the transform variable. We have implemented a process signal prefilter (bandpass filter) whose transfer function is
when the signal is outside a confidence band around the setpoint. Here β is the bandwidth and ω0 is the center frequency, while A0 is chosen to give the control parameters convenient units. The error signal is set to zero when the power lies within the confidence band, resulting in no change to the controller output.
The initial parameters, Ki, of the three-term controller were estimated using a Ziegler-Nichols PID tuning rule [121] from the transient response data in Figure 22 without need for further empirical optimization. Automatic, on-line re-tuning of the control coefficients was triggered whenever the steady-state error exceeded a user-selectable threshold, thus allowing the control system to adapt to changing operating conditions. The bandpass prefilter was implemented in software, and its parameters were chosen to eliminate aliasing artifacts and line noise. The confidence band around the setpoint was set to account for minor oscillations in the signal amplitude at short time scales which are apparent in Figure 22(A) and (B); the confidence band also serves to limit control changes so that the power can be controlled within a preset tolerance even with the long cycle times of this control system. A statistical analysis of excursions of the process variable from its setpoint over the 10-day experiment, shown in Figure 22(A), shows that power fluctuations are normally distributed and that the tolerances of the DNP experiment are met by the control system. The distribution of data reflects the confidence interval, which, in this case, was set to 1%. A frequency-domain analysis, shown in Figure 22(B), also suggests that the residual error is time-dependent with a frequency of approximately 28 mHz, a fact which is clearly visible by inspection of Figure 22(A) and (C).
The optimal control parameters are extremely sensitive to operating history of the device, and regular operation of the gyrotron is required to avoid the need for periodic recalibration.
6. Second Harmonic Operation
By far the most expensive component of the 250 GHz and other gyrotrons is the superconducting magnet, and, as DNP experiments proceed to higher frequencies, the cost of the magnet for an oscillator operating in fundamental mode increases dramatically. In particular, at millimeter wave frequencies of ≤263 GHz (corresponding to ≤400 MHz NMR frequencies) it is possible to use magnets constructed from NbTi conductor that are relatively inexpensive. However, the successful experiments described in Section 2 suggest that it would be desirable to move DNP/NMR to higher fields to take advantage of the increased resolution. Thus, we anticipate that DNP experiments in the 700–900 MHz regime, corresponding to millimeter wave frequencies of 460–591 GHz, will become desirable in the immediate future and this could require a magnet based on Nb3Sn where the conductor cost are much higher. Thus, the most economical approach to generating millimeter wave power at these frequencies would be to employ an oscillator in which the output frequency is doubled, and with this approach it should be possible to use NbTi based magnets for all 1H NMR frequencies ≤800 MHz. Second harmonic operation has recently been demonstrated in a 460 GHz CW gyrotron oscillator for DNP, which operates in a 9 T magnet [45, 47].
This argument provided the rationale for us to perform a parametric study of mode excitation in the 250 GHz DNP gyrotron in order to optimize the efficiency of fundamental mode operation and to verify the potential for operation at the second harmonic of cyclotron resonance. For this study, the Gamma high voltage gun power supply was replaced by a pulsed modulator, and the gyrotron operated with 1–3 μs pulses with a frequency of approximately 1 Hz. Operating parameters including the cavity and gun magnetic fields, beam current, and beam voltage were varied to map out the operating characteristics of several second harmonic modes and fundamental modes in their vicinity. The electron beam voltage and current were varied up to 15 kV and 120 mA while the main magnetic field was varied up to 9.2 T and the gun magnet up to ±8.5 × 10⁻² T with respect to the cathode field.
Four unique transverse second harmonic modes were observed from 5.8 to 6.6 T with starting current as low as 12 mA. The oscillation frequency at a given magnetic field and voltage along with the starting currents for the TE0,4,1, TE2,4,1, TE3,4,1 (and TE3,4,2), and TE1,5,1 modes are enumerated in Table 4. Figure 23 summarizes the experimental starting current data as a function of magnetic field recorded for resonant cavity modes from 5.8 to 9.2 T and up to 120 mA beam current (open symbols denote fundamental modes and filled symbols denote second harmonic modes). It is of particular interest that the three harmonic modes detailed in the experiment, the TE2,4,1, TE0,4,1, and TE3,4,1, begin to oscillate at unusually low currents between 12–15 mA, and that the TE3,4,2 second harmonic mode begins to oscillate at 47 mA.
Table 4.
Second harmonic modes observed in the 250 GHz gyrotron
| Mode | Frequency (GHz) | Magnetic field (T) | Voltage (kV) | Start current (mA) |
|---|---|---|---|---|
| TE2,4,1 | 323.67 | 5.84 | 7.3 | 12 |
| TE0,4,1 | 327.41 | 5.90 | 7.8 | 15 |
| TE3,4,1 | 358.42 | 6.48 | 8.6 | 15 |
| TE3,4,2 | 358.81 | 6.50 | 8.6 | 47 |
| TE1,5,1 | 365.26 | 6.60 | 8.8 | - |
Figure 23.
Summary of experimental starting current data recorded for resonant cavity modes from 5.8 to 9.2 T and up to 120 mA. Open symbols denote fundamental modes and solid symbols denote second harmonic modes.
As has been reported previously for the fundamental modes of a 460 GHz second harmonic gyrotron oscillator [46], we observe broadband continuous frequency tuning with variation of the magnetic field alone. Figure 24 summarizes the experimental frequency tuning as a function of magnetic field recorded near the starting current for resonant cavity modes from 5.8 to 9 T (open symbols denote fundamental modes and filled symbols denote second harmonic modes). Data for the TE2,4,1, TE0,4,1, TE3,4,1, and TE3,4,2 second harmonic modes is shown in addition to the TE2,2, TE8,1, and TE2,3 fundamental modes. Table 5 summarizes the frequency tuning of the modes shown in Figure 24, where, notably, 1.8 GHz tuning has been observed in the TE2,2 mode and 1.4 GHz in the TE8,1, and only tens of megahertz of tuning in the second harmonic modes. The magnetic frequency tuning of the fundamental modes has been previously analyzed in detail [46].
Figure 24.
Summary of experimental frequency tuning data recorded for resonant cavity modes from 5.8 to 9 T near their starting currents. Open symbols denote fundamental modes and solid symbols denote second harmonic modes.
Table 5.
Frequency tuning for the observed modes between 5.8 and 9 T in the 250 GHz gyrotron
| TEm,p,q | Harmonic | Δf (GHz) |
|---|---|---|
| TE2,4,1 | 2 | 0.05 |
| TE0,4,1 | 2 | - |
| TE2,2,1 | 1 | 1.77 |
| TE3,4,1 | 2 | 0.02 |
| TE3,4,2 | 2 | - |
| TE8,1,1 | 1 | 1.36 |
| TE2,3,1 | 1 | 0.77 |
The expected starting currents for the 250 GHz gyrotron second harmonic modes and the TE8,1 fundamental mode calculated using linear theory, in Table 6, are much higher than the experimentally observed starting currents shown in Figure 24, while the experimental oscillation frequencies are nevertheless close to those obtained from cold-cavity simulations. There are several possible explanations for this phenomenon. First, the performance of the diode-type electron gun used in these experiments, which has been previously analyzed in detail [46], is characterized by large changes in the beam pitch factor and velocity spread as a function of beam voltage and magnetic field. However, linear theory and non-linear simulations using MAGY, shown in Figure 25, suggest that the effects of velocity spread alone cannot account for the lower starting currents. Second, we consider potential effects on the starting current of coupling to an off-axis beam, which may optimize the coupling coefficient for some modes, and was first contemplated due to the location of the oscillator magnet within the fringe field of a 9 T NMR magnet. The design beam radius of 1.018 mm effectively couples the electron beam to the second radial maximum of the TE0,3 mode.
Table 6.
Minimum start current, and magnetic field and frequency for minimum starting current of q=1 modes from linear theory [122] vs. experiment
| TEm,p,q | Experiment | Theory | ||||
|---|---|---|---|---|---|---|
| B0 (T) | Ist (mA) | f (GHz) | B0 (T) | Ist (mA) | f (GHz) | |
| TE2,4,1 | 5.84 | 12 | 323.67 | 5.85 | 272 | 323.537 |
| TE0,4,1 | 5.90 | 15 | 327.41 | 5.92 | 361 | 327.301 |
| TE2,2,1 | 5.93 | 7 | 165.00 | 5.95 | 15 | 164.889 |
| TE3,4,1 | 6.48 | 15 | 358.42 | 6.49 | 226 | 358.286 |
| TE8,1,1 | 8.66 | 17 | 237.19 | 8.66 | 252 | 237.062 |
| TE2,3,1 | 8.89 | 5 | 245.07 | 8.93 | 9 | 244.966 |
| TE0,3,1 | 9.06 | 13 | 250.10 | 9.12 | 9 | 249.973 |
Figure 25.
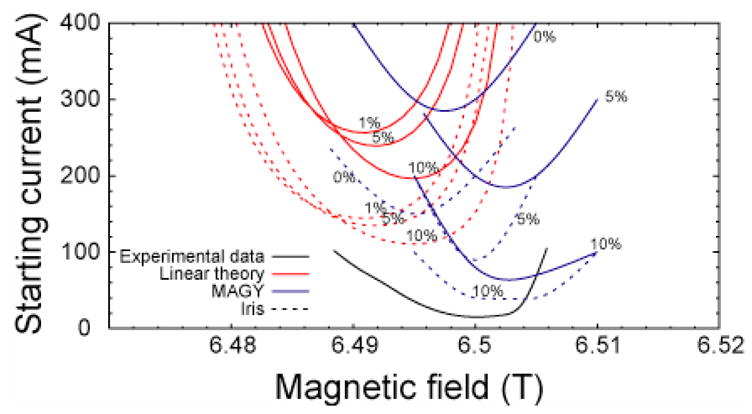
Starting currents for the second harmonic TE3,4,1 mode using linear and non-linear theory and for the case of the design cavity (lines) and with an iris added before the output uptaper (dotted lines). The percentages indicate the velocity spread simulated.
The coupling to the experimentally observed TE8,1 “whispering gallery” mode should be poor except for interaction with electrons in the vicinity of the cavity wall, but, in the experiment, the mode has a low starting current. An analysis of all the starting current data and a geometrical analysis of coupling factors in the presence of beam offset shows that no single beam offset can explain all the starting current data and, further, the magnitude of the beam offset required to optimize the coupling factors would result in beam interception at the cavity down-taper or in the ceramic drift region which precedes it. A third possibility is that the cavity diffractive Q is elevated over the design value, either through a manufacturing defect or another mechanism. In order to explore this possibility, we have measured the RF efficiency of the 250 GHz gyrotron through thermal load measurements of the cavity coolant loop (see Table 7). Using a cavity diffractive Q of 6,000, which was obtained from cold cavity simulations, and assuming that the conductivity of the electroformed cavity is half that of ideal copper, the expected RF efficiency for the 250 GHz TE0,3,1 mode is approximately 62%. In fact, according to the thermal load measurements in Table 7, the actual RF efficiency is closer to 21%, suggesting that the conductivity of the cavity has been overestimated by a factor of 25 (which is unlikely) or that the diffractive Q is six times higher than the design value.
Table 7.
Thermal load measurements of the 250 GHz gyrotron in the TE0,3,1 mode
| Beam power (W) | Cavity load (W) | Collector load (W) | Calorimeter (W) | RF efficiency (%) |
|---|---|---|---|---|
| 48 | 0 | 37 | 0 | - |
| 96 | 0 | 85 | 0 | - |
| 144 | 11 | 127 | 3 | 21.43 |
| 192 | 24 | 150 | 5.7 | 19.23 |
| 240 | 31 | 189 | 8.4 | 21.38 |
| 288 | 37 | 221 | 10.3 | 21.75 |
| 336 | 47 | 260 | 12 | 20.34 |
| 384 | 51 | 292 | 13.9 | 21.37 |
We note that a broad family of manufacturing defects commonly encountered at discontinuities in the cavity mandrel radius can increase cavity diffractive Q, particularly for second harmonic modes, while leaving the resonant mode frequencies largely unchanged. These effects are illustrated Figures 25 and 26. In particular, we illustrate in Figure 26(b) that a small discontinuity can dramatically increase the cavity diffractive Q. Nonlinear simulations of this hypothetical cavity shown in Figure 25 show that this explanations is consistent with the low experimental starting currents. This is one approach by which high harmonic gyrotrons might be designed to operate at reduced beam currents.
Figure 26.
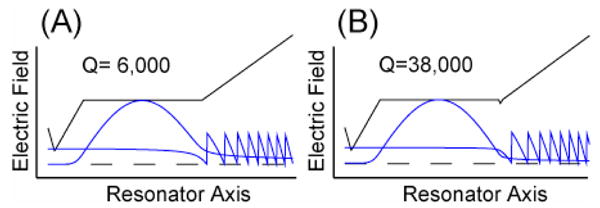
Cold cavity simulation showing the cavity and RF profile for the 250 GHz gyrotron cavity (a) without and (b) with an iris.
6. Conclusions
A computer-controlled stable CW source, the 250 GHz gyrotron was the first gyro-device specifically designed with the purpose of seamless integration into an NMR spectrometer [44, 50]. During the course of this work, the 250 GHz gyrotron has been operated continuously for a period of 21 days yielding a power stability of <1% and frequency stability of better than 400 kHz (1.6 ppm). The gyrotron output power is controlled through feedback regulation of power sampled through a quasi-optical directional coupler implemented in an overmoded corrugated waveguide. We have mapped radiation patterns at various locations along the axis of the waveguide and demonstrated using two techniques that a pure Gaussian mode is effectively coupled to the sample. Further, a parametric study of mode excitation in the 250 GHz gyrotron oscillator has revealed broadband continuous frequency tuning of up to 1.8 GHz through variation of the main magnetic field alone. Several second harmonic modes were observed in the range 325–365 GHz, and they are characterized by unusually low starting currents (as low as 12 mA). The low starting currents were attributed to an elevated cavity Q, a fact that is also suggested by cavity thermal load measurements.
The performance of the gyrotron control system is currently limited by the cycle time of the hardware, which is dominated by the need to synchronously sample multiple analog signals. Improvements in this approach, involving asynchronous digital sampling of slowly-varying signals and asynchronous sampling of analog signals, have been demonstrated in a 460 GHz gyrotron control system [47].
Figure 21.
(a) Statistical analysis of power fluctuations from setpoint. The solid line is a Gaussian fit to the data. The control system was set to maintain the output power within a 1% tolerance. (b) Frequency-domain analysis of power fluctuations from the setpoint.
Acknowledgments
The authors wish to thank I. Mastovsky, W. Mulligan, P. Allen, J. Bryant, D.J. Ruben and J. Vieregg. VSB acknowledges receipt of an NSERC PGS Fellowship. This research was supported by the National Institutes of Health through grants EB001960, EB002804, EB002061, EB004866, and EB002026.
APPENDIX 1
Gyrotron Control System -- Functional Specification
The gyrotron control system provides for automatic shutdown and startup of the gyrotron, unattended operation in CW mode, and shutdown in response to unsafe operating conditions. It also serves to automate certain rare but necessary auxiliary tasks involving charging, discharging, or sweeping the superconducting magnet.
While the gyrotron oscillator is a stable, free-running device on short timescales, its operating parameters drift over hours and days due to intrinsic and extrinsic factors. Intrinsic factors are principally thermal in origin and due to the impact of the energetic electron beam on the collector and other components and the heating of parts of the gun near the cathode. Further, a small fraction of electrons do not reach the drift region but are instead reflected back towards the cathode, increasing its temperature (see Hornstein, et. al. [46] for a discussion of the operating parameters of this gun). This is a positive feedback mechanism through which the beam current continues to increase at a fixed cathode voltage, at least in the absence of active regulation. Because these intrinsic factors are thermal in origin, the gyrotron will eventually reach a metastable equilibrium when operating at low currents. However, it may take several hours to do so, and this process can be accelerated by careful control of the gyrotron startup. Next, several extrinsic factors cause unacceptable drift and noise, and these include fluctuations in the power supplies which drive the gun and gun solenoid, drift in the superconducting magnet, and changes in the temperature of cooling water or cooling air. The dependence of the gyrotron beam power and frequency on these parameters has already been assessed in Section 5. The gyrotron control system continuously monitors the microwave output power and adjusts the cathode heater to counteract any variations. No effort has been made to regulate the frequency, though we note that this has previously been attempted in other gyrotrons designed for academic research [100].
The control system is also responsible for the safe shutdown of the gyrotron in response to several emergency conditions including power failure, failure of the cooling water or cooling air, unacceptable interception of the beam by some part of the tube other than the collector, and high vacuum pressure. The goal of automated shutdown is to minimize the damage caused by unsafe operating conditions and to place the gyrotron in a safe, serviceable state. In order to accomplish these goals, critical components and parameters of the gyrotron are monitored on a sub-second timescale. These include the temperature and flow rates of each cooling channel serving the collector, cavity, and gun solenoid; the flow rate of cooling air for the gun; the vacuum pressure as measured independently by two ion pumps; the nitrogen and helium cryogen levels in the magnet; and the current flowing through the tube body, which is a measure of beam interception. The control system triggers a complete shutdown if any of these parameters fall outside acceptable ranges. In addition, critical components of the gyrotron have been placed on uninterruptible power supply (UPS) systems which are managed and trigger an automatic shutdown in the event of a power failure. A system of normally closed electromechanical relays guarantees that no source power reaches high voltage power supplies unless the appropriate software interlocks are cleared in the control system.
Finally, the control system automates several rare but necessary tasks involving the superconducting magnet. In particular, a safety interlock does not permit the magnet to be swept unless the cryogen levels are sufficient. The last charge current is automatically stored, preventing any confusion or incorrect setting of the power supply when the magnet is brought out of a persistent operating mode. Other auxiliary tasks – such as operation of the gyrotron in pulsed mode – can also be automated by the control system, but these functions are typically used only during the initial conditioning of the vacuum tube.
Hardware and Software Architecture
The software and hardware architecture of the control system that accomplishes these functions is illustrated in Figure A1 and Figure A2. There are four categories of hardware: power supplies which control the gyrotron gun, gun solenoid and magnet; analog I/O circuits; electromechanical interlocks and measurement equipment; and, finally, the computer controls themselves. All the power supplies used with the 250 GHz gyrotron are controlled by analog signals, but the high voltage power supply has additional hard interlocks on the maximum output voltage and current which can be set from the front panel. Because of the long transient response of the cathode, the use of digitally controlled power supplies is acceptable and would ultimately be more appropriate and reliable in this application.
For the control system to communicate with these power supplies, analog I/O is accomplished by National Instruments DAQ cards, where analog signals have been first treated by signal conditioning that involves amplification and audio filtering, where appropriate. Analog signaling lines which lead to or from the gyrotron or otherwise experience high voltage under abnormal operating parameters are isolated using isolation diodes and clamping LC circuits, or using optical TTL-level encoders in one case. Wherever possible, analog signaling lines are capacitively shunted and wrapped around RF torroids to reduce high frequency noise pickup. Ultimately, the signals are digitized at audio sampling rates of < 10 kHz by the computer.
In addition to analog I/O to and from the power supplies, the control system communicates with several electromechanical measurement devices and interlocks. These include flow and temperature sensors that report on the cooling water temperature and flow rate in each of the cooling channels. The cooling air pressure is also monitored, as is the vacuum pressure through its relationship with the ion pump current. A system of electromechanical relays is activated by TTL-level voltages from the computer, and activation of these relays directly controls the house power (120V or 208V AC) to the gyrotron power supplies. Next, there are electromechanical interlocks based on the gyrotron tube pressure which are completely independent of the control system. These serve to shut down the high voltage power supply in the event of an emergency operating condition accompanied by a control system failure. The microwave power itself is monitored by millimeter-wave diodes mounted to a directional coupler, and the output of these diodes is amplified and conditioned by audio filtering near the source to minimize corruption during transmission to the control system.
The final hardware element is the control system computer itself. The control system, as shown in Figure A2, is implemented under LabView and makes use of an event-driven architecture to minimize the system overhead associated with rapid polling of the modules of the software program. Wherever possible, analog I/O occurs asynchronously, and the other execution elements read from a common buffer that is updated each time the I/O instructions are processed. In addition to the aforementioned hardware signal conditioning, the control system performs filtering on input signals to remove high frequency noise and power supply line noise, if necessary. The need for analog signal conditioning sets the minimum acceptable analog sampling rate and hence limits the frequency at which the control system can operate. The control system has different modes for startup, shutdown, and diagnostic operations, and each is characterized by a unique interface screen. Though not explicitly indicated, the system is also capable of logging the operating parameters of the gyrotron at configurable intervals. Finally, for diagnostic purposes, all alarms and safety interlocks can be overridden to prevent unintended triggering during tube conditioning or other abnormal operating circumstances. Specific results from the use of this control system, together with a procedure for calibrating its control model, have been provided in Section 5.6.
Footnotes
Publisher's Disclaimer: This is a PDF file of an unedited manuscript that has been accepted for publication. As a service to our customers we are providing this early version of the manuscript. The manuscript will undergo copyediting, typesetting, and review of the resulting proof before it is published in its final citable form. Please note that during the production process errors may be discovered which could affect the content, and all legal disclaimers that apply to the journal pertain.
References
- 1.Ernst RR, Anderson WA. Application of Fourier Transform Spectroscopy to Magnetic Resonance. Review of Scientific Instruments. 1966;37:93–102. [Google Scholar]
- 2.Styles P, Soffe N, Scott C, Cragg D, Row F, White D, White P. A High-Resolution NMR Probe in Which the Coil and Preamplifier are Cooled with Liquid Helium. Journal of Magnetic Resonance. 1984;60:397–404. doi: 10.1016/j.jmr.2011.09.002. [DOI] [PubMed] [Google Scholar]
- 3.Hartmann SR, Hahn EL. Double Resonance in the Rotating frame. Phys Rev. 1962;128:2042–2053. [Google Scholar]
- 4.Pines A, Gibby MG, Waugh JS. Proton-enhanced NMR of dilute spins in solids. J Chem Phys. 1973;59:569–590. [Google Scholar]
- 5.Morris G, Freeman R. Enhancement of Nuclear Magnetic Resonance Signals by Polarization Transfer. J Am Chem Soc. 1979;101:760–762. [Google Scholar]
- 6.Schaefer J, Stejskal EO. 13C Nuclear Magnetic Resonance of Polymers Spinning at the Magic Angle. J Am Chem Soc. 1976;98:1031–1032. [Google Scholar]
- 7.Cavanaugh J, Fairbrother WJ, Palmer A, RMJ, Skelton NJ. Protein NMR Spectroscopy: Principles and Practice. 2. San Diego, CA: Academic Press; 2006. [Google Scholar]
- 8.Overhauser AW. Polarization of Nuclei in Metals. Phys Rev. 1953;92:411–415. [Google Scholar]
- 9.Carver TR, Slichter CP. Experimental Verification of the Overhauser Nuclear Polarization Effect. Phys Rev. 1956;102:975–980. [Google Scholar]
- 10.Carver TR, Slichter CP. Polarization of Nuclear Spins in metals. Physical Review. 1953;92:212–213. [Google Scholar]
- 11.Duckett SB, Sleigh CJ. Applications of the parahydrogen phenomenon: A chemical perspective. Progress in Nuclear Magnetic Resonance Spectroscopy. 1999;34:71–92. [Google Scholar]
- 12.Natterer J, Bargon J. Parahydrogen induced polarization. Progress in Nuclear Magnetic Resonance Spectroscopy. 1997;31:293–315. [Google Scholar]
- 13.Navon G, Song YQ, Room T, Appelt S, Taylor RE, Pines A. Enhancement of solution NMR and MRI with laser-polarized xenon. Science. 1996;271:1848–1851. [Google Scholar]
- 14.Fitzgerald RJ, Sauer KL, Happer W. Cross-relaxation in laser-polarized liquid xenon. Chemical Physics Letters. 1998;284:87–92. [Google Scholar]
- 15.Cherubini A, Payne GS, Leach MO, Bifone A. Hyperpolarising C-13 for NMR studies using laser-polarised Xe-129: SPINOE vs thermal mixing. Chemical Physics Letters. 2003;371:640–644. [Google Scholar]
- 16.Pavlovskaya GE, Cleveland ZI, Stupic KF, Basaraba RJ, Meersmann T. Hyperpolarized krypton-83 as a contrast agent for magnetic resonance imaging. Proceedings of the National Academy of Sciences of the United States of America. 2005;102:18275–18279. doi: 10.1073/pnas.0509419102. [DOI] [PMC free article] [PubMed] [Google Scholar]
- 17.Goto A, Hashi K, Shimizu T, Miyabe R, Wen XG, Ohki S, Machida S, Iijima T, Kido G. Optical pumping NMR in the compensated semiconductor InP: Fe. Physical Review B. 2004;69 [Google Scholar]
- 18.Barrett SE, Tycko R, Pfeiffer LN, West KW. Directly Detected Nuclear-Magnetic-Resonance of Optically Pumped Gaas Quantum-Wells. Physical Review Letters. 1994;72:1368–1371. doi: 10.1103/PhysRevLett.72.1368. [DOI] [PubMed] [Google Scholar]
- 19.Michal CA, Tycko R. Nuclear spin polarization transfer with a single radio-frequency field in optically pumped indium phosphide. Physical Review Letters. 1998;81:3988–3991. [Google Scholar]
- 20.Zysmilich MG, McDermott A. Photochemically induced nuclear spin polarization in bacterial photosynthetic reaction centers: Assignments of the N-15 SSNMR spectra. Journal of the American Chemical Society. 1996;118:5867–5873. [Google Scholar]
- 21.Polenova T, McDermott AE. A coherent mixing mechanism explains the photoinduced nuclear polarization in photosynthetic reaction centers. Journal of Physical Chemistry B. 1999;103:535–548. [Google Scholar]
- 22.Prakash S, Alia P, Gast HJM, de Groot G, Jeschke, Matysik J. Magnetic field dependence of photo-CIDNP MAS NMR on photosynthetic reaction centers of Rhodobacter sphaeroides WT. Journal of the American Chemical Society. 2005;127:14290–14298. doi: 10.1021/ja054015e. [DOI] [PubMed] [Google Scholar]
- 23.Goez M, Mok KH, Hore PJ. Photo-CIDNP experiments with an optimized presaturation pulse train, gated continuous illumination, and a background-nulling pulse grid. Journal of Magnetic Resonance. 2005;177:236–246. doi: 10.1016/j.jmr.2005.06.015. [DOI] [PubMed] [Google Scholar]
- 24.Hausser KH, Stehlik D. Dynamic Nuclear Polarization in Liquids. Advances in Magnetic Resonance. 1968;3:79. [Google Scholar]
- 25.Müller-Warmuth W, Meise-Gresch K. Molecular Motions and Interactions as Studied by Dynamic Nuclear Polarization in Free Radical Solutions. Advances in Magnetic Resonance. 1983;11:1–45. [Google Scholar]
- 26.Atsarkin VA. Dynamic Polarization of Nuclei in Solid Dielectrics. Soviet Physics Solid State. 1978;21:725–744. [Google Scholar]
- 27.Wind RA. Applications of Dynamic Nuclear Polarization in 13C NMR in Solids. Progress in NMR Spectroscopy. 1985;17:33–67. [Google Scholar]
- 28.Becerra LR, Gerfen GJ, Temkin RJ, Singel DJ, Griffin RG. Dynamic Nuclear Polarization with a Cyclotron Resonance Maser at 5 T. Physical Review Letters. 1993;71:3561–3564. doi: 10.1103/PhysRevLett.71.3561. [DOI] [PubMed] [Google Scholar]
- 29.Gerfen GJ, Becerra LR, Hall DA, Singel DJ, Griffin RG. High Frequency (140 GHz) Dynamic Nuclear Polarization: Polarization Transfer to a Solute in Frozen Aqueous Solution. J Chem Phys. 1995;102:9494. [Google Scholar]
- 30.Becerra LR, Gerfen GJ, Bellew BF, Bryant JA, Hall DA, Inati SJ, Weber RT, Un S, Prisner TF, McDermott AE, Fishbein KW, Kreischer KE, Temkin RJ, Singel DJ, Griffin RG. A Spectrometer for Dynamic Nuclear Polarization and Electron Paramagnetic Resonance at High Frequencies. J Magn Reson A. 1995;117:28–40. [Google Scholar]
- 31.Felch KL, Danly BG, Jory HR, Kreischer KE, Lawson W, Levush B, Temkin RJ. Characteristics and Applications of Fast-Wave Gyrodevices. Proceedings of the IEEE. 1999;87:752–781. [Google Scholar]
- 32.Idehara T, Tsuchiya H, Watanabe O, Agusu L, Mitsudo S. The First Experiment of a THz Gyrotron with a Pulse Magnet. Intl J Infrared and Millimeter Waves. 2006;27:319–331. [Google Scholar]
- 33.Joye CD, Griffin RG, Hornstein MK, Hu KN, Kreischer KE, Rosay M, Shapiro MA, Sirigiri JR, Temkin RJ, Woskov PP. Operational Characteristics of a 14 Watt, 140 GHz Gyrotron for Dynamic Nuclear Polarization. IEEE Transactions on Plasma Science. 2006;34:518–523. doi: 10.1109/TPS.2006.875776. [DOI] [PMC free article] [PubMed] [Google Scholar]
- 34.Hu K, Yu Y-y, Swager T, Griffin RG. Dynamic Nuclear Polarization with Biradicals. J Am Chem Soc. 2004;126:10844–10845. doi: 10.1021/ja039749a. [DOI] [PubMed] [Google Scholar]
- 35.Joo CG, Hu KN, Bryant JA, Griffin RG. In Situ Temperature Jump High-Frequency Dynamic Nuclear Polarization Experiments: Enhanced Sensitivity in Liquid-State NMR Spectroscopy. J Am Chem Soc. 2006;128:9428–9432. doi: 10.1021/ja0611947. [DOI] [PubMed] [Google Scholar]
- 36.Song C, Hu KN, Swager TM, Griffin RG. TOTAPOL – A Biradical Polarizing Agent for Dynamic Nuclear Polarization Experiments in Aqueous Media. J Am Chem Soc. 2006;128:11385–90. doi: 10.1021/ja061284b. [DOI] [PubMed] [Google Scholar]
- 37.van der Wel PCA, Hu KN, Lewandoswki J, Griffin RG. Dynamic Nuclear Polarization of Amyloidogenic Peptide Nanocrystals: GNNQQNY, a Core Segment of the Yeast Prion Protein Sup35p. J Am Chem Soc. 2006;128:10840–10846. doi: 10.1021/ja0626685. [DOI] [PubMed] [Google Scholar]
- 38.Hu KN, V, Bajaj S, Rosay MM, Griffin RG. High Frequency Dynamic Nuclear Polarization Using Mixtures of TEMPO and Trityl Radicals. J Chem Phys. 2007;126:044512. doi: 10.1063/1.2429658. [DOI] [PubMed] [Google Scholar]
- 39.Hu KN, Griffin RG. Quantum Mechanical Theory of Dynamic Nuclear Polarization in Solid Dielectrics –Simulation of Electron-Electron-Nucleus Spin Systems with Relaxation. J Chem Phys. 2007 doi: 10.1063/1.3564920. (submitted for publication) [DOI] [PMC free article] [PubMed] [Google Scholar]
- 40.Hu KN, Griffin RG. Quantum Mechanical Theory of Dynamic Nuclear Polarizaton in Solid Dielectrics: I- Analytical Approach. J Chem Phys. 2007 doi: 10.1063/1.3564920. (submitted for publication) [DOI] [PMC free article] [PubMed] [Google Scholar]
- 41.Hu K-N, Song C, Yu H-h, Swager TM, Griffin RG. High-Frequency Dynamic Nuclear Polarization Using Biradicals: A Multifrequency EPR Lineshape Analysis. J Chem Phys. 2007 doi: 10.1063/1.2816783. (submitted for publication) [DOI] [PubMed] [Google Scholar]
- 42.Rosay M, Lansing JC, Haddad KC, Bachovchin WW, Herzfeld J, Temkin RJ, Griffin RG. High Frequency Dynamic Nuclear Polarization in MAS Spectra of Membrane and Soluble Proteins. J Am Chem Soc. 2003;125:13626–27. doi: 10.1021/ja036898k. [DOI] [PubMed] [Google Scholar]
- 43.Hall DA, Maus DC, Gerfen GJ, Inati SJ, Becerra LR, Dahlquist FW, Griffin RG. Polarization-Enhanced NMR Spectroscopy of Biomolecules in Frozen Solution. Science. 1997;276:930–932. doi: 10.1126/science.276.5314.930. [DOI] [PubMed] [Google Scholar]
- 44.Kreischer KE, Farrar C, Griffin RG, Temkin RJ, Vieregg J. Development of a 250 GHz CW Gyrotron for EPR and NMR Spectroscopy. Proceedings of the 24th International Conference on Infrared and Millimeter Waves; Monterey, CA: UC Davis; 1999. [Google Scholar]
- 45.Hornstein MK. Electrical Engineering and Computer Science. Mass. Institute of Technology; Cambridge, MA 02139: 2005. A Continuous-Wave Second Harmonic Gyrotron Oscillator at 460 GHz; p. 266. [Google Scholar]
- 46.Hornstein MK, V, Bajaj S, Griffin RG, Kreischer KE, Mastovsky I, Shapiro MA, Sirigiri JR, Temkin RJ. Second Harmonic Operation at 460 GHz and Broadband Continuous Frequency Tuning of a Gyrotron Oscillator. IEEE Transactions on Electron Devices. 2005;52:798–807. [Google Scholar]
- 47.Hornstein MK, V, Bajaj S, Griffin RG, Temkin RJ. Continuous-wave operation of a 460-GHz second harmonic gyrotron oscillator. IEEE Transactions on Plasma Science. 2006;34:524–533. doi: 10.1109/TPS.2006.875769. [DOI] [PMC free article] [PubMed] [Google Scholar]
- 48.Hornstein MK, V, Bajaj S, Griffin RG, Temkin RJ. Efficient low-voltage operation of a CW gyrotron oscillator at 233 GHz. Ieee Transactions on Plasma Science. 2007;35:27–30. doi: 10.1109/TPS.2006.889295. [DOI] [PMC free article] [PubMed] [Google Scholar]
- 49.Rosay M, Weis V, Kreischer KE, Temkin RJ, Griffin RG. Two-dimensional 13C–13C correlation spectroscopy with magic angle spinning and dynamic nuclear polarization. Journal of the American Chemical Society. 2002;124:3214–3215. doi: 10.1021/ja0176752. [DOI] [PubMed] [Google Scholar]
- 50.Bajaj VS, Farrar CT, Hornstein MK, Mastovsky I, Vieregg J, Bryant J, Elena B, Kreischer KE, Temkin RJ, Griffin RG. Dynamic nuclear polarization at 9T using a novel 250 GHz gyrotron microwave source. J Mag Res. 2003;160:85–90. doi: 10.1016/j.jmr.2011.09.010. [DOI] [PubMed] [Google Scholar]
- 51.Lansbury PT, Costa PR, Griffiths JM, Simon EJ, Auger M, Halverson KJ, Kocisko DA, Hendsch ZS, Ashburn TT, Spencer RGS, Tidor B, Griffin RG. Structural Model for the b Amyloid Fibril: Interstrand Alignment of an Antiparallel b Sheet Comprising a C-terminal Peptide. 1995;2:990–997. doi: 10.1038/nsb1195-990. [DOI] [PubMed] [Google Scholar]
- 52.Jaroniec CP, MacPhee CE, Astrof NS, Dobson CM, Griffin RG. Molecular Conformation of a Peptide Fragment of Transthyretin in an Amyloid Fibril. Proc Nat’l Acad Sci. 2002;99:16748–16753. doi: 10.1073/pnas.252625999. [DOI] [PMC free article] [PubMed] [Google Scholar]
- 53.Jaroniec CP, MacPhee CE, Bajaj VS, McMahon MT, Dobson CM, Griffin RG. High Resolution Molecular Structure of a Peptide in an Amyloid Fibril Determined by MAS NMR Spectroscopy. Proc Nat’l Acad Sci. 2004;101:711–716. doi: 10.1073/pnas.0304849101. [DOI] [PMC free article] [PubMed] [Google Scholar]
- 54.Siemer AB, Ritter C, Ernst M, Riek R, Meier BH. High-Resolution Solid-State NMR Spectroscopy of the Prion Protein HET-s in Its Amyloid Conformation. Angew Chem Int Ed. 2005;44:2–5. doi: 10.1002/anie.200462952. [DOI] [PubMed] [Google Scholar]
- 55.Tycko R. Insights into the Amyloid Folding Problem from Solid-State NMR. Biochemistry. 2003;42:3151–3159. doi: 10.1021/bi027378p. [DOI] [PubMed] [Google Scholar]
- 56.Heise H, Hoyer W, Andronesi BSO, Riedel D, Baldus M. Molecular-level secondary structure, polymorphism, and dynamics of full-length alpha-synuclein fibrils studied by solid-state NMR. Proc Natl Acad Sci U S A. 2005;102:15871–76. doi: 10.1073/pnas.0506109102. [DOI] [PMC free article] [PubMed] [Google Scholar]
- 57.van der Wel PCA, Lewandoswki J, Griffin RG. Solid state NMR study of amyloid nanocrystals and fibrils formed by the peptide GNNQQNY from yeast prion protein Sup35p. J Am Chem Soc. 2007 doi: 10.1021/ja068633m. (in press) [DOI] [PubMed] [Google Scholar]
- 58.Harbison GS, Herzfeld J, Griffin RG. Solid-State 15N Nuclear Magnetic-Resonance Study of the Schiff-Base in Bacteriorhodopsin. Biochemistry. 1983;22:1–5. doi: 10.1021/bi00270a600. [DOI] [PubMed] [Google Scholar]
- 59.Harbison GS, Smith SO, Pardoen JA, Courtin JML, Lugtenburg J, Herzfeld J, Mathies RA, Griffin RG. Solid-State C-13 Nmr Detection of a Perturbed 6-S-Trans Chromophore in Bacteriorhodopsin. Biochemistry. 1985;24:6955–6962. doi: 10.1021/bi00345a031. [DOI] [PubMed] [Google Scholar]
- 60.Harbison GS, Roberts JE, Herzfeld J, Griffin RG. Solid-State Nmr Detection of Proton-Exchange between the Bacteriorhodopsin Schiff-Base and Bulk Water. Journal of the American Chemical Society. 1988;110:7221–7223. [Google Scholar]
- 61.Griffiths JM, Lakshmi KV, Bennett AE, Raap J, Vanderwielen CM, Lugtenburg J, Herzfeld J, Griffin RG. Dipolar Correlation NMR-Spectroscopy of a Membrane-Protein. J Am Chem Soc. 1994;116:10178–10181. [Google Scholar]
- 62.Hu JG, Griffin RG, Herzfeld J. Synergy in the Spectral Tuning of Retinal Pigments - Complete Accounting of the Opsin Shift in Bacteriorhodopsin. Proceedings of the National Academy of Sciences of the United States of America. 1994;91:8880–8884. doi: 10.1073/pnas.91.19.8880. [DOI] [PMC free article] [PubMed] [Google Scholar]
- 63.Jaroniec CP, Lansing JC, Tounge BA, Belenky M, Herzfeld J, Griffin RG. Measurement of dipolar couplings in a uniformly C-13,N-15- labeled membrane protein: Distances between the Schiff base and aspartic acids in the active site of bacteriorhodopsin. Journal of the American Chemical Society. 2001;123:12929–12930. doi: 10.1021/ja016923r. [DOI] [PubMed] [Google Scholar]
- 64.Cross Ta, Opella SJ. Solid-State Nmr Structural Studies of Peptides and Proteins in Membranes. Current Opinion in Structural Biology. 1994;4:574–581. [Google Scholar]
- 65.Chekmenev EY, Waddell KW, Hu J, Gan ZH, Wittebort RJ, Cross TA. Ion-binding study by O-17 solid-state NMR spectroscopy in the model peptide gly-gly-gly at 19.6 T. Journal of the American Chemical Society. 2006;128:9849–9855. doi: 10.1021/ja060191r. [DOI] [PubMed] [Google Scholar]
- 66.Denny JK, Wang JF, Cross TA, Quine JR. PISEMA powder patterns and PISA wheels. Biophysical Journal. 2001;80:370A–370A. doi: 10.1006/jmre.2001.2405. [DOI] [PubMed] [Google Scholar]
- 67.Cross TA, Arseniev A, Cornell BA, Davis JH, Killian JA, Koeppe RE, Nicholson LK, Separovic F, Wallace BA. Gramicidin channel controversy - revisited. Nature Structural Biology. 1999;6:610–611. doi: 10.1038/10650. [DOI] [PubMed] [Google Scholar]
- 68.Pascal SM, Cross TA. Structure of an Isolated Gramicidin-a Double Helical Species by High-Resolution Nuclear-Magnetic-Resonance. Journal of Molecular Biology. 1992;226:1101–1109. doi: 10.1016/0022-2836(92)91055-t. [DOI] [PubMed] [Google Scholar]
- 69.Salgado GFJ, Struts AV, Tanaka K, Krane S, Nakanishi K, Brown MF. Solid-state H-2 NMR structure of retinal in metarhodopsin I. Journal of the American Chemical Society. 2006;128:11067–11071. doi: 10.1021/ja058738+. [DOI] [PubMed] [Google Scholar]
- 70.Kobayashi M, Fujiwara T, Brown MF, Akutsu H. Solid-state H-2 NMR studies of DMPC membranes containing subunit c of E. Coli ATP synthase. Biophysical Journal. 2005;88:141A–141A. [Google Scholar]
- 71.Salgado GFJ, Struts AV, Tanaka K, Fujioka N, Krane S, Nakanishi K, Brown MF. Deuterium solid-state NMR of aligned rhodopsin: POPC membranes sheds new light on retinal conformation. Biophysical Journal. 2005;88:203A–204A. [Google Scholar]
- 72.Subramaniam V, I, Alves D, Salgado GFJ, Lau PW, Wysocki RJ, Salamon Z, Tollin G, Hruby VJ, Brown MF, Saavedra SS. Rhodopsin reconstituted into a planar-supported lipid bilayer retains photoactivity after cross-linking polymerization of lipid monomers. Journal of the American Chemical Society. 2005;127:5320–5321. doi: 10.1021/ja0423973. [DOI] [PubMed] [Google Scholar]
- 73.Zhang WY, Sato T, Smith SO. NMR spectroscopy of basic/aromatic amino acid clusters in membrane proteins. Progress in Nuclear Magnetic Resonance Spectroscopy. 2006;48:183–199. [Google Scholar]
- 74.Crocker E, Eilers M, Ahuja S, Hornak V, Hirshfeld A, Sheves M, Smith SO. Location of Trp265 in metarhodopsin II: Implications for the activation mechanism of the visual receptor rhodopsin. Journal of Molecular Biology. 2006;357:163–172. doi: 10.1016/j.jmb.2005.12.046. [DOI] [PubMed] [Google Scholar]
- 75.Smith SO. Solid-state NMR approaches for probing the structure and dynamics of membrane proteins. Biophysical Journal. 2005;88:542A–542A. [Google Scholar]
- 76.Bajaj VS, Mak-Jurkauskas ML, Belenky ML, Herzfeld J, Griffin RG. Conformational heterogeneity in the early intermediates of the bacteriorhodopsin photocycle. 2007 Submitted for publication. [Google Scholar]
- 77.Mak-Jurkauskas ML, Bajaj VS, Hornstein MK, Temkin RJ, Griffin RG, Herzfeld J. Gradual winding of the bacteriorhodopsin chromophore in the first half of Its ion-motive photocycle: A dynamic nuclear polarization-enhanced solid state NMR study. 2007 Submitted. [Google Scholar]
- 78.Hu JG, Sun BQ, Griffin RG, Herzfeld J. Solid state NMR study of the L-intermediate in bacteriorhodopsin. Biophysical Journal. 1996;70:SU432–SU432. [Google Scholar]
- 79.Hu JG, Griffin RG, Herzfeld J. Interactions between the protonated Schiff base and its counterion in the photointermediates of bacteriorhodopsin. J Am Chem Soc. 1997;119:9495–9498. [Google Scholar]
- 80.Balashov SP, Ebrey TG. Trapping and spectroscopic identification of the photointermediates of bacteriorhodopsin at low temperatures. Photochemistry and Photobiology. 2001;75:453–62. doi: 10.1562/0031-8655(2001)073<0453:tasiot>2.0.co;2. [DOI] [PubMed] [Google Scholar]
- 81.Bajaj VS, Farrar CT, Mastovsky I, Vieregg J, Bryant J, Elena B, Kreischer KE, Temkin RJ, Griffin RG. Dynamic nuclear polarization at 9T using a novel 250 GHz gyrotron microwave source. Journal of Magnetic Resonance. 2003;160:85–90. doi: 10.1016/j.jmr.2011.09.010. [DOI] [PubMed] [Google Scholar]
- 82.Bennett AE, Ok JH, Griffin RG, Vega S. Chemical-Shift Correlation Spectroscopy in Rotating Solids - Radio Frequency-Driven Dipolar Recoupling and Longitudinal Exchange. Journal of Chemical Physics. 1992;96:8624–8627. [Google Scholar]
- 83.Bennett AE, Rienstra CM, Griffiths JM, Zhen WG, Lansbury PT, Griffin RG. Homonuclear radio frequency-driven recoupling in rotating solids. Journal of Chemical Physics. 1998;108:9463–9479. [Google Scholar]
- 84.Takegoshi K, Nakamura S, Terao T. C-13-H-1 dipolar-assisted rotational resonance in magic-angle spinning NMR. Chemical Physics Letters. 2001;344:631–637. doi: 10.1063/1.2364503. [DOI] [PubMed] [Google Scholar]
- 85.Morcombe CR, Gaponenko V, Byrd RA, Zilm KW. C-13 CPMAS spectroscopy of deuterated proteins: CP dynamics, line shapes, and T-1 relaxation. Journal of the American Chemical Society. 2005;127:397–404. doi: 10.1021/ja045581x. [DOI] [PubMed] [Google Scholar]
- 86.Brand GF, Gross M. Continuously Tunable Split-Cavity Gyrotrons. International Journal of Infrared and Millimeter Waves. 1985;6:1237–54. [Google Scholar]
- 87.Ardenkjær-Larsen JH, Fridlund B, Gram A, Hansson G, Hansson L, Lerche MH, Servin R, Thaning M, Golman K. Increase in signal-to-noise ratio of >10,000 times in liquid-state NMR. Proc Nat’l Acad Sci USA. 2003;100:10158–10163. doi: 10.1073/pnas.1733835100. [DOI] [PMC free article] [PubMed] [Google Scholar]
- 88.Degroot HJM, Harbison GS, Herzfeld J, Griffin RG. Nuclear Magnetic-Resonance Study of the Schiff-Base in Bacteriorhodopsin - Counterion Effects on the N-15 Shift Anisotropy. Biochemistry. 1989;28:3346–3353. doi: 10.1021/bi00434a033. [DOI] [PubMed] [Google Scholar]
- 89.Morcombe CR, Gaponenko V, Byrd RA, Zilm KW. Diluting abundant spins by isotope edited radio frequency field assisted diffusion. Journal of the American Chemical Society. 2004;126:7196–7197. doi: 10.1021/ja047919t. [DOI] [PubMed] [Google Scholar]
- 90.Friedman N, Ottolenghi M, Sheves M. Heterogeneity Effects in the Binding of all-trans Retinal to Bacterio-opsin. Biochemistry. 2003;42:11281–88. doi: 10.1021/bi035011u. [DOI] [PubMed] [Google Scholar]
- 91.McKay RA. Probes for Special Purposes. In: Grant DM, Harris R, editors. Encyclopedia of Nuclear Magnetic Resonance. John Wiley and Sons; New York: 1996. pp. 3768–71. [Google Scholar]
- 92.Schaefer J, McKay RA. Multituned Single Coil Transmission Line Probe for Nuclear Magnetic Resonance Spectrometer. United States: 1999. [Google Scholar]
- 93.Woskov PW, V, Bajaj S, Hornstein MK, Temkin RJ, Griffin RG. Corrugated Waveguide and Directional Coupler for CW 250 GHz Gyrotron DNP Experiments. IEEE Transactions on Microwave Theory and Techniques. 2005;53:1863–69. doi: 10.1109/TMTT.2005.848097. [DOI] [PMC free article] [PubMed] [Google Scholar]
- 94.Nusinovich GS. Introduction to the Physics of Gyrotrons. Baltimore, MD 21218–4363: Johns Hopkins University Press; 2004. p. 335. [Google Scholar]
- 95.Kartikeyan MV, Borie E, Thumm MKA. Gyrotrons: High Power Microwave Sources and Technologies. New York: Springer; 2004. p. 227. [Google Scholar]
- 96.Nusinovich GS, Barker RJ, Luhmann NC, Booske JH. Microwave and Millimeter-Wave Power Electronics. Wiley-IEEE Press; 2005. p. 872. Modern. [Google Scholar]
- 97.Cairns RA, Phelps ADR. Generation and Application of High Power Microwaves. London: Taylor & Francis; 1997. [Google Scholar]
- 98.Granatstein VL, Alexeff I. High-Power Microwave Sources. Artech House Publishers; 1987. [Google Scholar]
- 99.Edgcombe CJ. Gyrotron Oscillators: Their Principles and Practice. CRC Press; 1993. p. 423. [Google Scholar]
- 100.Idehara T, Ogawa I, Mitsudo S, Pereyaslavets M, Nishida N, Yoshida K. Development of Frequency Tunable, Medium Power Gyrotrons (Gyrotron FU Series) as Submillimeter Wave Radiation Sources. IEEE Trans Plasma Sci. 1999;27:340–354. [Google Scholar]
- 101.Mitsudo S, Shirai AT, Matsuda T, Kanemaki T, Idehara T. High power, frequency tunable, submillimeter wave ESR device using a gyrotron as a radiation source. Int J Infrared Millim Waves. 2000;21:661–676. [Google Scholar]
- 102.Ogawa I, Yoshisue K, Ibe H, Idehara T, Kawahata K. Long-Pulse operation of a submillimiter wave gyrotron and its application to plasma scattering measurement. Rev Sci Instrum. 1994;65:1788–1789. [Google Scholar]
- 103.Griffiths DJ. Introduction to Quantum Mechanics, 2e. Upper Saddle River, NJ: Pearson Prentice Hall; 2005. p. 468. [Google Scholar]
- 104.Gasiorowicz S. Quantum Physics. 3e. John Wiley and Sons; 2003. [Google Scholar]
- 105.Schneider J. Stimulated Emission of Radiation by Relativistic Electrons in a Magnetic Field. Phys Rev Letters. 1959;2:504–505. [Google Scholar]
- 106.Robinson LC. Methods of Experimental Physics. Academic Press; New York: 1973. Physical Principles of Far-infrared Radiation; pp. 230–264. [Google Scholar]
- 107.Sokolov AA, Ternov IM. American Institute of Physics Translation Series. New York: American Institute of Physics; 1986. Radiation from Relativistic Electrons. [Google Scholar]
- 108.Sirigiri JR. Electrical Engineering and Computer Science. MIT; 2002. PhD Thesis. [Google Scholar]
- 109.Kreischer KE, Danly BG, Woskoboinikow P, Mulligan WJ, Temkin RJ. Frequency Pulling and Bandwidth Measurements of a 140 GHz Pulsed Gyrotron. Int J Electronics. 1984;57:851–862. [Google Scholar]
- 110.Fliflet aW, Read ME, Chu KR, Seeley R. A Self-Consistent Field-Theory for Gyrotron Oscillators - Application to a Low Q Gyromonotron. International Journal of Electronics. 1982;53:505521. [Google Scholar]
- 111.Brand GF, Douglas NG, Gross M, Ma JYL, Zhiyi C. Frequency Detuning Measurements in a Low-Power Gyrotron. International Journal of Infrared and Millimeter Waves. 1983;4:891–900. [Google Scholar]
- 112.Botton M, Antonsen TM, Levush B, Nguyen KT, Vlasov AN. MAGY: A Time-Dependent Code for Simulation of Slow and Fast Microwave Sources. IEEE Trans Plasma Sci. 1998;26:882–892. [Google Scholar]
- 113.Woskoboinikow P. Development of Gytotrons for Plasma Diagnostics. Rev Sci Instrum. 1986;57:2113–18. [Google Scholar]
- 114.Machuzak JS, Woskoboinikow P, Mulligan WJ, Cohn DR, Gerver M, Guss W, Mauel M, Post RS, Temkin RJ. 137-GHz gyrotron diagnostic for instability studies in Tara. Rev Sci Instrum. 1986;57:1983–85. [Google Scholar]
- 115.Nusinovich GS, Dumbrajs O. Technical noise in gyroklystrons and phase-locked gyrotron oscillators. Phys Plasmas. 1997;4:1424–33. [Google Scholar]
- 116.Dumbrajs O, Nusinovich GS. Effect of technical noise on radiation linewidth in free-running gyrotron oscillators. Phys Plasmas. 1997;4:1413–23. [Google Scholar]
- 117.Okoshi T, Kikushi K, Nakayama A. Novel method for high resolution measurement of laser output spectrum. Elect Lett. 1980;16:630631. [Google Scholar]
- 118.Carmel Y, Chu KR, Read ME, Granatstein VL, Faillon G, Boulanger P, Kammerer E, Mourier G. A Technique to Identify Electromagnetic Modes in Oversize Waveguides. IEEE Transactions on Microwave Theory and Techniques. 1984;32:1493–95. [Google Scholar]
- 119.Azar K, Benson JR, Manno VP. Liquid crystal imaging for temperature measurement of electronic devices. Proceedings Seventh Annual IEEE Semiconductor Thermal Measurement and Management Symposium (Cat. No.91CH29728); Phoenix, AZ. 1991. [Google Scholar]
- 120.Farina DJ. Making Surface Temperature Measurements Using Liquid Crystal Thermography. Electronics Cooling. 1995;1:10–15. [Google Scholar]
- 121.Goodwin GC, Graebe SF, Salgado ME. Control System Design. Prentice Hall PTR; 2001. [Google Scholar]
- 122.Yeddulla M, Nusinovich GS, Antonsen TM. Start currents in an overmoded gyrotron. Phys Plasmas. 2003;10:4513–4520. [Google Scholar]


