

Abstract
Reactive astrocytes influence not only the severity of brain injury, but also the capacity of brain to reshape itself with learning. Mechanisms responsible for astrogliosis remain unknown but might be best studied in vitro, where improved access and visualization permit application of modern molecular and cellular techniques. We have begun to explore whether gliosis might be studied in hippocampal organotypic cultures (HOTCs), where potential cell-to-cell interactions are preserved and the advantages of an in vitro preparation are still realized. Following HOTC exposure to N-methyl-D-aspartate (NMDA), dose-dependent changes occurred in the optical density (OD) values for the astrocytic immunohistochemical [immunostaining (IS)] markers glial fibrillary acidic protein (GFAP) and vimentin. Exposure of HOTCs to NMDA (10 μM) caused selective death in the CA1 hippocampal region and the dentate gyrus. It also significantly increased GFAP IS and vimentin IS OD values in these regions. Increased GFAP IS and vimentin IS OD values were also seen in CA3 a hippocampal region that displayed no cell death. Light microscopic examination revealed hypertrophied GFAP and vimentin IS cells, characteristic of reactive astrocytes. Cellular proliferation, as assessed by proliferating cell nuclear antigen IS, was also significantly increased in all three of these hippocampal regions. In contrast, exposure of HOTCs to a noninjurious level of NMDA (1 μM) caused only minor changes in GFAP IS and vimentin IS OD values but a significantly reduced cellular proliferation in all HOTC regions. These results show that reactive astrocytosis from excitotoxic injury of HOTC parallels changes seen in vivo after global ischemia. Furthermore, since resting astroglia within HOTCs are also similar to their counterparts in vivo, HOTCs may be used to examine mechanisms by which these cells are transformed into reactive species within tissue that resembles intact brain.
Keywords: Astrocytes, Astrogliosis, Glial fibrillary acidic protein, Hippocampal organotypic culture, N-Methyl-D-aspartate, Selective neuronal vulnerability
Reactive astrocytosis from ischemic injury is defined by an increase in glial fibrillary acidic protein (GFAP) immunostaining (IS) plus an increase in the size and/or number of these cells (Petito et al., 1990). These morphologic changes probably are accompanied by similarly dramatic transformations in the functional capacities of astrocytes. Reactive astrocytes, for example, may not only enhance but also limit the ultimate severity of brain injury (Kraig et al., 1995). In addition, reactive astrocytosis may play a role in physiologic processes such as motor learning (Anderson et al., 1994).
In spite of the potential widespread significance of astrogliosis, mechanisms responsible for glial activation and the physiologic changes that accompany it are incompletely defined. This lack stems in part from the paucity of biological models available to study specific cellular changes associated with the phenomenon. Whole animals have been used to study astrogliosis. Their use ranges from traumatic injury of a needle stab (Bignami and Dahl, 1976) or a denervating lesion (Hajos et al., 1990) to neuronal injury from global ischemia (Petito et al., 1990) or seizure activity (Steward et al., 1991) and neural injury from focal ischemia (Chen et al., 1993). In addition, neuronal injury alone is clearly not needed for astrocytes to be transformed to reactive cells. Spreading depression (SD), a process lacking irreversible cell injury, can also induce astrogliosis (R. P. Kraig et al., 1991, unpublished) and has been used to examine mechanisms of gliosis (Caggiano and Kraig, 1996). Unfortunately, the utility of whole-animal studies is diminished by technical limitations. For example, the interstitial environment around specific cells is difficult to control and analyze. Furthermore, functional and anatomical changes from identified individual cells are exceedingly difficult to follow in space and time. These two major technical limitations can be alleviated through use of primary astrocytic cultures. Indeed, astrocytic cultures have been used extensively to study gliosis (Lindsay, 1986). Unfortunately, astrocytes in primary culture may not mature as far as their counterparts do in vivo. For example, astrocytes in primary culture continue to express vimentin (De Vellis et al., 1986). Thus, astrocytes in primary culture may already be “reactive” (Kraig et al., 1995). In addition and perhaps most importantly, cell-to-cell interactions that necessarily occur in vivo are obviously absent in primary cultures. These important advantages and disadvantages of current in vivo and in vitro gliosis models warrant a search for an alternative that affords the advantages of both preparations without the disadvantages of either system.
Hippocampal organotypic cultures (HOTCs) may provide an advantageous blend of existing gliosis models. HOTCs can be maintained in vitro for many months (Bahr, 1995). Importantly, cells within HOTCs maintain cell-to-cell relations seen in vivo (Gahwiler, 1981, 1984; Stoppini et al., 1991; Buchs et al., 1993; Frotscher et al., 1995). Furthermore, neuronal activities in HOTCs parallel those seen in vivo. Evoked electrophysiologic activity (Gahwiler, 1984; Stoppini et al., 1991; Muller et al., 1993; Hajos et al., 1994), electrographic seizures (Fowler et al., 1986), and SD (Kunkler and Kraig, 1995b) seen in HOTCs are similar in their respective counterparts within the hippocampus in vivo. Finally, immunohistochemical characterization of HOTC glia shows that these cells also resemble morphologically and immunohistochemically their in vivo counterparts (Del Rio et al., 1991; Berger and Frotscher, 1994; Kunkler and Kraig, 1995a, 1995b). HOTC astrocytes become progressively negative over weeks for vimentin and positive for GFAP. Similarly, oligodendrocytes (e.g., galactocerebroside-positive cells) are increasingly evident with age. Microglia are mostly ramified and positive for the complement receptor 3 (e.g., OX-42) as opposed to ameboid and positive for OX-18 or OX-6, antibodies that recognize major histocompatibility complexes I and II, respectively. Thus, HOTCs possess anatomical and functional characteristics consistent with those found within the intact hippocampus.
Here we demonstrate that astrogliosis from excitotoxic injury in HOTCs shows many similarities to the glial response seen after global ischemic injury in vivo (Petito et al., 1990: Petito and Halaby, 1993). Portions of these results have appeared in preliminary form (Kunkler and Kraig, 1995a, 1995b).
METHODS
HOTC preparation and maintenance
HOTCs were prepared according to Stoppini et al. (1991). Wistar rat pups (6–9 days old) were anesthetized with halothane via inhalation in a closed container. When motionless, animals were decapitated. Their brains were removed aseptically and placed in sterile Gey’s Balanced Salt Solution (GBSS) supplemented with D-glucose (6.5 mg/ml) that was maintained at 3°C. Hippocampi were isolated and placed on a Teflon tissue chopper disk layered previously with freshly prepared, sterile, 3% agar/150 mM NaCl. Hippocampi were then sectioned perpendicularly to their septotemporal axis (400 μm thick) with a McIlwain tissue chopper (Mickle Laboratory Engineering Co., Gomshall, Surrey, England). Sectioned hippocampi with their underlying agar support were removed from the disk, placed in fresh GBSS at 3°C, and gently separated. Slices that showed a complete pyramidal cell layer and intact dentate gyrus (DG) were transferred to uncoated 30-mm Millicell-CM tissue culture inserts (Millipore Corp., Bedford, MA, U.S.A.). Inserts were preequilibrated with medium by surrounding individual inserts with 1.3 ml each of medium in six-well culture dishes (Becton Dickinson, Lincoln Park, NJ, U.S.A.). This moistened the porous surface of the inserts without establishing a standing fluid level within them. Culture dishes and associated inserts were kept at 37°C with 5% CO2 balance humidified air in a standard incubator (Heraeus Instruments, South Plainfield, NJ, U.S.A.). Seven- to eight-slice cultures were placed on each insert and maintained in vitro for at least 3 weeks. Medium around HOTCs was replaced twice a week (1.2 ml) and contained Basal Medium Eagle Medium (50%), Earle’s Balanced Salt Solution (25%), horse serum (23%), 25 units/ml penicillin/streptomycin, 1 mM L-glutamine, supplemented with additional D-glucose to a final concentration of 7.5 mg/ml (Pozzo Miller et al., 1994). All tissue culture reagents were obtained from Gibco Co. (Grand Island, NY, U.S.A.). Approximately 15–18 cytoarchitecturally intact sections were obtained from each rodent pup. However, the yield per animal varied with the age/weight of pups. Highest yields came from pups that were at least 6 days old and weighed ≥12 g.
Induction and confirmation of neural injury from N-methyl-D-aspartate
HOTCs underwent an initial screening for cell viability after 21 days in vitro using a sensitive fluorescent marker for dead cells (Sytox; Molecular Probes, Eugene, OR, U.S.A.). Sytox is a high-affinity nucleic acid stain. It does not penetrate intact plasma membranes, but it rapidly stains the nuclei of cells whose outer membrane has been disrupted. Cultures were exposed to Sytox for 20 min while in an incubator (5% CO2/balance humidified air at 37°C). Sytox (50 nM final concentration) was dissolved in a sterile solution containing Basal Medium Eagle Medium (75%), Earle’s Balanced Salt Solution (25%), 25 units/ml penicillin/streptomycin, 1 mM L-glutamine, supplemented with additional D-glucose to a final concentration of 7.5 mg/ml; 1.2 ml of this solution was used per insert with half of the volume placed over the insert to enhance exposure. The tissue culture plate containing the insert was scanned on the stage of an inverted microscope (Fluovert; Leica, St. Gallen, Switzerland) at 63x total magnification. Fluorescence was elicited by excitation with a 100-W mercury vapor lamp using a standard fluorescein filter set (I3 from Leica). Cultures were exposed to fluorescent light for <20 s per HOTC during this screening to reduce any potential for photobleaching or phototoxicity. A Uniblitz Shutter (Vincent Associates, Rochester, NY, U.S.A.) was used to reduce exposure to <300 ms/photograph (6.3x objective) for images shown in Fig. 2. HOTCs (exclusive of their spreading edge) with >20 positive cells were excluded from experiments. Excluded cultures were removed from the inserts.
Figure 2.
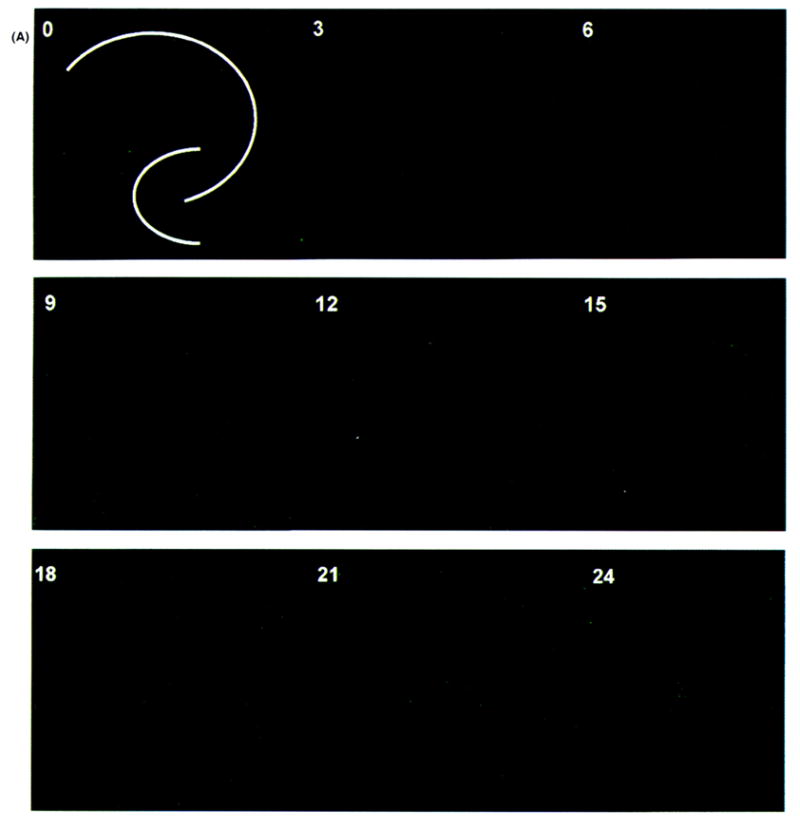
Evolution of irreversible neural injury from N-methyl-D-aspartate (NMDA) exposure. Images shown are time-lapsed using Sytox (Molecular Probes, Eugene, OR, U.S.A.) as a fluorescent indicator of cell lysis. Sham control hippocampal organotypic cultures (HOTCs) were exposed to Ringer’s solution (A) and experimental HOTCs to Ringer’s solution plus 10 μM NMDA (B) for 30 min at room temperature. Test solutions were removed and cultures reexposed to normal growth medium in an incubator at 37°C with 5% CO2/balance humidified air. Cultures were briefly removed (at times indicated in hours in the upper left-hand corner of images) and photographed. White lines in 0-h images show pyramidal cell body layer and dentate gyrus for all images. Notice that in sham control cultures (A), only a few cells show cell necrosis (e.g., especially at 21 or 24 h). On the other hand (B), a pronounced and progressive increase in necrosis is seen in the CA1 area from 15 to 24 h after exposure to 10 μM NMDA. Bar = 500 μm.
Following initial screening for HOTC viability, culture medium was changed at room temperature to an N-2-hydroxy-ethylpiperazine-N′-2-ethanesulfonic acid (HEPES)-buffered salt solution (HBSS) consisting of NaCl 143.4 mM, HEPES 5 mM, KCl 5.4 mM, MgSO4 1.2 mM, NaH2PO4 1.2 mM, CaCl2 2.0 mM, and D-glucose 10 mM (after Vornov et al., 1991) plus either 1 or 10 μM of the glutamate agonist N-methyl-D-aspartate (NMDA) for 30 min. Sham control cultures were exposed to HBSS only. Each insert received 1 ml of test solution placed around the insert and an additional 0.5 ml placed on top of the cultures to enhance the likelihood of their exposure to experimental solution. At the end of exposure periods, inserts were rinsed with HBSS and placed in tissue culture trays containing 1.2 ml of preequilibrated culture medium. The cultures were then returned to the incubator (5% CO2/balance humidified air at 37°C). After recovery periods of 24, 48, 72 h, or 7 days, inserts were screened again for regional injury using Sytox. Most (98%) cultures that were exposed to 10 μM NMDA (n = 424) showed at least CA1 regional evidence of injury (n = 414). On the other hand, cultures exposed to 1 μM NMDA (n = 154) showed no evidence of injury (n = 151).
Immunohistochemistry
After confirmation of regional injury from NMDA exposure, HOTCs were processed for IS. While still on the culture insert, HOTCs were fixed with a solution of 4% paraformaldehyde in 0.1 M phosphate buffer (pH 7.4) overnight at 4°C. Then, the HOTCs were gently removed from the inserts with a brush and placed in 10 mM phosphate-buffered saline (PBS) for an additional 24 h. The latter solution also contained 1% Triton-X100 (Sigma, St. Louis, MO, U.S.A.) and 0.01% sodium azide. Next, slice cultures were placed in 500 μl of blocking solution containing PBS, 0.75% Triton-X100, 0.01% sodium azide, and 3% goat serum (Colorado Serum Co., Denver, CO, U.S.A.) for 1 h at room temperature and then transferred to 500 μl of blocking solution containing anti-GFAP or anti-vimentin (no. 814-369 and no. 814-318, respectively, diluted 1:100; Boehringer Mannheim, Indianapolis, IN, U.S.A.) for 24 h at 4°C with gentle agitation. Following the primary antibody incubation, HOTCs were rinsed in PBS (three times for 10 min each) and incubated in peroxidase-labeled anti-mouse IgG antibody (diluted 1:50 in blocking solution that lacked sodium azide; Biosource International, Cameriool, CA, U.S.A.) with gentle agitation for 1 h at room temperature. Cultures were rinsed in PBS and the peroxidase label visualized by incubation in PBS containing 0.05% diaminobenzidine dihydrochloride (Sigma) and 0.01% H2O2 for 5–7 min at room temperature with agitation. After thorough rinsing in PBS, HOTCs were mounted on gelatin-coated slides and air-dried overnight. HOTCs were then counterstained with neutral red, dehydrated in graded alcohols, cleared in xylenes, and coverslipped with DPX mountant (BDH Laboratory Supplies, Poole, England).
For the study of cellular proliferation, HOTCs were processed as described except that they were quenched in methanol containing 1.0% H2O2 followed by three rinses in PBS before placement in blocking solution and primary antibody incubation with anti-proliferating cell nuclear antigen (anti-PCNA) (no. sc-56 diluted 1:300; Santa Cruz Biotechnology, Santa Cruz, CA, U.S.A.). Preliminary trials showed reduced PCNA IS when quenching was not included. For double-labeling experiments, the cultures were first immunostained for GFAP or vimentin as described followed by PCNA IS using a rhodamine-conjugated anti-mouse IgG antibody (Caltag Laboratories, San Francisco, CA, U.S.A.) diluted 1:50 in blocking solution. The HOTCs were rinsed with PBS, slide mounted, air dried, dehydrated, cleared, and coverslipped as described.
Computer-based quantification of immunohistochemistry
Image preparation
Computer-based image analysis software, lmage Pro Plus (version 1.3; Media Cybernectics, Silver Springs, MD, U.S.A.), was used to quantitate IS. Slide-mounted HOTCs were photographed (1,024 × 1,024 pixels) using a 12-bit, cooled, charge-coupled camera (CH250; Photometrics, Tucson, AZ, U.S.A.). The camera was run under a Windows (3.1) environment on a 486 AST computer (AST Research, Irvine, CA, U.S.A.) using PMIS software (version 3.0; Photometrics). HOTCs were transilluminated through a 0.5 neutral density filter (Earing Electro-optics, Holliston, MA, U.S.A.) in combination with either a 540/40 or a 630/30-nm band pass filter (Chroma Technology Corp., Brattleboro, VT, U.S.A.) using a Laborlux D compound microscope (Leica, St. Gallen, Switzerland) at 2x total magnification. The 540/40 band pass filter emphasized the cytoarchitectural organization of the slice culture. Accordingly, an area of interest (AOI) for either CA1, CA3, or DG could be easily outlined. Quantifications of IS were based on these AOIs. The AOIs were overlaid onto other images obtained using a 630/30-nm bandpass filter. This filter effectively removed neutral red staining so that only IS was visualized and quantified. Electronic images were stored on a Pinnacle Micro optical drive (Sierra 1.3 GB; Pinnacle Micro, Irvine, CA, U.S.A.). Electrical power for the microscope light source and all electronic equipment was stabilized with mini uninteruptible power systems (MUPSA-1000; Philtek Power Corp., Blaine, WA, U.S.A.).
The image analysis strategy followed that recently used for whole-brain sections (Caggiano and Kraig, 1996). First, five bias photos were taken. This removed residual charge from the camera sensor. Second, a sharp focus of an image was obtained to establish the relative focal plane from which experimental photos would be acquired. Third, the camera sensor gain was calibrated by adjusting the exposure time (110–120 ms) so that the mean intensity acquired from the filtered light source was a constant value (e.g., 3,450 on a 0–4,096 scale). This required that all microscope light path settings be reproducibly established. Fourth, for each GFAP IS and vimentin IS culture, a 540/40- and 630/30-nm band pass filtered image was acquired and stored. In addition, a dark-field current image (Id; same exposure time with a closed shutter) and a background reference image (Ir) were acquired for each microscopic slide of cultures. For PCNA IS cultures, the DG, CA3, and CA1 hippocampal regions were acquired as described except that images were obtained at 7.5x total gain instead of 2x and with a 660-nm band pass filter. An Ir for each slide was also acquired and stored.
Image analyses
Optical density (OD) values were determined from electronic images as follows (Caggiano and Kraig, 1996): The dark-field current was subtracted from the acquired slice section image (io−Id) and from the reference image (Ir−Id). A corrected image (Ic) was then generated by reference correction of the experimental image according to 1 where M equals the mean pixel value of the corrected reference image. Previously generated AOIs were then applied to the respective DG, CA3, and CA1 zones to be quantitated in the corrected images. The intensity scale (0–4,096) for OD measurements was set to a constant dark and light limit (e.g., 1,500–3,200) that bracketed light intensity values for all hippocampal cultures. In this way, the range of OD measurements was narrowed to that of the experimental data to optimize signal-to-noise values.
For PCNA IS analysis, cell counts also were conducted using Image Pro Plus software. Parameters used for cell counting (perimeter, average diameter, and roundness) were determined in preliminary studies. The ranges used for each parameter were 5–20 μm (perimeter), 15–20 μm (average diameter), and 1.0–1.6 (roundness). Spatial calibration was set using a stage optical micrometer. Before determining cell counts, the slide reference image was background subtracted from each acquired HOTC image. Then, a threshold range (e.g., within 0–4,096 range) was empirically determined by sampling multiple HOTCs and visually accessing the cells counted. To ensure that the sampling area was the same for each HOTC, the same AOI per hippocampal region was applied to all sections. Personnel were blinded to experimental conditions when acquiring and quantitating electronic images.
Statistical procedures
For GFAP and vimentin analyses, sham control OD values were averaged for each recovery point. To stabilize the variance, experimental OD values were divided by the mean sham control OD for each respective condition. The resultant value underwent a logarithmic transformation. In this way, increased IS of experimental sections compared with similar recovery period controls would result in a log ratio greater than zero, while changes equivalent to control conditions would result in a log ratio value of zero.
A Student two-tailed t test was used to determine significance. Statistics were calculated using Systat software (version 5, Systat, Evanston, IL, U.S.A.) and histograms made using Sigma Plot software (version 2.0; Jandel Scientific, San Rafael, CA, U.S.A.). Means and standard deviations are shown in all histograms. PCNA data analysis was similar to that described. However, here data were transformed by adding 1 to group means and taking the square root of the resultant values. This procedure reduced variance associated with small counts (Snedecor and Cochran, 1989).
Preparation of illustrations
Illustrations of IS were prepared from electronic images in concert with recent discussions (Anderson, 1994). Bright-field images were photographed using 100 ASA Ektachrome color film (Eastman Kodak, Rochester, NY, U.S.A.) with an Orthomat E automatic exposure unit (Leica). Resultant 35-mm slides were transformed into electronic files using a Kodak Professional Film Scanner (no. 2035; Eastman Kodak) at 1,000 pixels/in. Electronic images were processed using Image Pro Plus software. First, reference images were subtracted to even image lighting. Second, images were refocused using a high Gaussian filter (7×7 pixel matrix at 50% strength and two passes for Fig. 3, Fig. 4, Fig. 6, and Fig. 7 or 100% strength and one pass for Fig. 9 and Fig. 10). Third, image brightness was raised and background noise lowered by applying brightness, contrast, and gamma function values of 76, 50, and 0.6 to all images.
Figure 3.
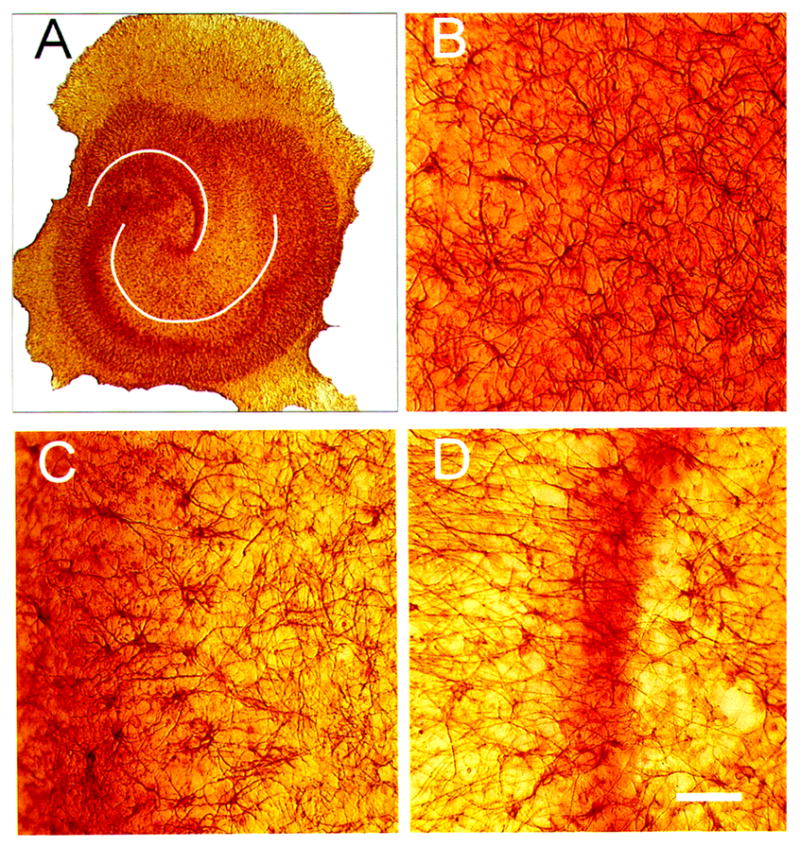
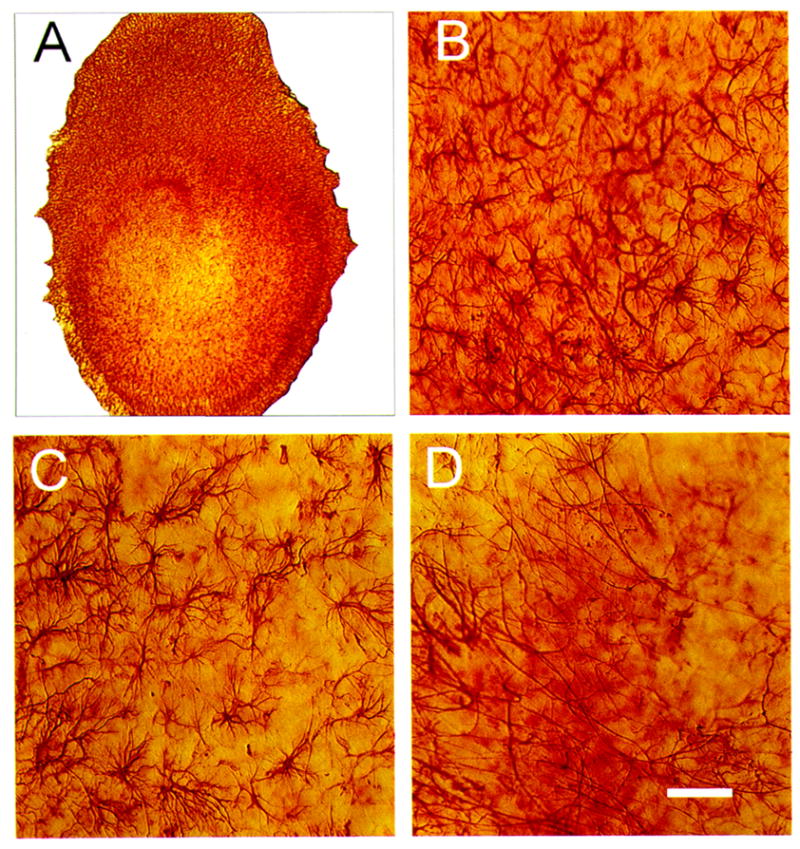
Bright-field photomicrographs of glial fibrillary acidic protein (GFAP) immunostaining (IS) in control hippocampal organotypic cultures (HOTCs). HOTCs were counterstained with neutral red to help illustrate CA1, CA3, or dentate gyrus (DG) neuronal cell layers. As a result, photomicrographs here and elsewhere have some red hues that stem from the often out-of-focus image of stained cell bodies that extend throughout the 100- to 150-μm thickness of the HOTC. Low-power image (A) shows typical CA1, CA3, and DG cell layers. Notice that neutral red staining is more diffuse in CA1 than in CA3 or the dentate area. This means that at higher magnification, the CA1 cell layer is typically seen as a diffuse red shading (B), while the cell layer in CA3 is evident to the left in (C) and the suprapyramidal limb of the DG is evident in (D). GFAP-positive astrocytes in CA1 (B) are evenly distributed throughout the subfield area and have relatively small cell bodies with thin processes. In CA3 (C), GFAP-positive cells are less densely distributed, but some have enlarged cell bodies. GFAP IS in the suprapyramidal limb of the dentate is the least dense of the three areas examined (D). White lines (A) emphasize pyramidal cell body layer and DG. Bar = 50 μm.
Figure 4.
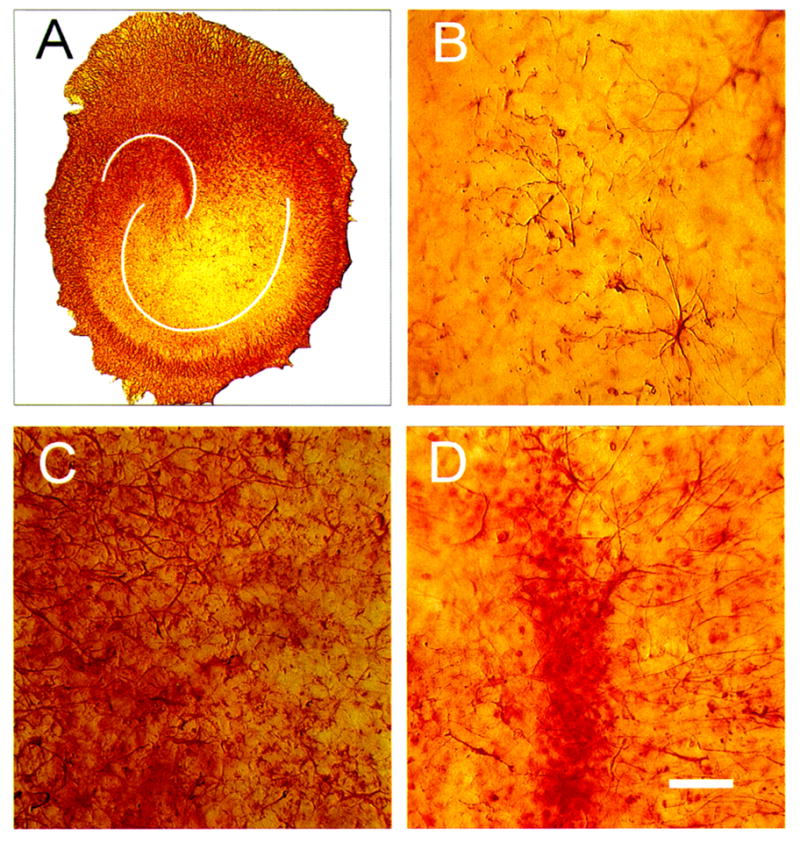
Bright-field photomicrographs of glial fibrillary acidic protein (GFAP) immunostaining (IS) 48 h after 10 μM N-methyl-D-aspartate (NMDA) exposure in hippocampal organotypic cultures (HOTCs). Low-power image (A) shows typical CA1, CA3, and DG cell layer orientation. Exposure to NMDA caused GFAP IS to increase in CA1 (B) and CA3 (C) areas. Notice the enlarged cell bodies throughout images in these areas compared with their respective counterparts in normal HOTCs (Fig. 3). In this example, NMDA exposure, on the other hand, caused a distinct decrease in GFAP-positive cells within the dentate gyrus (D). Bar = 50 μm.
Figure 6.
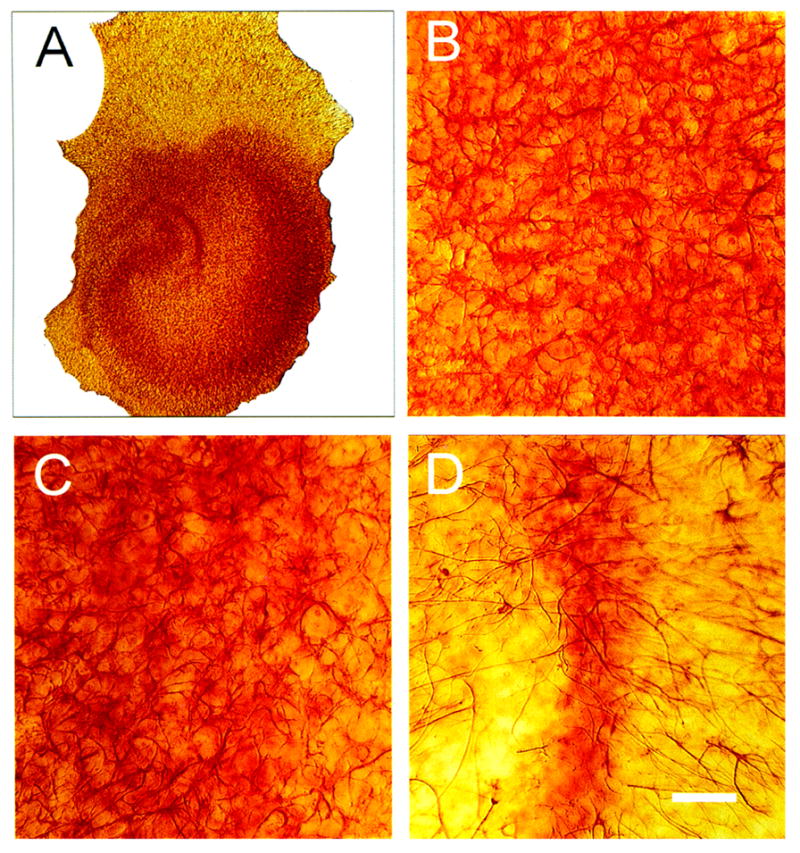
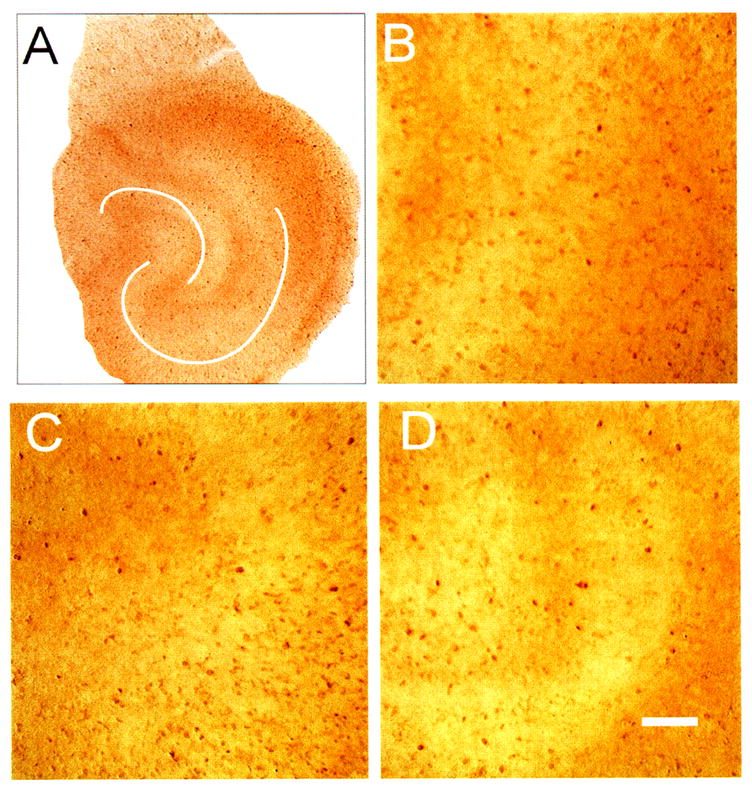
Bright-field photomicrographs of vimentin immunostaining (IS) in control hippocampal organotypic cultures (HOTCs). Vimentin IS falls with time in HOTCs, as in conditions in vivo, but unlike primary astrocytic cultures. This fall suggests astrocytes within HOTCs mature more than their counterparts in primary culture. This suggestion can be seen here. The low-power image of an HOTC (A) shows vimentin IS sparsely distributed within the HOTC compared with its surroundings. At higher magnification, CA1 (B) and the dentate (D) individual cells can be seen. The meager distribution of vimentin IS compared with glial fibrillary acidic protein IS (see Fig. 3) is evident. In CA3 (C), vimentin IS is more prevalent. White lines (A) emphasize pyramidal cell body layer and dentate gyrus. Bar = 50 μm.
Figure 7.
Bright-field photomicrographs of vimentin immunostaining (IS) 72 h after 10 μM N-methyl-D-aspartate (NMDA) exposure in hippocampal organotypic cultures (HOTCs). Low-power image (A) shows regional changes in vimentin IS. NMDA exposure caused vimentin IS to increase in CA1 (B). Notice the number of cells is increased and their cell bodies and processes enlarged compared with normal conditions (e.g., Fig. 6A). Similarly, in this example, the CA3 area contains larger cells with thicker processes, although seemingly not more positive cells compared with control conditions (C). At 48 h, however, this change was not significantly different from controls. A similar nonsignificant change compared with sham controls was evident in the dentate area (D). Bar = 50 μm.
Figure 9.
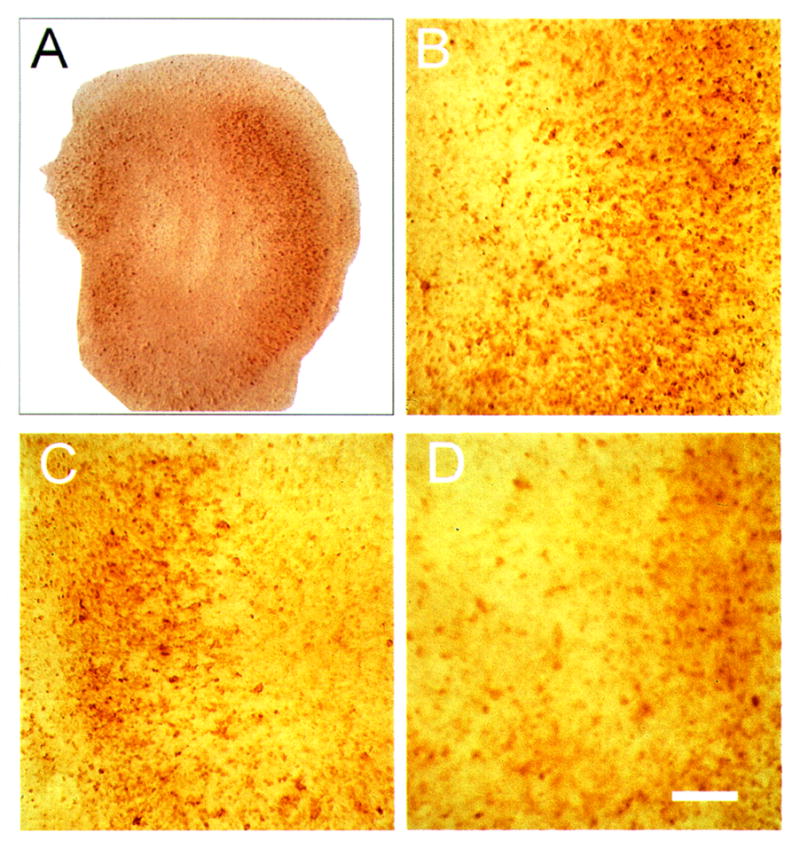
Bright-field photomicrographs of proliferating cell nuclear antigen (PCNA) immunostaining (IS) in control hippocampal organotypic cultures. Cultures were not counterstained with neutral red here or in Fig. 10 since PCNA IS alone was sufficient to allow determination of cell layers. Low-power image (A) has the same orientation as previous figures. Suprapyramidal limb of dentate is evident to the left with CA3 to CA1 sweeping in a downward and rightward direction. Higher-power images show scattered PCNA-positive cells in CA1 (B), CA3 (C), and dentate area (D). Positive cells can be seen as the brown-colored, small spots (5–10 μm in diameter). Other out-of-focus areas of increased staining are from PCNA-positive cells out of the plane of focus. White lines (A) emphasize pyramidal cell body layer and dentate gyrus. Bar = 50 μm.
Figure 10.
Bright-field photomicrograph of proliferating cell nuclear antigen (PCNA) immunostaining 48 h after 10 μM N-methyl-D-aspartate (NMDA) exposure in hippocampal organotypic cultures. Low-power image (A) has the same orientation as previous figures. NMDA exposure caused an increase in PCNA-positive cells in CA1 (B), CA3 (C), and the dentate (D). Bar = 50 μm.
Images shown in Fig. 2 were refocused using a constrained iterative deblurring algorithm at two cycles (Microtome version 1.2; Vaytek, Fairfield, IA, U.S.A.). Images were enhanced by applying brightness, contrast, and gamma values of 85, 80, and 0.2 to all images.
Final images in all instances were printed using a dye sublimination printer (XLT-7720; Eastman Kodak).
RESULTS
Development of irreversible injury from NMDA exposure
The cytoarchitecture of a typical HOTC used in experiments before NMDA exposure is shown in Fig. 1. The HOTC shown was maintained in vitro for 35 days. HOTCs used in this study were maintained in vitro 21–35 days before exposure to NMDA. This was done to help ensure that synaptic activity had reached a plateau (Buchs et al., 1993; Muller et al., 1993; Bahr, 1995) prior to experimental manipulations. During this period in vitro, cultures showed distinguishable CA1, CA3, and DG subfields. In contrast to that found in situ, the pyramidal neurons of CA1 spread out to form a loosely defined cell layer, while the CA3 pyramidal neurons maintained a compact layer. The U-shaped DG consists of a multilayered granular cell layer, though the infrapyramidal limb is frequently diminished in width (Zimmer and Gahwiler, 1984).
Figure 1.
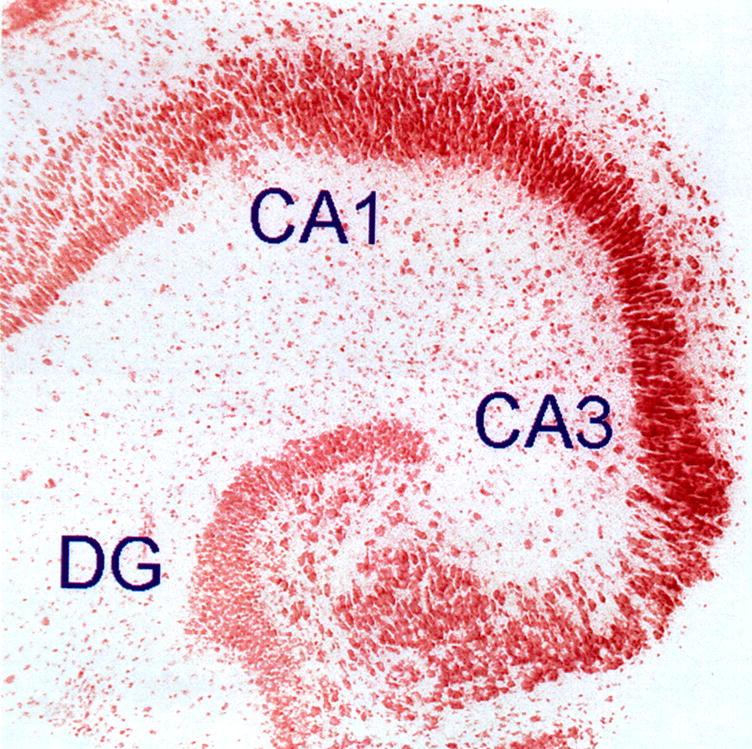
Low-power, bright-field photomicrograph of hippocampal organ culture. Image shown is from a hippocampal organotypic culture (HOTC) maintained in culture for 35 days. Experiments were done on cultures maintained for 21–35 days in vitro since this is a period within which synaptic activity typically reaches a plateau. The culture shown was fixed in 4% paraformaldehyde, stained with neutral red, and photographed with an electronic camera system. Notice the pyramidal cell layer and dentate gyrus (DG) of the HOTC are typical of those seen in the intact hippocampus in vivo. Measurements of neural cell injury and associated astrogliosis were evaluated in three regions: CA1, CA3, and DG. Image is 1,454 μm on a side.
The temporal profile of injury following exposure to 10 μM NMDA is shown in Fig. 2. Injury was visualized using a highly sensitive fluorescent marker for dead cells (Sytox). No regional injury was detected within sham control HOTCs during the 24 h they were observed (Fig. 2A) or up to the 72-h period (data not shown) of experiments. HOTCs exposed to 10 μM NMDA showed a similar lack of regional injury for the first 12 h after exposure. However, by 12 h postexposure, a few isolated cells were positive for Sytox in the DG and a faint band of scattered fluorescent cells became visible in CA1 (Fig. 2B). During the next 12-h period, the number of fluorescent cells in CA1 became more numerous, coalescing to form a homogeneous fluorescent zone. During this period, only a slight increase in staining was observed in the DG, with fluorescent cells localized primarily within the suprapyramidal limb. No observable increase in fluorescence was noted in either region during the next 48 h (data not shown). In contrast, the CA3 subfield remained free of staining throughout the NMDA postexposure period.
Exposure of HOTCs to 1 μM NMDA resulted in no detectable increase in Sytox staining as compared with sham-exposed cultures (data not shown).
Astroglial changes after 10 μM NMDA exposure
GFAP and vimentin IS were used to detect astroglial changes following NMDA exposure. In sham-exposed HOTCs, GFAP IS was uniformly present throughout CA1, CA3, and DG as radially oriented fibers (Fig. 3) like that shown by Del Rio et al. (1991). Immunoreactive perikarya with slender processes that radiated in an apparently random fashion were found scattered in all subfields, though within CA1 the processes were more numerous than found in the other regions (Fig. 3B). In addition, possibly reflecting a maturational gradient, GFAP IS cells progressively increased in size and staining intensity toward the pyramidal and dentate neuronal cell layers. In contrast, 24 and 48 h following NMDA exposure, enlarged immunoreactive cells with thickened processes were prevalent throughout HOTCs, disrupting the uniform radial pattern found in the control cultures (Fig. 4). Consistent with the predominant lysis indicated by Sytox, the most prominent GFAP IS density increases were observed in CA1 (Fig. 4). OD analyses of GFAP IS in NMDA-exposed cultures compared with sham cultures are summarized in Fig. 5. All regions showed a significant increase in GFAP IS 24 and 48 h after NMDA exposure (p < 0.05), although the most pronounced increase occurred in CA1 (p < 0.001). By 72 h, however, none of the regions were significantly different from those in sham-exposed HOTCs. The decline in GFAP IS intensity measured at 72 h accelerated and reached significantly decreased (e.g., below baseline) levels in all regions by 7 days postexposure (p < 0.01).
Figure 5.
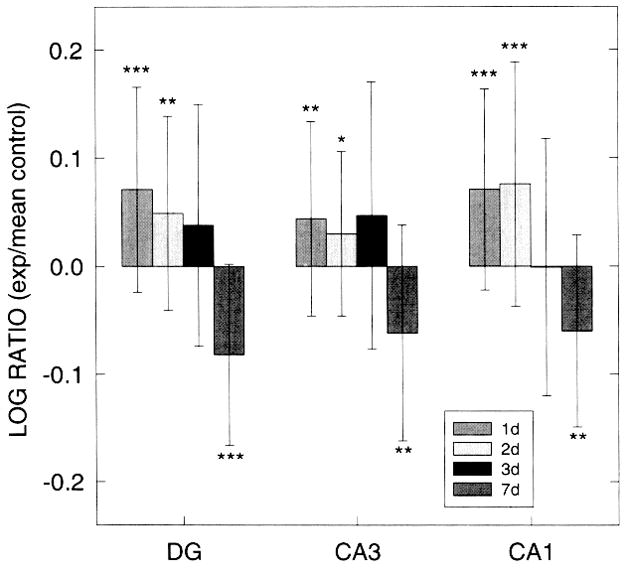
Log ratios of glial fibrillary acidic protein (GFAP) immunostaining (IS) optical density (OD) values within dentate gyrus (DG), CA3, and CA1 regions of hippocampal organotypic cultures (HOTC) after 10 μM N-methyl-D-aspartate (NMDA) exposure and survival periods of 24, 48, 72 h or 7 days. Positive values show greater staining intensity in exposed slices compared with the mean of nonexposed control slices. A significant increase in GFAP IS OD is observed in all regions at 24- and 48-h survival periods. However, at 7 days, a significant decrease of OD values is found in all three regions. Data are shown as means ± SD. Significance levels are shown by *p < 0.05, **p < 0.01, and ***p < 0.001 compared with respective nonexposed controls. Sham control OD values are based on 20–30 HOTCs, while 23–39 HOTCs were included in the NMDA-exposed groups.
Vimentin IS was localized primarily within the DG and surrounding the edge of sham-exposed HOTCs (Fig. 6). Small- to medium-sized immunoreactive perikarya with slender processes (e.g., Fig. 6B) were scattered throughout the culture with the highest density found in the less developed infrapyramidal limb of the DG (Fig. 6D). Larger vimentin IS cells with thickened processes formed a dense, tangled matrix surrounding the culture (e.g., cf. Fig. 6A and Fig. 7A). Following NMDA exposure, the cultures displayed regional and temporal fluctuations in vimentin IS intensities (Fig. 7 and Fig. 8). Vimentin IS OD values were increased in all regions 24 h postexposure (p < 0.05 and p < 0.001, DG and CA1, respectively), but returned toward baseline values by 48 h. However, OD values increased again in CA1 and CA3 (p < 0.05 and p < 0.001, respectively) 72 h after NMDA exposure, due in part to an enlargement and increase in the number of vimentin-immunoreactive cells (Fig. 7B and C). By 7 days, though, OD values in CA3 fell toward baseline levels while CA1 values remained elevated.
Figure 8.
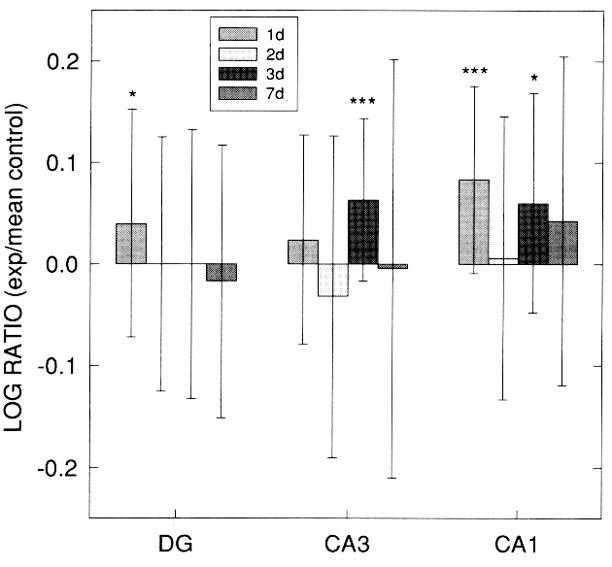
Log ratios of vimentin immunostaining (IS) optical density (OD) values (exp: mean control) within dentate gyrus (DG), CA3, and CA1 regions of hippocampal organotypic culture (HOTC) after 10 μM N-methyl-D-aspartate exposure and survival periods of 24, 48, 72 h or 7 days. In both DG and CA1 regions, significant increases in vimentin IS OD are seen at 24 h, but by 48 h no differences compared with sham control cultures are observed in these regions. OD values in CA3 and CA1 both show a significant increase at 72 h postexposure but not at 7 days. Data are shown as means ±SD (*p < 0.05, ***p < 0.001) compared with respective sham controls. Sham control OD values are based on 20–28 HOTCs, while 13–34 HOTCs were included in the exposed groups.
A dramatic increase in the number of PCNA-immunoreactive cells was observed in all regions analyzed following 10 μM NMDA exposure (Fig. 9, Fig. 10, Fig. 11). Twenty-four hours after NMDA exposure, both CA1 and DG contained significantly increased PCNA-positive counts (p < 0.01 and p < 0.001, respectively). In contrast, PCNA-immunoreactive cells in the CA3 remained near sham-exposed levels. By 48 h, all regions contained significantly increased numbers (p < 0.001). PCNA IS cells, typically ~6–10 μm in diameter, were especially prominent throughout the width of CA1 and in the infrapyramidal limb of the DG (Fig. 10). Fewer PCNA IS cells were typically found in CA3, similar to the sham condition. A sharp decrease in the number of PCNA IS cells followed at 72 h and 7 days postexposure in all three areas, yet values were still significantly elevated compared with sham cultures.
Figure 11.
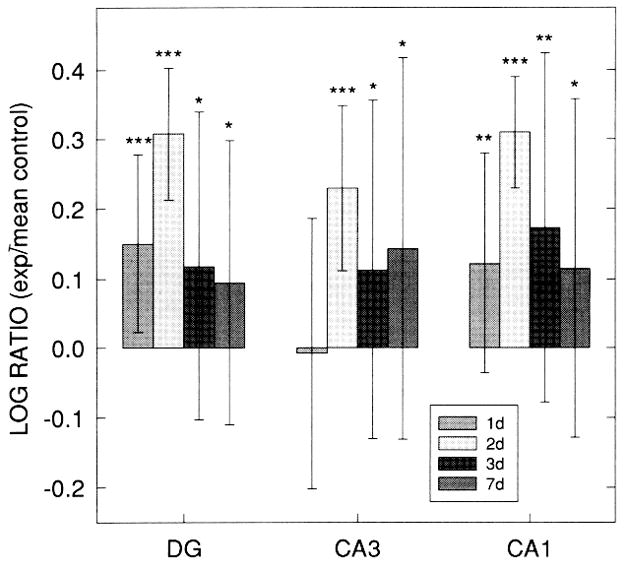
Log ratios of the number of proliferating cell nuclear antigen (PCNA)-positive (exp: mean control) within dentate gyrus (DG), CA3, and CA1 regions of hippocampal organotypic culture (HOTC) after 10 μM N-methyl-D-aspartate (NMDA) exposure and survival periods of 24, 48, 72 h or 7 days. Except for CA3 at 24 h, significant increases in PCNA immunostaining are seen in all regions and survival times. All regions show a dramatic increase in the log ratio values from 24 to 48 h followed by a steep decrease at 72 h. Log ratio values remain elevated at 7 days. Data are shown as means ±SD (*p < 0.05, **p < 0.01, ***p < 0.001) compared with respective sham controls. Sham control and NMDA-exposed culture cell counts are based on 21–22 HOTCs.
Astroglial changes after 1 μM NMDA exposure
OD values of GFAP IS after exposure of HOTCs to 1 μM NMDA are summarized in Fig. 12A. Consistent with the absence of regionally positive Sytox staining induced by this lower concentration of NMDA, GFAP IS intensity values remained near sham-exposed values. The only increased value was found in the DG at 24 h, while a decrease was found in the CA3 at 72 h postexposure (p < 0.05 and p < 0.01, respectively). Surprisingly, OD values in the CA1, which displayed significant changes following 10 μM NMDA, differed little from sham HOTC values. Light microscopic examination revealed only minor changes in immunoreactive morphology between experimental and sham conditions (data not shown). Likewise, vimentin IS-induced density changes were also limited compared with those observed with the higher NMDA concentration. All three regions showed a slight elevation in OD values after the initial 24-h period. This was followed by decreased staining densities at each of the remaining time points (Fig. 12B) that reached significant values in the DG at both 72 h and 7 days (p < 0.01 and p < 0.05, respectively) and in CA3 at 48 h (p < 0.01 but not in CA1 PCNA IS displayed a biphasic response to the lower concentration of NMDA. Counts of immunoreactive cells were significantly decreased in all regions 24 h after the exposure, most notably in CA3 (p < 0.001). However, by 48 h, the number of PCNA IS cells in each region had returned toward sham-exposed levels (Fig. 12C). By 72 h, the number of immunoreactive cells again dramatically decreased in each region (p < 0.001) and remained significantly lower at 7 days postexposure (p < 0.001). Microscopic analysis confirmed the results found by the computer-based counting procedure. Frequently, only one to two immunoreactive cells were observed per region in the experimental HOTC (not shown), which was in contrast to that found in the sham-exposed HOTC (Fig. 9).
Figure 12.
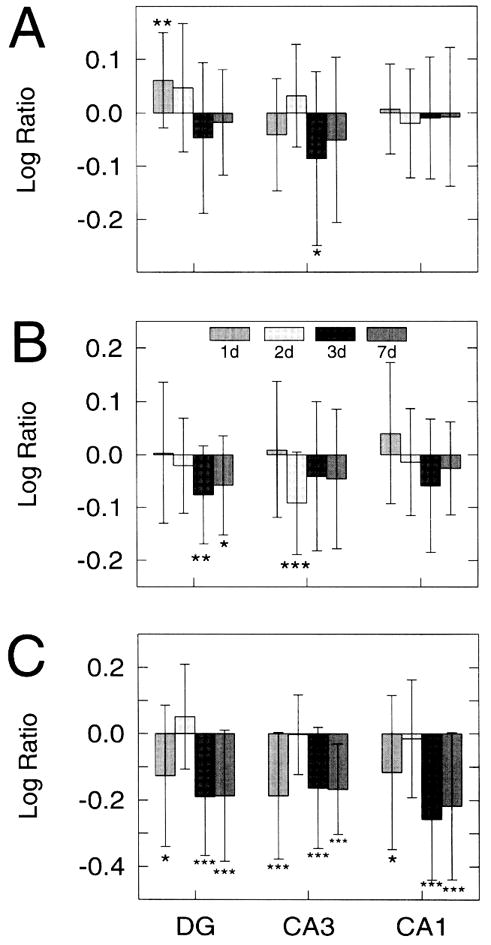
Log ratios of glial fibrillary acidic protein (GFAP) immunostaining (IS) (A) and vimentin IS (B) optical density (OD) values and proliferating cell nuclear antigen (PCNA) cell counts (exp: mean control) (C) within dentate gyrus (DG), CA3, and CA1 regions of hippocampal organotypic culture (HOTC) after 1 μM N-methyl-D-aspartate (NMDA) exposure and survival periods of 24, 48, 72 h or 7 days. A significant increase in GFAP IS OD is seen only in the DG at 24 h postexposure, while in the CA3 at 72 h, a significant decrease is found. In all other regions and survival points, log ratios remained near control levels. Vimentin OD log ratio values are slightly positive in all regions 24 h postexposure followed by negative values for the remaining survival times. In the DG (72 h and 7 day) and CA3 (48 h), the negative log ratio values reach significance. Significantly negative PCNA log ratio values are found in all regions 24 h postexposure, but values return to near baseline levels at 48 h. By 72 h postexposure, the log ratio values return significantly to negative values and remain so at 7 days. Data are shown as means ±SD (*p < 0.05, **p < 0.01, ***p < 0.001) compared with respective sham controls. The latter are based on 14–17 HOTCs, while 14–25 HOTCs were analyzed in the NMDA-exposed group.
The cell type of origin for PCNA-positive cells was not systematically studied. However, a small subset of PCNA-stained cultures (n = 10) was examined to determine if proliferating cells were predominantly astrocytes (after exposure to 10 μM NMDA). Over 100 positive cells in 10 HOTCs (48 h after exposure) were examined for evidence of concomitant labeling with a fluorescent label for GFAP IS. Less than 10% of the proliferating cells were also GFAP positive.
DISCUSSION
The present work shows that many of the spatial and temporal changes of astroglia seen in vivo from global ischemia (Petito et al., 1990; Petito and Halaby, 1993) are also found in HOTCs after excitotoxic injury. Exposure of HOTCs to 10 μM NMDA produces a selective loss of vulnerable neurons (e.g., predominantly CA1 pyramidal cells) that parallels the loss of neurons in this same area from global ischemia. Our results show that, as in in vivo conditions, selective neuronal injury induced a rapid and statistically significant increase in the astrocytic GFAP IS and vimentin IS. Furthermore, a dramatic and highly significant increase in cellular proliferation was present in all regions of HOTCs after injurious NMDA exposure. Finally, exposure of the HOTCs to a lower level of NMDA, which resulted in no neural injury, induced only minor alterations in astroglial immunohistochemical markers, but significantly reduced cellular proliferation.
HOTC reaction to 10 μM NMDA
Cell necrosis
Selective neural injury from exposure to NMDA, which was visualized with the fluorescent indicator Sytox, is similar to the distribution of injury from this toxin seen in our own preliminary studies using propidium iodide (Kunkler and Kraig 1995a, 1995b) and the work of others (Vornov et al., 1991, 1995). In concert with these earlier studies, the onset of NMDA-induced injury (10 μM exposure) was delayed and localized to CA1 and DG. These are areas within the hippocampus in vivo that contain the highest density of NMDA receptors (Greenamyre et al., 1985) and zone of neuronal injury from global ischemia (Pulsinelli et al., 1982). The dead cell marker Sytox was used instead of propidium iodide since it could be employed at a dilution 10–100 times greater than that needed for positive propidium iodide staining. Furthermore, Sytox cells were markedly more fluorescent than ones stained with propidium iodide when either dye was used at typical dilutions. However, Vornov and colleagues (1995) did report positive staining with propidium iodide in portions of CA3 and CA4 without HOTCs after exposure to 10 μM NMDA that was not evident in our work. The paucity of Sytox-positive staining in these latter regions might result from the fact that HOTCs were exposed to NMDA at a lower temperature in our work (21°C) compared with that (37°C) of Vornov et al. (1995). In addition, HOTCs used here were relatively more mature (e.g., >21 days in vitro compared with <21 days in vitro). Greater maturity of HOTCs means more advanced anatomical differentiation (Buchs et al., 1993) and improved synaptic function (including increased inhibitory synaptic activity and reduced spontaneous excitatory activity) (Muller et al., 1993), which more closely resembles conditions found in vivo than seen using younger HOTCs. Together these anatomical and functional differences between these two types of HOTCs may account for the closer similarity of NMDA-induced injury in older HOTCs to that seen in vivo after global ischemia.
GFAP IS
Global ischemia and resultant selective neuronal injury are associated with well characterized changes of astrocytes into reactive species (Petito et al., 1990). These astrocytic changes consist of a transient increase in GFAP IS and cellular hypertrophy where neurons are reversibly injured (e.g., neocortex). In addition, the changes include hyperplasia as well as hypertrophy and a more persistent rise in GFAP IS where neurons are irreversibly injured (e.g., hippocampus).
Astroglial changes seen within HOTCs after lethal NMDA exposure largely parallel changes that are seen in vivo from global ischemia. A significant and relatively large transient increase in GFAP IS OD following NMDA exposure, which destroys cells, persists for 3 days in HOTCs, while this degree of injury from ischemia (e.g., CA1 area of the hippocampus) causes a GFAP IS rise in vivo that persists for weeks after ischemia (Petito et al., 1990). On the other hand, GFAP IS rises to a lesser extent and only for a few days before returning toward normal where neurons are not destroyed (e.g., CA3) in HOTCs. A similar transient change in GFAP IS that peaks at ~3 days is seen with global ischemia where neurons (e.g., in neocortex) are only reversibly injured from the reduction in flow (Petito et al., 1990). Furthermore, SD in vivo, an even more benign phenomenon that lacks neuronal injury, results in a temporally similar transient rise in GFAP IS (Kraig et al., 1991) and GFAP content (R. P. Kraig et al., 1991, unpublished). The GFAP IS increase, which was evident by 24 h after exposure to 10 μM NMDA, is associated with an enlargement of GFAP-positive cell bodies and processes and an increase in the number of GFAP-positive cells. Astrocytic hypertrophy was seen in all zones of HOTCs and, as in the work of Petito and co-workers (1990), ~10% of dividing cells (see later) were astrocytic. Thus, most of the increased GFAP IS seen in HOTCs from NMDA exposure is due to hypertrophy of astrocytes and not hyperplasia.
Seven days after exposure to 10 μM NMDA that is lethal to CA1 and DG neurons, GFAP IS fell to levels significantly below baseline values in all (e.g., DG, CA1, and CA3) principal hippocampal regions. A fall in GFAP IS has been noted to occur early after global ischemia (Petito and Habaly, 1993) but not late (e.g., 7 days) as in HOTCs exposed to 10 μM NMDA. A fall in GFAP IS is also seen in adult central nervous tissue with hepatic encephalopathy [for review see Norenberg (1994, 1995)]. This fall in GFAP IS is unlikely to be solely due to tissue immaturity since GFAP IS rises after neonatal hypoxic injury in whole animals and does not fall (Burtrum and Silverstein, 1994). However, quantitative measurements of GFAP IS after hypoxic/ischemic injury in neonates have not been completed, to our knowledge. Thus, it is conceivable that the lack of a persistent elevation in GFAP IS around lethally injured neurons and the fall in GFAP IS evident in all principal neuronal areas of HOTCs reflect a preserved plasticity or vitality of HOTCs that is not present in adult nervous tissue in vivo. This hypothesis may be tested by establishing an ontogenic profile of GFAP IS changes after ischemia. Alternatively, GFAP IS also has been noted to fall in the necrotic core of focally ischemia brain (Chen et al., 1993). This fall seems most likely to be due to lethal injury of astrocytes (Chen et al., 1993), a process that seems unlikely to apply to the HOTC results reported here. This conclusion stems from the fact that Sytox staining did not increase at times when GFAP IS fell (data not shown).
What accounts for a fall in GFAP IS is unknown. However, several fundamental changes may be involved. Compared with sham cultures, the reduction in GFAP IS may be due to a loss of GFAP-positive cells. Alternatively, existing GFAP-positive cells may show a diminution in the overall intensity of individual cellular GFAP IS. The morphology of GFAP filaments may be affected by pH, divalent cations, ionic strength, amino acids, and temperature [for review see Inagaki et al. (1994)]. Since GFAP intermediate filaments can dynamically shift between assembled and dissembled states, changes in the extracellular milieu may affect GFAP expression. The fall in GFAP IS after NMDA exposure may reflect a reduction in protein synthesis or a change in gene expression. Two mitogenic cytokines, tumor necrosis factor and basic fibroblast growth factor, have been associated with down-regulation of GFAP protein and mRNA, possibly by altering the stability of the mRNA (Selmaj et al., 1991; Lapling et al., 1994; Murphy et al., 1995). Although these cytokines induce astrocytic proliferation, the decrease in GFAP induced by tumor necrosis factor is not strictly due to cellular proliferation (Murphy et al., 1995). Finally, phosphorylation and dephosphorylation of the GFAP filament, which play a critical role in the maintenance and reconstruction of these intermediate filaments (Inagaki et al., 1994), may be altered after NMDA exposure in HOTC.
Vimentin IS
Vimentin IS rises in association with irreversible neuronal injury. Petito and colleagues (1990) found that unlike GFAP, which increases in regions of both reversibly and irreversibly damaged CNS tissue, changes in vimentin IS are restricted to areas of irreversible damage and appear in parallel with neuronal necrosis. In HOTCs, a similar pattern of vimentin IS was observed. Significant increases in vimentin IS were found in the DG and CA1, the two regions that displayed neural cell lysis. Unlike effects in vivo, though, where vimentin IS remains elevated for comparatively longer periods, the density of vimentin IS returned toward baseline in all regions by 48 h, only to increase again in CA1 (and transiently in CA3) by 72 h. The increase in CA3 vimentin IS was surprising since this region remained free of Sytox after lethal NMDA exposure. Perhaps soluble factors associated with increased vimentin IS in CA1 and DG can diffuse to the adjacent CA3 area to cause the positive staining seen there.
Alternatively, the increase may be a delayed response to alterations in neural activity following damage to both input and output targets of the CA3 pyramidal neurons.
Cellular proliferation
PCNA has been identified as a polymerase accessory protein (Bravo et al., 1987) that is necessarily associated with cell division when it is detected within nuclei (Woods et al., 1991). It exists in two forms: one soluble and another insoluble (Bravo and MacDonald-Bravo, 1987). Both forms can be detected using the fixative and PCNA antibody employed in this study. The soluble form is not associated with cell division, does not change with cell division, and is localized diffusely throughout cell cytoplasm. The insoluble form is localized to nuclei when DNA synthesis is occurring. Thus, detection of the latter form is quite specific for cells destined to divide. False-positive PCNA IS with the soluble form was not quantitated in this study. Exclusion of falsely positive staining was accomplished by two maneuvers. First, a 660-nm band pass filter dramatically reduced diffusely positive PCNA IS. Second, only positive PCNA IS that resembled nuclei (e.g., areas 5–20 μm in diameter with a 5- to 20-μm perimeter and roundness value of 1.0–1.6) was counted. Visual inspection showed that these computer-based parameters for cell nuclei underestimated the number of PCNA-positive cell nuclei in HOTCs.
The dramatic increase in PCNA-positive cells throughout the HOTCs exposed to a lethal dose of NMDA parallels those changes seen in vivo following irreversible injury from ischemia and trauma. In vivo, regions in proximity to the lesion site initially contain the highest number of proliferating cells, with fewer cells found distant to the injury (Takamiya et al., 1988; Schiffer et al., 1993). This was also seen in HOTCs, where significant increases in PCNA-positive cells were seen in the DG and CA1, but initially not in CA3. With increasing survival times, the number of proliferating cells transiently increased in the undamaged CA3 to levels seen in the DG and CA1, where irreversible cell injury was found. This is a pattern of cellular proliferation that is also seen in vivo, for example, after SD. The small size of the PCNA-positive cells (6–10 μm) suggests that these cells are probably not neurons. In addition, as mentioned previously, only infrequently were double-labeled cells for both GFAP and PCNA found in the cultures, indicating that most of the proliferating cells were not astrocytes. The most likely remaining candidate cell type is microglia, which is consistent with the results of Schiffer and co-workers (1993) who suggested that most of the proliferating cells after brain injury in vivo were microglia. Some PCNA-positive cells may also be oligodendroglia. However, their numbers in normal HOTC are very low compared with microglia. Some PCNA-positive cells in the DG may also be granule cells, which proliferate into adulthood in vivo (Cameron et al., 1995).
HOTC reaction to 1 μM NMDA
Changes in cell-specific immunohistochemical markers
Exposure of HOTCs to 1 μM NMDA caused a smaller and less prolonged increase in GFAP IS than was seen after exposure to 10 μM NMDA. This lower concentration of NMDA did, however, induce the same biphasic change in GFAP IS. That is, after an initial rise, GFAP IS fell from exposure to 1 μM NMDA. This fall was evident in all hippocampal zones but reached a significant level only in CA3. Nonetheless, that it occurred further supports the biologic importance of the significant decrease in GFAP IS that was seen in all hippocampal zones after 10 μM NMDA. Importantly, cells were never destroyed from exposure to 1 μM NMDA. Thus, loss of astrocytes cannot be the cause for the drop in GFAP IS seen after 1 μM exposure. It is possible that 1 μM NMDA did induce GFAP mRNA that was not expressed as increased GFAP protein, as seen after a single electroconvulsive seizure (Steward, 1994). Interestingly, a blockade of the NMDA receptor in vivo results in slight increases (p < 0.1) in both GFAP and vimentin IS in the DG (Gould et al., 1994), suggesting a role for these receptors in glial proliferation and maturation.
Although the mechanisms that trigger an increase in GFAP IS are unknown, neural degeneration, like that observed after 10 μM NMDA, is considered an important factor. As noted, neocortical SD, a benign perturbation of neural tissue, causes an increase in both GFAP IS (Kraig et al., 1991) and GFAP content (R. P. Kraig et al., unpublished). Thus, other physiologic factors must be involved in triggering increased expression of GFAP. One such factor may be increased neuronal activity and/or associated cellular depolarization. With increased neural activity, neurons depolarize and release a host of neurotransmitters and other paracrine and autocrine substances. Furthermore, interstitial levels of ion concentrations change. For example, K+ rises. Similar changes occur with SD (and exposure to NMDA) Alterations in interstitial [K+ can be expected to modulate astrocytic metabolism and growth under normal and pathological conditions [see Kraig and Jaeger (1991) for review]. Likewise, interstitial glutamate, which is released with neuronal depolarization and is actively metabolized by astrocytes (Hertz and Schousboe, 1986), might play a key role in initiating changes in GFAP IS. If true, then the interrelation of these processes and GFAP expression may be expected to be dose dependent.
Cellular proliferation
In contrast to the dramatic increase in proliferation found with 10 μM NMDA exposure, the reverse was found after 1 μM. An NMDA-induced decrease in proliferation has previously been reported in vivo. Cameron and colleagues (1995) observed a rapid decrease in the number of cells synthesizing DNA following activation of NMDA receptors in the rat DG. However, they did not find changes in the proliferative rate of astrocytes. Despite the NMDA-induced decrease in neuronal proliferation reported in vivo, the increase in overall HOTC cellular proliferation following 10 μM NMDA was likely due to activation of microglia induced by neural lysis. In contrast, following 1 μM NMDA, a reduction in neuronal proliferation may explain the decrease observed in the DG, but it does not account for the decrease in CA1 and CA3, regions where neuronal proliferation is not found postnatally in vivo. A relative immaturity of these latter zones compared with their counterparts in vivo may account for this difference.
CONCLUSION
Taken together, our studies here show that astrogliosis from excitotoxic injury in HOTCs is similar to astroglial changes seen in vivo after global ischemia. Given the ease with which single identified cells can be followed in space and time within HOTCs, our results suggest the HOTCs may be an important preparation with which to examine the cellular and molecular mechanisms as well as consequences of astrogliosis.
Acknowledgments
This work was supported by grants from the National Institute of Neurological Disorders and Stroke (NS-19108), the American Heart Association of Metropolitan Chicago, and the Brain Research Foundation of the University of Chicago. P.E.K. was supported by a National Institutes of Health training grant (5T32-NS-07113) and a National Research Service Award (NS-10190). We thank seveal members of our laboratory for their assistance in this project. Ms. Marcia P. Kraig gave assistance in culture preparation and maintenance. C. D. Lascola and A. O. Caggiano critically read a final version of the manuscript. Mr. R. Hulse did image analyses and restorations.
Abbreviations
- AOI
area of interest
- DG
dentate gyrus
- GBSS
Gey’s Balanced Salt Solution
- GFAP
glial fibrillary acidic protein
- HBSS
HEPES-buffered salt solution
- HEPES
N-2-hydroxyethylpiperazine-N′
- -2-ethanesulfonic acidHOTC
hippocampal organotypic culture
- IS
immunostaining
- NMDA
N-methyl-D-aspartate
- OD
optical density
- PBS
phosphate-buffered saline
- PCNA
proliferating cell nuclear antigen
- SD
spreading depression
References
- 1.Anderson C. Easy-to-alter digital images raise fears of tampering. Science. 1994;263:317–318. doi: 10.1126/science.8278802. [DOI] [PubMed] [Google Scholar]
- 2.Anderson BJ, Li X, Alcantara AA, Isaacs KR, Black JE, Greenough WT. Glial hypertrophy is associated with synaptogenesis following motor-skill learning but not with angiogenesis following exercise. Glia. 1994;11:73–80. doi: 10.1002/glia.440110110. [DOI] [PubMed] [Google Scholar]
- 3.Bahr BA. Long-term hippocampal slices: a model system for investigating synaptic mechanisms and pathologic processes. J Neurosci Res. 1995;42:294–305. doi: 10.1002/jnr.490420303. [DOI] [PubMed] [Google Scholar]
- 4.Berger T, Frotscher M. Distribution and morphological characteristics of oligodendrocytes in the rat hippocampus in situ and in vitro: an immunocytochemical study with the monoclonal Rip antibody. J Neurocytol. 1994;23:61–74. doi: 10.1007/BF01189817. [DOI] [PubMed] [Google Scholar]
- 5.Bignami A, Dahl D. The astroglial response to stabbing. Immunofluorescence studies with antibodies to astrocytic specific protein (GFA) in mammalian and sub-mammalian vertebrates. Neuropathol Appl Neurobiol. 1975;2:99–110. [Google Scholar]
- 6.Bravo R, MacDonald-Bravo H. Existence of two populations of cyclin/proliferating cell nuclear antigen during the cell cycle: association with DNA replication sites. J Cell Biol. 1987;105:1549–1554. doi: 10.1083/jcb.105.4.1549. [DOI] [PMC free article] [PubMed] [Google Scholar]
- 7.Bravo R, Frank R, Blundel PA, MacDonald-Bravo H. Cyclin/PCNA is the auxiliary protein of DNA polymerase δ. Nature. 1987;326:515–517. doi: 10.1038/326515a0. [DOI] [PubMed] [Google Scholar]
- 8.Buchs P-A, Stoppini L, Muller D. Structural modifications associated with synaptic development in area CA1 of rat hippocampal organotypic cultures. Dev Brain Res. 1993;71:81–91. doi: 10.1016/0165-3806(93)90108-m. [DOI] [PubMed] [Google Scholar]
- 9.Burtrum D, Silverstein FS. Hypoxic-ischemic brain injury stimulates glial fibrillary acidic protein mRNA and protein expression in neonatal rats. Exp Neurol. 1994;126:112–118. doi: 10.1006/exnr.1994.1047. [DOI] [PubMed] [Google Scholar]
- 10.Caggiano AO, Kraig RP. Eicosanoids and nitric oxide influence reactive gliosis from spreading depression in microglia but not astrocytes. J Comp Neurol. 1996;369:93–108. doi: 10.1002/(SICI)1096-9861(19960520)369:1<93::AID-CNE7>3.0.CO;2-F. [DOI] [PMC free article] [PubMed] [Google Scholar]
- 11.Cameron HA, McEwen BS, Gould E. Regulation of adult neurogenesis by excitatory input and NMDA receptor activation in the dentate gyrus. J Neurosci. 1995;15:4687–4692. doi: 10.1523/JNEUROSCI.15-06-04687.1995. [DOI] [PMC free article] [PubMed] [Google Scholar]
- 12.Chen H, Chopp M, Schultz L, Bodzin G, Garcia JH. Sequential neuronal and astrocytic changes after transient middle cerebral artery occlusion in the rat. J Neurol Sci. 1993;118:109–116. doi: 10.1016/0022-510x(93)90099-k. [DOI] [PubMed] [Google Scholar]
- 13.Del Rio JA, Heimrich B, Soriano E, Schwegler H, Frotscher M. Proliferation and differentiation of glial fibrillary acidic protein-immunoreactive glial cells in organotypic slice cultures of rat hippocampus. Neuroscience. 1991;43:335–347. doi: 10.1016/0306-4522(91)90298-3. [DOI] [PubMed] [Google Scholar]
- 14.De Vellis J, Wu DK, Kumar S. Enzyme induction and regulation of protein synthesis. In: Federoff S, Vernadakis A, editors. Astrocytes. Vol. 2. New York: Academic Press; 1986. pp. 209–237. [Google Scholar]
- 15.Fowler J, Bornstein MB, Crain SM. Sustained hyperexcitability elicited by repetitive electric stimulation of organotypic hippocampal explants. Brain Res. 1986;378:398–404. doi: 10.1016/0006-8993(86)90945-5. [DOI] [PubMed] [Google Scholar]
- 16.Frotscher M, Zafirov S, Heimrich B. Development of identified neuronal types and of specific synaptic connections in slice cultures of rat hippocampus. Prog Neurobiol. 1995;45:143–164. doi: 10.1016/0301-0082(94)00040-o. [DOI] [PubMed] [Google Scholar]
- 17.Gahwiler BH. Organotypic monolayer cultures of nervous tissue. J Neurosci Methods. 1981;4:329–342. doi: 10.1016/0165-0270(81)90003-0. [DOI] [PubMed] [Google Scholar]
- 18.Gahwiler BH. Development of the hippocampus in vitro: cell types, synapses and receptors. Neuroscience. 1984;11:751–760. doi: 10.1016/0306-4522(84)90192-1. [DOI] [PubMed] [Google Scholar]
- 19.Gould E, Cameron HA, McEwen BS. Blockade of NMDA receptors increases cell death and birth in the developing rat dentate gyrus. J Comp Neurol. 1994;340:551–565. doi: 10.1002/cne.903400408. [DOI] [PubMed] [Google Scholar]
- 20.Greenamyre JT, Olson JMM, Penny JB, Young AB. Autoradiographic characterization of N-methyl-D-aspartate-, qusiqualate-, and kainate-sensitive glutamate binding sites. J Pharmacol Exp Ther. 1985;233:254–263. [PubMed] [Google Scholar]
- 21.Hajos F, Kalman M, Zilles K, Schleicher A, Stonyi P. Remote astrocytic response as demonstrated by glial fibrillary acidic protein immunohistochemistry in the visual cortex of dorsal lateral geniculate nucleus lesioned rat. Glia. 1990;3:301–310. doi: 10.1002/glia.440030410. [DOI] [PubMed] [Google Scholar]
- 22.Hajos F, Balazs R, Baker RE, Gerics B, Nuijtinck R. Structural maturation, cell proliferation and bioelectric activity in long-term slice-cultures of immature rat hippocampus. Int J Dev Nuerosci. 1994;12:87–97. doi: 10.1016/0736-5748(94)90001-9. [DOI] [PubMed] [Google Scholar]
- 23.Hertz L, Shousboe A. Role of astrocytes in compartmentation of amino acid and energy metabolism. In: Vernadakis A, editor. Astrocytes. New York: Academic Press; 1986. pp. 179–208. [Google Scholar]
- 24.Inagaki M, Nakamura Y, Takeda M, Nishimura T, Inagaki N. Glial fibrillary acidic protein: dynamic property and regulation by phosphorylation. Brain Pathol. 1994;4:239–243. doi: 10.1111/j.1750-3639.1994.tb00839.x. [DOI] [PubMed] [Google Scholar]
- 25.Kraig RP, Jaeger CB. Ionic concomitants of astroglial transformation to reactive species. Stroke. 1991;21:III-184–III-187. [PubMed] [Google Scholar]
- 26.Kraig RP, Dong L, Thisted R, Jaeger CB. Spreading depression increases immunohistochemical staining of glial fibrillary acidic protein. J Neurosci. 1991;11:2187–2198. doi: 10.1523/JNEUROSCI.11-07-02187.1991. [DOI] [PMC free article] [PubMed] [Google Scholar]
- 27.Kraig RP, Lascola CD, Caggiano A. Glial response to brain ischemia. In: Kettenmann H, Ransom B, editors. Neuroglia. New York: Oxford Press; 1995. pp. 964–976. [Google Scholar]
- 28.Kunkler PE, Kraig RP. Astrogliosis from excitotoxic injury of hippocampal organ cultures parallels in vivo changes. J Neurotrauma. 1995a;2:982. [Google Scholar]
- 29.Kunkler PE, Kraig RP. Hippocampal organotypic culture can be used to study mechanisms that trigger reactive gliosis. Soc Neurosci Abstr. 1995b;21:43. [Google Scholar]
- 30.Lapling NJ, Morgan TE, Nichols NR, Rozovsky I, Young-Chan CS, Zarow C, Finch CE. Transforming growth factor-β 1 induces neuronal and astrocyte genes: tubulin α1, glial fibrillary acidic protein, and clusterin. Neuroscience. 1994;58:563–572. doi: 10.1016/0306-4522(94)90081-7. [DOI] [PubMed] [Google Scholar]
- 31.Lindsay RM. Reactive gliosis. In: Federoff S, Vernadakis A, editors. Astrocytes. Vol. 3. New York: Academic Press; 1986. pp. 231–262. [Google Scholar]
- 32.Muller D, Buchs PA, Stoppini L. Time course of synaptic development in hippocampal organotypic cultures. Dev Brain Res. 1993;71:93–100. doi: 10.1016/0165-3806(93)90109-n. [DOI] [PubMed] [Google Scholar]
- 33.Murphy GM, Lee YL, Jia X-C, Yu ACH, Majewska A, Song Y, Schmidt K, Eng LF. Tumor necrosis factor alpha and basic fibroblast growth factor decrease glial fibrillary acidic protein and its encoding mRNA in astrocyte cultures and glioblastoma cells. Soc Neurosci Abstr. 1995;21:303. doi: 10.1046/j.1471-4159.1995.65062716.x. [DOI] [PubMed] [Google Scholar]
- 34.Norenberg MD. Astrocyte response to CNA injury. J Neuropathol Exp Neurol. 1994;53:213–220. doi: 10.1097/00005072-199405000-00001. [DOI] [PubMed] [Google Scholar]
- 35.Norenberg MD. Hepatic encephalopathy. In: Kettenmann H, Ransom BR, editors. Neuroglia. New York; Oxford: 1995. pp. 950–963. [Google Scholar]
- 36.Petito CK, Halaby IA. Relationship between ischemia and ischemic neuronal necrosis to astrocyte expression of glial fibrillary acidic protein. Int J Dev Neurosci. 1993;11:239–247. doi: 10.1016/0736-5748(93)90082-o. [DOI] [PubMed] [Google Scholar]
- 37.Petito CK, Morgello S, Felix JC, Lesser ML. The two patterns of reactive astrogliosis in postischemic rat brain. J Cereb Blood Flow Metab. 1990;10:850–859. doi: 10.1038/jcbfm.1990.141. [DOI] [PubMed] [Google Scholar]
- 38.Pozzo Miller LD, Mahanty NK, Connor JA, Landis MD. Spontaneous pyramidal cell death in organotypic slice cultures from rat hippocampus is prevented by glutamate receptor antagonists. Neuroscience. 1994;63:471–487. doi: 10.1016/0306-4522(94)90544-4. [DOI] [PubMed] [Google Scholar]
- 39.Pulsinelli WA, Brierley JB, Plum F. Temporal profile of neuronal damage in a model of transient forebrain ischemia. Ann Neurol. 1982;11:491–499. doi: 10.1002/ana.410110509. [DOI] [PubMed] [Google Scholar]
- 40.Schiffer D, Giordana MT, Cavalla P, Vigliani MC, Attansio A. Immunohistochemistry of glial reaction after injury in the rat: double stainings and markers of cell proliferation. Int J Dev Neurosci. 1993;11:269–280. doi: 10.1016/0736-5748(93)90085-r. [DOI] [PubMed] [Google Scholar]
- 41.Selmaj K, Shafit-Zagardo B, Aquino DA, Farooq M, Raine CS, Norton WT, Brosnan CF. Tumor necrosis factor-induced proliferation of astrocytes from mature brain is associated with downregulation of glial fibrillary acidic protein mRNA. J Neurochem. 1991;57:823–830. doi: 10.1111/j.1471-4159.1991.tb08225.x. [DOI] [PubMed] [Google Scholar]
- 42.Snedecor GW, Cochran WG. Statistical Methods Ames. Iowa State University Press; 1989. pp. 287–288. [Google Scholar]
- 43.Steward O. Electroconvulsive seizures upregulate astroglial gene expression selectively in the dentate gyrus. Mol Brain Res. 1994;25:217–224. doi: 10.1016/0169-328x(94)90156-2. [DOI] [PubMed] [Google Scholar]
- 44.Steward O, Torre ER, Tomasulo R, Lothman E. Neuronal activity up-regulates astroglial gene expression. Proc Natl Acad Sci USA. 1991;88:6819–6823. doi: 10.1073/pnas.88.15.6819. [DOI] [PMC free article] [PubMed] [Google Scholar]
- 45.Stoppini L, Buchs PA, Muller D. A simple method for organotypic cultures of nervous tissue. J Neurosci Methods. 1991;37:173–182. doi: 10.1016/0165-0270(91)90128-m. [DOI] [PubMed] [Google Scholar]
- 46.Takamiya Y, Kohsaka S, Toya S, Otani M, Tsukada Y. Immunohistochemical studies on the proliferation of reactive astrocytes and the expression of cytoskeletal proteins following brain injury in rats. Dev Brain Res. 1988;38:201–210. doi: 10.1016/0165-3806(88)90045-4. [DOI] [PubMed] [Google Scholar]
- 47.Vornov JJ, Tasker RC, Coyle JT. Direct observation of the agonist-specific regional vulnerability to glutamate, NMDA, and kainate neurotoxicity in organotypic hippocampal cultures. Exp Neurol. 1991;114:11–22. doi: 10.1016/0014-4886(91)90079-r. [DOI] [PubMed] [Google Scholar]
- 48.Vornov JJ, Tacker RC, Park J. Neurotoxicity of acute glutamate transport blockade depends on coactivation of both NMDA and AMPA kainate receptors in organotypic hippocampal cultures. Exp Neurol. 1995;133:7–17. doi: 10.1006/exnr.1995.1002. [DOI] [PubMed] [Google Scholar]
- 49.Woods AL, Hall PA, Shepard NA, Hanby AM, Waseem NH, Lane DP, Levison DA. The assessment of proliferating cell nuclear antigen (PCNA) immunostaining in primary gastrointestinal lymphomas and its relationship to histolgoical grade, S + G2 + M phase fraction (flow cytometric analysis) and prognosis. Histopathology. 1991;19:21–27. doi: 10.1111/j.1365-2559.1991.tb00890.x. [DOI] [PubMed] [Google Scholar]
- 50.Zimmer J, Gahwiler BH. Cellular and connective organization of slice cultures of the rat hippocampus and fascia dentata. J Comp Neurol. 1984;228:432–446. doi: 10.1002/cne.902280310. [DOI] [PubMed] [Google Scholar]