

Abstract
PURPOSE
To characterize changes in the corneal epithelial thickness profile induced by myopic LASIK.
METHODS
This was a prospective study of 37 eyes of 19 myopic LASIK patients. Eyes were divided into three groups according to sphere in the maximum myopic meridian: low (−1.00 to −4.00 diopters [D]), moderate (−4.25 to −6.00 D), and high myopia (−6.25 to −13.50 D). The epithelial thickness profile was measured by prototype Artemis very high-frequency (VHF) digital ultrasound scanner (ArcScan Inc) across the central 10-mm corneal diameter preoperatively and between 3 and 6 months postoperatively. The epithelial thickness profile was determined by averaging the epithelial thickness within annular bands centered on the corneal vertex. The change in epithelial thickness profile was calculated as the difference between the preoperative and postoperative epithelial thickness profiles.
RESULTS
The corneal epithelium thickened after myopic LASIK across the central 6 mm with maximum thickening centrally and progressively less thickening centrifugally in low myopia, and a more homogenous thickening in moderate and high myopia within the 5-mm diameter. The mean epithelial thickening at the corneal vertex was 7.41±1.09 μm, 9.29±1.22 μm, and 12.33±1.05 μm for low, moderate, and high myopia, respectively. The rate of epithelial thickening at the corneal vertex per diopter of myopia treated decreased with increasing myopia.
CONCLUSIONS
Although the magnitude of epithelial thickening increased with increasing ablation depth, in accordance with Barraquer’s Law of Thicknesses, the myopic refractive shift due to epithelial thickness profile changes was paradoxically more significant in low myopia than in high myopia.
The corneal epithelium is a highly active, self-renewing layer; a complete turnover occurs in approximately 5 to 7 days.1 Despite this high turnover rate, the epithelium must maintain the same thickness profile over time to maintain corneal power and hence ocular refraction. The epithelial thickness profile can affect the total corneal power both because it determines the shape of the air–tear film interface, but also because of the difference in refractive index between epithelium and stroma (1.401 vs 1.377).2 It has been estimated from corneal keratometry measurements in 10 fresh human eye-bank eyes, with and without epithelium, that the epithelium accounts for an average of 1.03 diopters (D) of corneal power at the central 2-mm diameter zone.3
An increase in central epithelial thickness after LASIK or PRK4-10 has been shown, which has been related to myopic regression.4-6,10-14 However, central epithelial thickening, per se, does not lead to a myopic shift if the epithelium were to thicken evenly across the ablation zone. Jose Ignacio Barraquer’s Law of Thicknesses summarizes that if there is relative tissue addition in the center of the cornea, there will be a myopic refractive shift and conversely if there is relative tissue removal from the center of the cornea or addition in the periphery there will be a hyperopic refractive shift.15 We first published examples of the epithelial thickness profile change after corneal refractive surgery in 1994,16 but these profiles were limited to the central 3-mm diameter and demonstrated that the epithelium thickens in response to stromal ablation and stromal surface irregularities.17
Artemis very high-frequency (VHF) digital ultrasound technology (ArcScan Inc, Morrison, Colo) enables wide angle pachymetry of the individual layers of the cornea continuously over the central 10-mm diameter of the cornea.18 We previously described the use of VHF digital ultrasound to measure corneal epithelium,19 with the first confirmed measurement of the epithelium of the cornea in vivo using a prototype rectilinear VHF digital ultrasound scanning system in 1993.20 We demonstrated that acoustic interfaces detected were indeed located spatially at the epithelial surface and the interface between epithelial cells and the surface of Bowman’s layer.20 We also reported the first high-precision VHF digital ultrasound three-dimensional epithelial thickness mapping system16; VHF digital ultrasound technology has gradually improved both in precision and in area of acquisition. The Artemis I VHF digital ultrasound arc-scanning system enables acquisition of corneal data over a 10-mm diameter. The repeatability of epithelial thickness measurements in 10 consecutive examinations of 1 eye using the Artemis I VHF digital ultrasound arc-scanning system has been shown to be <1.30 μm within an 8-mm diameter, with a central repeatability of 0.50 μm.18 Using this technique, we recently described the in vivo epithelial thickness profile for a group of normal human corneas.21
The purpose of this study was to measure the change in the epithelial thickness profile after myopic LASIK and correlate these changes to the amount of myopia treated. We also set out to characterize the magnitude of the epithelial thickness profile change for low, moderate, and high myopic ablation.
PATIENTS AND METHODS
Patients
This was a prospective study of 19 myopic LASIK patients. Patients were recruited from a high-volume refractive surgical practice (LASIK Vision Canada, Vancouver, Canada) between January and June 1998 by general distribution of an information sheet regarding the nature of the study.
A complete ocular examination was performed including manifest refraction, videokeratographic mapping (TMS-1; Tomey Technologies Inc, Cambridge Mass), and Orbscan topography (Bausch & Lomb, Irvine, Calif) to screen for ocular abnormalities and determine patient candidacy for LASIK. Inclusion criteria in addition to medical candidacy for LASIK included willingness to undergo VHF digital ultrasound scanning of both eyes before and at least 3 months after surgery. LASIK was performed with the Moria LSK-One microkeratome (Moria, Antony, France) with the −1 head and the 130-μm ring and the NIDEK EC-5000 excimer laser platform (NIDEK Co Ltd, Gamagori, Japan). The ablation profiles were based on the Munnerlyn algorithm22 and an optical zone of 6.5 mm with transition to 7.5 mm was used for all eyes.
The study adhered to the tenets of the Declaration of Helsinki and was performed in accordance with an Institutional Review Board approved protocol.
VHF Digital Ultrasound Arc-Scanning
The scanning system and patient setup has been described previously.18 Briefly, patients were placed in the supine position and scanned using a standard ophthalmic immersion technique. A plum-bob aligned fixation target above the eye that was not being scanned provided vertical alignment of both visual axes as well as fixation of the eye during the scan sequence. A VHF (50 MHz) ultrasound broadband transducer (Panametrics Inc, Waltham, Mass) was controlled in a reverse-arc motion to follow the corneal contour and to acquire an 8- to 10-mm–wide corneal B-scan in a single sweep. Ultrasound data were first digitized and stored. The digitized ultrasound data were then transformed using patented Cornell University digital signal processing technology. A speed of sound constant of 1640 m/s was used.
Epithelial Thickness Profile Changes
The epithelial thickness profile for the central 8- to 10-mm corneal diameter was obtained continuously for each eye preoperatively and between 3 months and 6 months postoperatively. Changes in epithelial thickness were calculated as the difference between the pre- and postoperative epithelial thickness data.
To investigate the centrifugal changes in epithelial thickness profile, epithelial thickness was averaged within the 0.25-mm zone centered on the corneal vertex and within four peripheral annular bands each 0.25-mm wide centered on the corneal vertex with central radii of 1.5, 2.0, 2.5, and 3.0 mm (Fig 1). Annular averaging of epithelial thickness was used to homogenize any orthogonal asymmetries that might be introduced by toric ablations.
Figure 1.
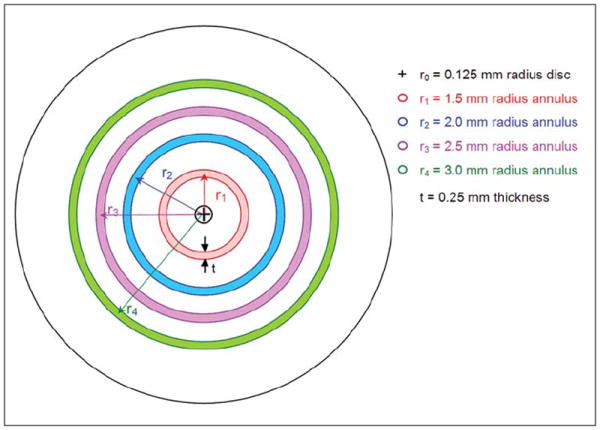
Location of central zone and annular bands centered on the corneal vertex within which epithelial thickness was averaged.
Statistical Analysis
The change in epithelial thickness at the corneal vertex and for each annulus was plotted against the sphere in the maximum myopic meridian for all eyes. The sphere in the maximum myopic meridian was used as it determines the maximum ablation depth. Polynomial regression analysis was performed to seek possible correlations between the amount of epithelial thickening and the sphere in the maximum myopic meridian for the corneal vertex and peripheral annuli. The coefficient of determination (r2) was calculated for the corneal vertex and for each peripheral annulus.
To characterize how the cross-section of the epithelial thickness profile varied depending on the level of myopia, the eyes were grouped based on the sphere in the maximum myopic meridian: low myopia (−1.00 to −4.00 D), moderate myopia (−4.25 to −6.00 D), and high myopia (−6.25 to −13.50 D). The mean (and standard error) epithelial thickness was calculated at the corneal vertex, and at each annulus for each group. The mean epithelial thickness was plotted against the radial distance from the corneal vertex. This analysis was performed for the preoperative epithelial thickness profile, postoperative epithelial thickness profile, and change in epithelial thickness profile.
To determine the rate of corneal vertex epithelial thickening per diopter of myopia treated, the ratio of central epithelial thickening and sphere treated in the maximum myopic meridian was calculated for each eye and averaged within each group: low myopia, moderate myopia, and high myopia.
Student two-sample t tests were carried out to identify any statistically significant differences between refractive groups in preoperative epithelial thickness and in the change in epithelial thickness profile at the corneal vertex and each annulus. Student two-sample t tests were also carried out to determine any statistically significant differences between the epithelial thickening at the corneal vertex and the epithelial thickening at each peripheral location for each refractive group.
Descriptive statistics and comparative statistics were performed in Microsoft Excel 2003 (Microsoft Corp, Redmond, Wash). Polynomial regression analysis was performed using SPSS version 12.0 (SPSS Inc, Chicago, Ill).
RESULTS
During the study period, 37 eyes of 19 patients (19 right and 18 left eyes) were included in the study. A flap complication (free cap) occurred in the left eye of one patient and was excluded from the analysis as no ablation was performed. Thirteen (68%) patients were scanned at 3 months postoperatively and 6 (32%) patients were scanned 6 months postoperatively. Mean age of the population was 37.9±8.6 years (median 37 years, range: 20 to 64 years).
Mean manifest sphere was −4.78±2.77 D (range: 0.00 to −12.25 D), mean manifest cylinder was −0.99±0.91 D (range: 0.00 to −3.00 D), and mean sphere in the maximum myopic meridian was −5.50±2.47 D (range: −1.50 to −13.50 D). The mean sphere in the maximum myopic meridian was −3.33±0.78 D (range: −1.00 to −4.00 D) for the low myopia group (12 eyes), −5.05±0.56 D (range: −4.25 to −6.00 D) for the moderate myopia group (14 eyes), and −8.43±2.35 D (range: −6.25 to −13.50 D) for the high myopia group (11 eyes).
Figure 2 presents a scatterplot of the change in epithelial thickness at the corneal vertex and for each annulus against the sphere in the maximum myopic meridian treated. Figure 2 shows that there was an increase in epithelial thickness after myopic LASIK both at the corneal vertex and for each annulus. More epithelial thickening was noted in high myopia than low myopia; the amount of epithelial thickening increased linearly with increasing ablation depth for low to moderate myopia, and appeared to plateau at approximately 15 μm for high myopia. This trend was characterized by the regression analysis; there was a strong quadratic correlation between the epithelial thickening and level of myopia treated at the corneal vertex and each peripheral annulus. The coefficient of determination (r2) was 0.35 for the corneal vertex (P=.001), 0.59 for the 1.5-mm annulus (P<.001), 0.67 for the 2.0-mm annulus (P<.001), 0.70 for the 2.5-mm annulus (P<.001), and 0.46 for the 3.0-mm annulus (P<.001). The regression lines also demonstrated that there was a pattern for more epithelial thickening at the corneal vertex and progressively less thickening with increasing annular radius.
Figure 2.
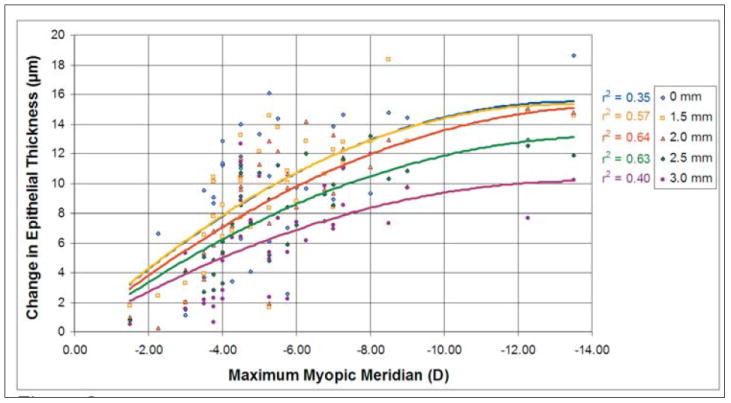
The change in epithelial thickness (μm) at the corneal vertex and for each annulus plotted against the sphere in the maximum myopic meridian. The coefficient of determination (r2) is displayed for the correlation between the change in epithelial thickness and the sphere treated in the maximum myopic meridian for the corneal vertex and each peripheral annulus.
The Table shows the mean pre- and postoperative epithelial thickness and change in epithelial thickness for the corneal vertex and each peripheral annulus grouped into low, moderate, and high myopia. Figure 3A shows the preoperative epithelial thickness profile (continuous lines) and postoperative epithelial thickness profile (dotted lines) for low, moderate, and high myopia. Preoperatively, the epithelial thickness profile was similar for all groups with the thinnest epithelium at the corneal vertex and slightly thicker epithelium peripherally. No statistically significant difference was noted in preoperative epithelial thickness among groups at any location (P>.05 at 0.0-, 1.5-, 2.0-, 2.5-, and 3.0-mm radii). Postoperatively, the epithelium was statistically significantly thicker at all locations for all groups (P<.001), and the epithelial thickness profile had changed to thicker epithelium centrally and progressively thinner epithelium peripherally in low myopia and to a more homogenous epithelial thickening in moderate and high myopia within the 5-mm diameter.
TABLE.
Mean Pre- and Postoperative Epithelial Thickness and Change in Epithelial Thickness at the Corneal Vertex and for Each Annulus*
| Mean Epithelial Thickness (μm) | |||||
|---|---|---|---|---|---|
| Preoperative | |||||
| Annulus radius (mm) | 0.0 | 1.5 | 2.0 | 2.5 | 3.0 |
| Low myopia | 51.12±0.41 | 51.43±0.39 | 51.62±0.36 | 51.58±0.35 | 51.65±0.32 |
| Moderate myopia | 51.28±0.80 | 51.43±0.78 | 51.79±0.78 | 52.21±0.78 | 52.47±0.81 |
| High myopia | 50.13±0.50 | 50.45±0.51 | 50.84±0.58 | 50.90±0.69 | 51.39±0.82 |
| Postoperative | |||||
| Annulus radius (mm) | 0.0 | 1.5 | 2.0 | 2.5 | 3.0 |
| Low myopia | 58.54±1.34 | 57.41±1.08 | 56.14±0.82 | 54.94±0.63 | 53.77±0.45 |
| Moderate myopia | 60.57±1.45 | 61.11±1.21 | 61.10±1.09 | 60.53±0.66 | 59.56±0.54 |
| High myopia | 62.46±1.03 | 63.35±0.96 | 63.01±0.63 | 61.91±0.75 | 60.17±0.99 |
| Change | |||||
| Annulus radius (mm) | 0.0 | 1.5 | 2.0 | 2.5 | 3.0 |
| Low myopia | 7.41±1.09 | 5.98 ±0.85 | 4.51±0.63 | 3.37±0.51 | 2.13 ±0.44 |
| Moderate myopia | 9.29±1.24 | 9.68 ±0.93 | 9.31±0.77 | 8.32±0.60 | 7.09 ±0.85 |
| High myopia | 12.33±1.05 | 12.90±0.81 | 12.17±0.65 | 11.00±0.45 | 8.78 ±0.60 |
Values represented as mean±standard error.
Note. Low myopia (−1.00 to −4.00 D), moderate myopia (−4.25 to −6.00 D), and high myopia (−6.25 to −13.50 D).
Figure 3.
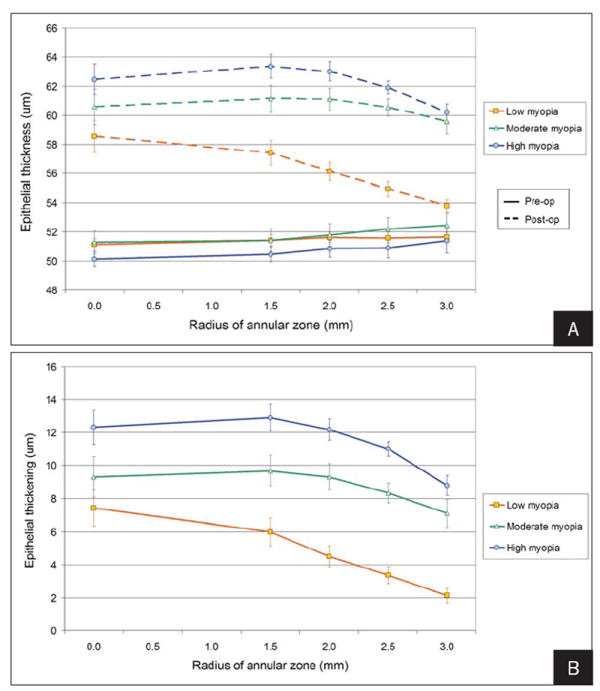
A) Mean epithelial thickness (μm) at the corneal vertex and each annulus plotted for low, moderate, and high myopia groups. The continuous lines show the preoperative epithelial thickness profile. The dashed lines show the postoperative epithelial thickness profile. B) Mean epithelial thickening (μm) at the corneal vertex and each annulus plotted for low, moderate, and high myopia groups.
The effective change in epithelial thickness profile is plotted in Figure 3B. The rate of epithelial thickening at the corneal vertex per diopter of myopia treated decreased with increasing myopia; it was 2.1 μm/D for low myopia, 1.8 μm/D for moderate myopia, and 1.5 μm/D for high myopia. The amount of epithelial thickening was statistically significantly greater for high myopia than low myopia at all locations (P<.05). The amount of epithelial thickening was statistically significantly greater for moderate myopia than low myopia at all peripheral locations (P<.05), but the difference was not statistically significant at the corneal vertex (P=.274). The amount of epithelial thickening was statistically significantly greater for high myopia than moderate myopia at the 1.5-, 2.0-, and 2.5-mm radii (P<.05), but the difference was not statistically significant at the corneal vertex (P=.071) and 3-mm radius (P=.123).
Figure 3B also shows that the profile of the epithelial thickening was different for low, moderate, and high myopia. The low myopia group demonstrated the highest change in gradient of the epithelial thickness profile from center to the periphery. For the low myopia group, no statistically significant difference was noted in the amount of epithelial thickening between the center and 1.5-mm radius (P=.062); however, there was statistically significantly more epithelial thickening centrally than at the 2-, 2.5-, and 3-mm radii (P<.005). For moderate and high myopia, the change in gradient was more gradual with a region of homogeneous epithelial thickening within the central 5-mm diameter. For moderate myopia, there was no statistically significant difference in the amount of epithelial thickening between the center and 1.5- (P=.657), 2.0- (P=.985), 2.5- (P=.371), and 3-mm radii (P=.107). For the high myopia group, no statistically significant difference was noted in the amount of epithelial thickening between the center and the 1.5- (P=.515), 2.0- (P=.860), and 2.5-mm radii (P=.217). However, there was statistically significantly more epithelial thickening centrally than at the 3-mm radii (P=.008).
DISCUSSION
Changes in the epithelial thickness profile following myopic LASIK were characterized. The epithelium thickened postoperatively across the central 6 mm with maximum thickening centrally and progressively less thickening centrifugally in the low myopia group, whereas a more homogenous thickening in the moderate myopia and high myopia group within the 5-mm diameter was noted. Although the epithelium thickened progressively with increasing central ablation depth, paradoxically, the gradient of epithelial thickening from center to periphery was steeper for low myopia than moderate and high myopia. This results in the myopic refractive shift due to epithelial profile changes being more significant for low than high myopic ablations.
The change in epithelial thickness profile between the pre- and postoperative epithelium will affect the refractive power of the epithelium. The increased epithelial thickening at the corneal vertex could partly explain the myopic shift described in the early period after myopic LASIK.4-6,11-13
The epithelium appears to behave as to reverse the change in stromal curvature and return the cornea to its preoperative curvature by remodeling itself to mirror the volume of stromal tissue removed.13,16,17,18,23,24 Huang et al25 published a theoretical mathematical model to simulate epithelial migration after laser refractive surgery. The model was based on partial differential equations commonly used to portray the flow of solute across a concentration gradient, which was assumed to act in a similar fashion to epithelial migration. The model predicted central epithelial thickening after myopic laser ablation producing partial reversal of contour changes modeled by stromal ablation and reduction in the achieved correction. This was in good agreement with our findings for low myopia; however, our clinical data showed that in moderate and high myopia, there was a region of homogeneous epithelial thickening within the central 5-mm diameter. In contrast to the model, which predicted an average 1.5 μm/D of central epithelial thickening after myopic ablation, we found that the rate of thickening (mean thickening per diopter treated) decreased with increasing myopia treated. Our results showed that the rate of central epithelial thickening was 2.1 μm/D for myopia between −1.00 and −4.00 D, 1.8 μm/D for myopia between −4.25 and −6.00 D, and 1.5 μm/D for myopia between −6.25 and −13.50 D. There appears to be certain biological constraints acting in moderate and high myopia, which distinguish the epithelial changes observed herein clinically from the theoretical model.
To better understand how epithelial changes are affected by the ablation depth, further study with a higher number of eyes is required. Increasing the number of eyes will increase the power of the statistical analysis and overcome some of the drawbacks of this study. For example, we were able to demonstrate a statistically significant difference between central epithelial thickening and epithelial thickening at the 3-mm radius for high myopia; however, the difference was not statistically significant for moderate myopia. This could be due to the sample size; power analysis indicated that a sample of at least 30 eyes per group would be required for a difference of 2 μm to be statistically significant. Further improvements in the study design, such as excluding eyes with astigmatism and limiting the spherical refraction groups to distinct narrow ranges, might also be helpful in investigating the epithelial response as a function of myopia treated.
Myopic shift after myopic LASIK is well documented, 4,26,27 and it has been suggested that other biomechanical changes in the cornea as well as epithelial changes are involved in myopic regression. We have previously demonstrated using VHF digital ultrasound scanning that biomechanical changes are responsible for thickening of the stroma peripheral to the ablation zone and flap.18 Roberts28,29 proposed a model to explain this mechanism and concluded that biomechanical considerations will have to be taken into account for accurate wavefront-guided correction of the cornea. The results of the present study suggest that it might also be beneficial to consider changes in the epithelial thickness profile as epithelial healing plays a role in the final refractive result. This is particularly important when using corneal wavefront treatment as the ablation depth is modulated by only very small amounts when attempting to correct higher order aberrations.
We have shown that the change in epithelial thickness profile induced by myopic LASIK results in a myopic shift. Although the magnitude of epithelial thickening increased with increasing ablation depth, paradoxically, myopic refractive shift due to epithelial profile changes was more significant in low myopia than in high myopia.
Acknowledgments
Supported in part by NIH grant EB000238 and the Dyson Foundation, Millbrook, NY.
Footnotes
Drs Reinstein, Silverman, Sutton, and Coleman have a proprietary interest in the Artemis technology (ArcScan Inc, Morrison, Colo). The remaining authors have no proprietary or financial interest in the materials presented herein.
Preparation in part fulfillment of the requirements for the doctoral thesis, University of Cambridge, for Dr Reinstein.
Presented in part at the Association for Research in Vision and Ophthalmology Annual Meeting; May 9-14, 1999; Ft Lauderdale, Fla.
References
- 1.Hanna C, O’Brien JE. Cell production and migration in the epithelial layer of the cornea. Arch Ophthalmol. 1960;64:536–539. doi: 10.1001/archopht.1960.01840010538009. [DOI] [PubMed] [Google Scholar]
- 2.Patel S, Marshall J, Fitzke FW., III Refractive index of the human corneal epithelium and stroma. J Refract Surg. 1995;11:100–105. doi: 10.3928/1081-597X-19950301-09. [DOI] [PubMed] [Google Scholar]
- 3.Simon G, Ren Q, Kervick GN, Parel JM. Optics of the corneal epithelium. Refract Corneal Surg. 1993;9:42–50. [PubMed] [Google Scholar]
- 4.Lohmann CP, Guell JL. Regression after LASIK for the treatment of myopia: the role of the corneal epithelium. Semin Ophthalmol. 1998;13:79–82. doi: 10.3109/08820539809059822. [DOI] [PubMed] [Google Scholar]
- 5.Erie JC, Patel SV, McLaren JW, Ramirez M, Hodge DO, Maguire LJ, Bourne WM. Effect of myopic laser in situ keratomileusis on epithelial and stromal thickness: a confocal microscopy study. Ophthalmology. 2002;109:1447–1452. doi: 10.1016/s0161-6420(02)01106-5. [DOI] [PubMed] [Google Scholar]
- 6.Spadea L, Fasciani R, Necozione S, Balestrazzi E. Role of the corneal epithelium in refractive changes following laser in situ keratomileusis for high myopia. J Refract Surg. 2000;16:133–139. doi: 10.3928/1081-597X-20000301-05. [DOI] [PubMed] [Google Scholar]
- 7.Wang J, Thomas J, Cox I, Rollins A. Noncontact measurements of central corneal epithelial and flap thickness after laser in situ keratomileusis. Invest Ophthalmol Vis Sci. 2004;45:1812–1816. doi: 10.1167/iovs.03-1088. [DOI] [PubMed] [Google Scholar]
- 8.Wirbelauer C, Pham DT. Monitoring corneal structures with slitlamp-adapted optical coherence tomography in laser in situ keratomileusis. J Cataract Refract Surg. 2004;30:1851–1860. doi: 10.1016/j.jcrs.2004.01.035. [DOI] [PubMed] [Google Scholar]
- 9.Gauthier CA, Holden BA, Epstein D, Tengroth B, Fagerholm P, Hamberg-Nyström H. Factors affecting epithelial hyperplasia after photorefractive keratectomy. J Cataract Refract Surg. 1997;23:1042–1050. doi: 10.1016/s0886-3350(97)80078-8. [DOI] [PubMed] [Google Scholar]
- 10.Lohmann CP, Patmore A, Reischl U, Marshall J. The importance of the corneal epithelium in excimer-laser photorefractive keratectomy. Ger J Ophthalmol. 1996;5:368–372. [PubMed] [Google Scholar]
- 11.Gauthier CA, Holden BA, Epstein D, Tengroth B, Fagerholm P, Hamberg-Nystrom H. Role of epithelial hyperplasia in regression following photorefractive keratectomy. Br J Ophthalmol. 1996;80:545–548. doi: 10.1136/bjo.80.6.545. [DOI] [PMC free article] [PubMed] [Google Scholar]
- 12.Lohmann CP, Reischl U, Marshall J. Regression and epithelial hyperplasia after myopic photorefractive keratectomy in a human cornea. J Cataract Refract Surg. 1999;25:712–715. doi: 10.1016/s0886-3350(99)00014-0. [DOI] [PubMed] [Google Scholar]
- 13.Reinstein DZ, Ameline B, Puech M, Montefiore G, Laroche L. VHF digital ultrasound three-dimensional scanning in the diagnosis of myopic regression after corneal refractive surgery. J Refract Surg. 2005;21:480–484. doi: 10.3928/1081-597X-20050901-10. [DOI] [PubMed] [Google Scholar]
- 14.Patel SV, Erie JC, McLaren JW, Bourne WM. Confocal microscopy changes in epithelial and stromal thickness up to 7 years after LASIK and photorefractive keratectomy for myopia. J Refract Surg. 2007;23:385–392. doi: 10.3928/1081-597X-20070401-11. [DOI] [PubMed] [Google Scholar]
- 15.Barraquer JI. Queratomileusis y Queratofakia. Bogota, Columbia: Instituto Barraquer de America; 1980. p. 342. [Google Scholar]
- 16.Reinstein DZ, Silverman RH, Trokel SL, Coleman DJ. Corneal pachymetric topography. Ophthalmology. 1994;101:432–438. doi: 10.1016/s0161-6420(94)31314-5. [DOI] [PubMed] [Google Scholar]
- 17.Reinstein DZ, Silverman RH, Sutton HF, Coleman DJ. Very high-frequency ultrasound corneal analysis identifies anatomic correlates of optical complications of lamellar refractive surgery: anatomic diagnosis in lamellar surgery. Ophthalmology. 1999;106:474–482. doi: 10.1016/S0161-6420(99)90105-7. [DOI] [PubMed] [Google Scholar]
- 18.Reinstein DZ, Silverman RH, Raevsky T, Simoni GJ, Lloyd HO, Najafi DJ, Rondeau MJ, Coleman DJ. Arc-scanning very high-frequency digital ultrasound for 3D pachymetric mapping of the corneal epithelium and stroma in laser in situ keratomileusis. J Refract Surg. 2000;16:414–430. doi: 10.3928/1081-597X-20000701-04. [DOI] [PubMed] [Google Scholar]
- 19.Reinstein DZ, Silverman RH, Rondeau MJ, Coleman DJ. Epithelial and corneal thickness measurements by high-frequency ultrasound digital signal processing. Ophthalmology. 1994;101:140–146. doi: 10.1016/s0161-6420(94)31373-x. [DOI] [PubMed] [Google Scholar]
- 20.Reinstein DZ, Silverman RH, Coleman DJ. High-frequency ultrasound measurement of the thickness of the corneal epithelium. Refract Corneal Surg. 1993;9:385–387. [PubMed] [Google Scholar]
- 21.Reinstein DZ, Archer TJ, Gobbe M, Silverman RH, Coleman DJ. Epithelial thickness in topography of the normal cornea: three-dimensional display with Artemis very high-frequency digital ultrasound. J Refract Surg. 2008;24:571–581. doi: 10.3928/1081597X-20080601-05. [DOI] [PMC free article] [PubMed] [Google Scholar]
- 22.Munnerlyn CR, Koons SJ, Marshall J. Photorefractive keratectomy: a technique for laser refractive surgery. J Cataract Refract Surg. 1988;14:46–52. doi: 10.1016/s0886-3350(88)80063-4. [DOI] [PubMed] [Google Scholar]
- 23.Reinstein DZ, Couch DG, Archer T. Direct residual stromal thickness measurement for assessing suitability for LASIK enhancement by Artemis 3D very high-frequency digital ultrasound arc scanning. J Cataract Refract Surg. 2006;32:1884–1888. doi: 10.1016/j.jcrs.2006.08.020. [DOI] [PubMed] [Google Scholar]
- 24.Reinstein DZ, Archer T. Combined Artemis very high-frequency digital ultrasound-assisted transepithelial phototherapeutic keratectomy and wavefront-guided treatment following multiple corneal refractive procedures. J Cataract Refract Surg. 2006;32:1870–1876. doi: 10.1016/j.jcrs.2006.07.016. [DOI] [PubMed] [Google Scholar]
- 25.Huang D, Tang M, Shekhar R. Mathematical model of corneal surface smoothing after laser refractive surgery. Am J Ophthalmol. 2003;135:267–278. doi: 10.1016/s0002-9394(02)01942-6. [DOI] [PubMed] [Google Scholar]
- 26.Chayet AS, Assil KK, Montes M, Espinosa-Lagana M, Castellanos A, Tsioulias G. Regression and its mechanisms after laser in situ keratomileusis in moderate and high myopia. Ophthalmology. 1998;105:1194–1199. doi: 10.1016/S0161-6420(98)97020-8. [DOI] [PubMed] [Google Scholar]
- 27.Pan Q, Gu YS, Wang J, Sheng Y, Du CX, Huang ZM, Xin SH. Differences between regressive eyes and non-regressive eyes after LASIK for myopia in the time course of corneal changes assessed with the Orbscan. Ophthalmologica. 2004;218:96–101. doi: 10.1159/000076143. [DOI] [PubMed] [Google Scholar]
- 28.Roberts C. The cornea is not a piece of plastic. J Refract Surg. 2000;16:407–413. doi: 10.3928/1081-597X-20000701-03. [DOI] [PubMed] [Google Scholar]
- 29.Roberts C. Biomechanics of the cornea and wavefront-guided laser refractive surgery. J Refract Surg. 2002;18:S589–S592. doi: 10.3928/1081-597X-20020901-18. [DOI] [PubMed] [Google Scholar]