Abstract
Glomerular capillary hemorrhage (GCH) induced by ultrasonic cavitation during diagnostic imaging represents a unique contrast-agent related nephron injury. Consequences of GCH during 1.5 MHz diagnostic ultrasound with contrast agent were examined by histological methods in rats. Definity was infused at 10 μl/kg/min for 5 min at the start of 8 min of intermittent image-exposure with 2.3 MPa in situ peak rarefactional pressure amplitude. Kidney samples were taken for histology at 5 min, 30 min, 4 h, 2 d, 1 wk and 4 wks post exposure. In addition, samples were taken at 4 h from groups treated with heparin or aminocaproic acid. GCH was found in 61% of glomeruli in the center of the scan plane 5 min after exposure, which declined (P<0.05) to 36.3 % after 4 hr. The width of Bowman’s space was significantly increased for glomeruli with GCH relative to glomeruli without GCH (P<0.05), consistent with tubular obstruction. Antibody staining revealed fibrin clotting in Bowman’s space in 4 hr samples and this persisted in the 2 d samples. Heparin reduced and aminocaproic acid increased the GCH seen in 4 h samples. Tubular dilatation was evident with injury to the epithelium after 2d. After 1 week, areas of inflammatory cell infiltration were present. After 4 weeks, areas of interstitial fibrosis were revealed by Masson’s trichrome stain. The consequences of GCH induced by diagnostic ultrasound with contrast agents include rupture of glomerular capillaries, procoagulant activity resulting in intra-tubular obstruction, and the potential for progression of the resulting tubular injury toward interstitial fibrosis.
Keywords: diagnostic ultrasound adverse effects, ultrasonic cavitation biology, glomerular hemorrhage, fibrin formation in Bowman’s space, renal intra-tubular obstruction, heparin, aminocaproic acid
INTRODUCTION
Contrast agents developed for diagnostic ultrasound are injectable suspensions of gas bodies (stabilized microbubbles), which provide a strong echo-return for image enhancement (Averkiou et al. 2003). The gas bodies can be destabilized at peak rarefactional pressure amplitudes (PRPA) within the diagnostic range and can serve as individual nuclei for acoustic cavitation. Cavitation bioeffects in animals are normally very difficult to study, owing to a lack of cavitation nuclei. Since ultrasound contrast agents provide optimal sized gas bodies for nucleation, the agents have been a boon to research into ultrasonic cavitation biology. This research has identified several bioeffects associated with use of contrast agent enhanced diagnostic ultrasound, particularly in certain intermittent modes of imaging which utilize the gas body destabilization and destruction for imaging of perfusion (Miller et al. 2008a). Capillary rupture has been observed in intestine (Miller and Geis, 1998), skeletal muscle (Skyba et al. 1998; Miller and Quddus, 2000), heart (Ay et al. 2001; Li et al. 2004), and kidney (Wible et al. 2002; Miller et al. 2007). Other effects include cardiomyocyte killing (Miller et al. 2005), and hematuria accompanied by localized acute tubular necrosis in kidney (Williams et al. 2007). Premature ventricular contractions (van Der Wouw et al. 2000), and increased heart enzymes in blood (Vancraeynest et al. 2007), which are indicative of myocardial injury, have been observed in humans. In addition, the reliable nucleation of cavitation in vivo has opened novel avenues of research on possible therapeutic applications of ultrasonic cavitation, including drug delivery, clot reduction and gene therapy (Miller et al. 2008a). However, the consequences and medical significance of cavitation bioeffects remain uncertain. Basic research information is needed on the microscale changes in the vicinity of a cavitation nucleation site and the consequences for the tissue or organ in vivo.
Previous research suggested that the rupture of a capillary in a glomerulus of the rat kidney by diagnostic ultrasound with contrast agent could impact the associated nephron tubular system (Williams et al. 2007). In some glomeruli, the associated hemorrhage tended to fill Bowman’s urinary space and tubules and indications of fibrin formation were evident upon histological examination. After a day, changes in some regions of the tubular epithelium were indicative of acute tubular necrosis. The reason for this nephron-wide impact from the initial microscopic capillary hemorrhage was uncertain but one factor could have been that the hemorrhage actually obstructed the tubular system of some nephrons.
Renal injury can result from a variety of insults including ischemia (Shanley 1996), ureteral obstruction (Chevalier 2006), and many different drugs (Choudhury and Aymed 2006). Acute tubular necrosis is seen for many such insults and can be life threatening for global organ injury and renal failure. In radiological imaging, contrast agents for x-ray imaging (Deray et al. 1990; Tumlin et al. 2006), or magnetic resonance imaging (Ersoy and Rybicki 2007), have troublesome renal side effects. Glomerular injury can lead to injury of the tubular epithelium, inflammation and interstitial fibrosis and scarring (Eddy 1994; Strutz and Muller 1999). In addition, fibrin formation and clotting within the glomerulus can be involved in the disease progression (Bergstein 1990; Hertig and Rondeau 2004). Common drugs used to modulate the coagulation process influence the impact of glomerular fibrin formation. The anticoagulant heparin reduced Bowman’s space widening, which indicated intratubular obstruction, in a rat model of renal ischemia (Druid et al. 1998). The pro-coagulant aminocaproic acid also seemed to have a beneficial effect in a rat model of immune nephritis (Hruby et al. 1996).
The glomerular injury induced by diagnostic ultrasound with contrast agents is instantaneous capillary hemorrhage (I. e., at the time of arrival of ultrasound imaging pulses), which subsequently appears to impact the associated tubular system. The cavitation-induced GCH may be a unique form of renal injury, because individual nephrons can be substantially effected while the remainder of the young healthy kidney may be completely free of any ultrasonic bioeffects. For example, the renal toxicity of radiocontrast or MR contrast agents is biochemical in nature over the entire organ, which is qualitatively different from the physical interaction of ultrasound pulses with ultrasound contrast agent gas bodies leading to isolated GCH. An isolated nephron injured by cavitation-induced GCH might be able to heal and completely resolve the injury, owing to the absence of any adverse influences from organ-wide toxicity or pre-existing chronic disease.
The purpose of this study was to define and quantify the progression of the nephron injury from cavitation induced GCH, especially in regard to the possibility of tubular obstruction of individual nephrons. Rats were scanned from the right side with intermittent diagnostic ultrasound images of the kidney at high PRPA, and a high dose of contrast agent. The GCH was characterized histologically at several time points and the width of Bowman’s space was measured to identify tubular obstruction. In addition, the formation of clots within the urinary space was characterized by fibrin/fibrinogen immunohistochemistry. Finally, progression of the injury was noted at 1 and 4 weeks post exposure.
METHODS
Animal preparation
This investigation was conducted with the approval of the University Committee on the Use and Care of Animals, University of Michigan. A total of 53 rats (CD hairless, Charles River Laboratories, Wilmington MA) were used in this study, which weighed 272 ± 58 gm. The rats were anesthetized by ketamine (87 mg/kg) plus xylazine (13 mg/kg) injection into the lower abdomen. For intravenous injections, a 24 gauge cannula was inserted into a tail vein. The anesthetized rats were mounted on a plastic holder, which was placed vertically in a water bath filled with 37°C degassed water, with their right side facing the ultrasound transducer.
Diagnostic Ultrasound with Contrast Agent
The diagnostic ultrasound exposure with contrast agent has been described previously (Miller et al. 2007). Briefly, a phased array probe (FPA2.5, GE Vingmed System V, General Electric Co., Cincinnati OH) operated at a frequency setting of 1.5 MHz was clamped in the water bath with the right kidney located 3.5–4.5 cm from the transducer face. At this position, the peak rarefactional pressure amplitude (PRPA) was maximal and the −6 dB scan plane thickness (beam width) was 4.6 mm. No tissue mimicking materials were used in this study. The PRPA at the kidney was determined by calibrated hydrophone measurement of the free field in water with a 3.8 cm path length. The in situ PRPA was estimated to be 2.3 MPa, including a correction for the attenuation between the skin and kidney (−0.45 dB). This was essentially at the upper limit for diagnostic ultrasound at 1.5 MHz and corresponds to a Mechanical Index of MI = 1.9 (on screen MI = 1.7). Intermittent image scans were based on real time scanning at 36.4 fps. Two image scans separated by 33 ms were triggered at 1 s intervals to show destruction of contrast agent gas bodies (by the loss of enhanced contrast in the second image relative to the first). The 1 s intermittent interval was set to allow time for refill of blood with gas bodies into the scan plane between images (Miller et al. 2007).
The ultrasound contrast agent was Definity® (perflutren lipid microsphere injectable suspension, Lantheus Medical Imaging, Inc., N. Billerica, MA USA), which was prepared each day according to the manufacturer’s instructions. The agent was infused at 10 μl/kg/min, as described previously (Miller et al. 2007). For exposure, the contrast infusion was started and timed for 5 min after the contrast enhancement began to appear in the image, with scanning continued for 3 min after the infusion was stopped. For sham exposure, the rat was scanned for 8 min using the same setting, and then the contrast agent was infused for 5 min with the ultrasound off. Contrast agents are used for diagnostic ultrasound of kidney (Correas et al. 2006); however, the imaging-exposure protocol used here likely involved longer scanning of a single plane and higher agent dose than would be expected in normal clinical use (I. e. the infusion rate range recommended in the package insert was approximately 1.5–3.7 μl/kg/min based on a 70 kg human). The protocol was intended to provide ample glomerular capillary hemorrhage for histological evaluation.
Measured Endpoints
Glomerular capillary hemorrhage was evaluated by histology as described previously (Miller et al. 2007). Kidney samples were removed, trimmed and immersion fixed in neutral buffered formalin. Histological processing was performed at the Research Histology and Immunoperoxidase Laboratory of the University of Michigan Comprehensive Cancer Center Tissue Core. For this study, glomeruli were scored in two categories: those having many red cells nearly filling Bowman’s space, and the total with any evidence of GCH, which included as few as two red cells in different areas identifiable as Bowman’s space. Hematuria was measured in urine samples collected for 4 h post-exposure from rats allowed to waken in urine collection cages. A hematuria score was obtained using urine test strips as described previously (Williams et al. 2007).
In a previous study, some glomeruli appeared to have fibrin in Bowman’s space, which was confirmed by separate electron microscope observation (Williams et al. 2007). Further identification of the formation and extent of clots in Bowman’s space was obtained in this study by immunohistochemistry. Rabbit anti-human antibody to fibrinogen (Dako North America, Capinteria CA, USA) was used to tag the clots. The clots were then visualized with peroxidase labeled anti-rabbit antibody and DAB staining. Negative controls were run on separate slides using normal rabbit immunoglobulin fraction. The slides stained for fibrin were scored for the percentage of glomeruli with clearly identifiable clots, which stained dark brown.
Bowman’s space measurement
During scoring of the histological sections for red blood cells (RBCs) in Bowman’s space, a variation in the extent of RBC filling was noted. The glomeruli were scored as negative (no RBCs), a few RBCs and full of RBCs. The Bowman’s spaces, which appeared to be full of RBCs, also appeared to be wider than the others. The approximate width of Bowman’s space of the different scoring categories was determined by measurements from photographs made of the histological slides. Groups of three photomicrographs using a 20 x objective and digital camera (Spot Flex model 15.2, Diagnostic Instruments Inc., Sterling Heights MI USA) were made in a sequence moving inward from the surface of the kidney to the medula, which was intended to include any systematic variation with depth into the cortex. Three groups of 3 photomicrographs were made about 90 degrees apart around the cortex. The 9 photomicrographs included a 0.51 mm2 area, which was about 9.2 % of the cortex cross section.
The Bowman’s space was irregular in most glomeruli; however, the tuft and capsule were approximately circular. The area occupied by the capillary tuft and the area enclosed by the capsule were measured on calibrated photomicrographs using Spot software (v4.5, Diagnostic Instruments Inc., Sterling Heights, MI USA). The approximate radius of each area was calculated by assuming the area was circular. The radius of the tuft was subtracted from the radius of the capsule to obtain the estimate of the width of Bowman’s space. In order to minimize the error in the measurement occurring for smaller radii seen when a glomerulus was cut near the poles, the smallest radii were excluded form the data. The cutoff was arbitrarily made at 0.866 (the cosine of 30° of the median radius of the capillary tuft in each group.
Experimental plan and statistics
There were a total of eleven separate groups of rats with different treatments. The central test involved a sham group of 4 rats and an exposed group of 5 rats for which urine was collected for 4 h, followed by euthanasia and kidney removal for histology. In addition, groups of 5 rats were euthanized at approximately 5 min and 30 min post exposure in order to follow the wash-out of red cells from Bowman’s space. A group of 5 rats with 4 h urine collection was also kept for 2 days before euthanasia in order to gauge the rate of fibrin removal from glomeruli. Groups of 4 exposed rats were kept for 1 week and for 4 weeks in an effort to follow the resolution of the injury. Two sets of sham (4 rats) and exposed (5 rats) groups, which had 4 h urine collection followed by euthanasia, were used to assess the influence of two common clinical drugs on the GCH clotting. Heparin was administered IV 1 hour before exposure at a dose of 500 units/kg, which was expected to reduce clotting (Daykin et al. 2006). Aminocaproic acid (ACA) was administered IV at a dose of 300 mg/kg at 18 h and 6 h pre exposure and at the time of exposure, which was expected to enhance clotting (Hruby et al. 1996).
Numerical results are presented as the mean plus/minus the standard deviation for groups of 4 or 5 samples, or plotted as the mean with standard error bars. Three rats died, apparently from the anesthesia, and were lost to the study. Results for one animal were excluded from the heparin exposure group, due to an apparent omission of the drug treatment. For statistical analysis, Student’s t-tests or Mann-Whitney rank sum tests were used to compare means of the measured parameters, with statistical significance assumed at P=0.05. For analysis of variation in the multiple subgroups for the measurements of Bowman’s space, a one-way ANOVA on ranks was performed with multiple comparisons versus the sham by Dunn’s method (SigmaPlot 11, Systat Software Inc., San Jose, CA USA).
RESULTS
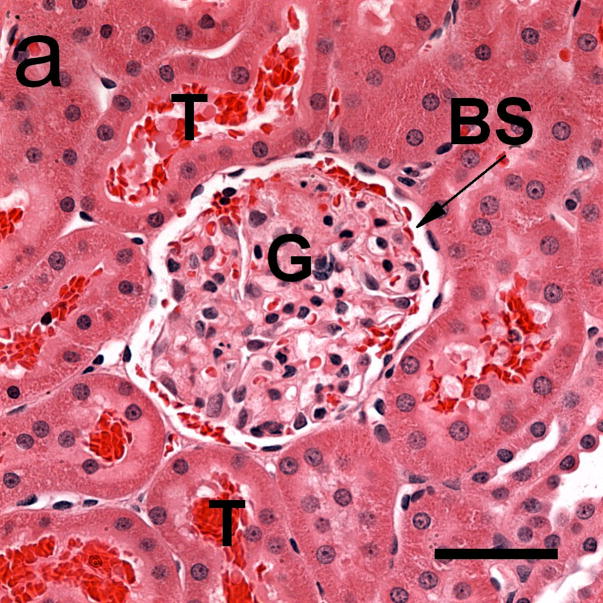
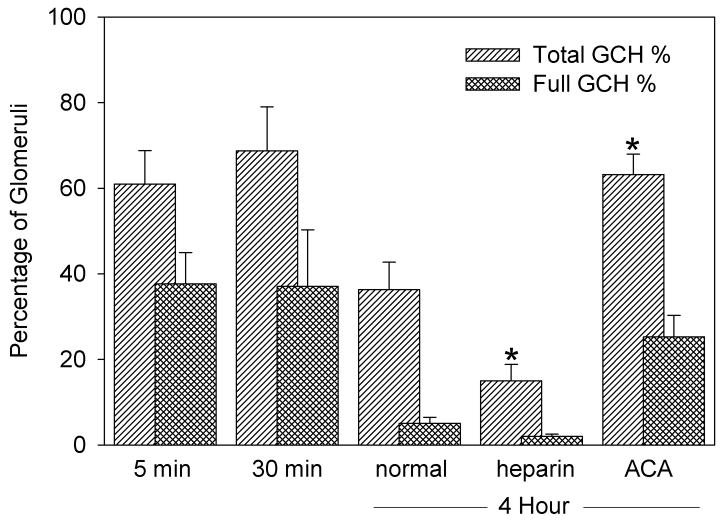
Numerical results are listed in Table 1. The mean hematuria score for the exposed groups was significantly increased (P<0.05) from the shams. GCH was found in 61% of glomeruli in the center of the scan plane 5 min after exposure, which declined (P<0.05) to 36.3 % after 4 h. After 2 days, no red cells remained in Bowman’s space. The numbers of glomeruli packed with red cells and those with only a few cells in Bowman’s space were separately scored. This was a subjective distinction, but reasonably robust, as shown in Fig. 1. Glomeruli with the urinary space full of red cells tended to have an enlarged width of the Bowman’s space, as noted below. Results for GCH are compared in Fig. 2 for the different time points. The numbers of glomeruli with Bowman’s space full of red cells decreased substantially (P<0.05) after 4 h.
Table 1.
Summary of data collected on effects related to glomerular capillary hemorrhage (GCH), including hematuria, the percentage of glomeruli with GCH, the percentage of glomeruli with fibrin staining, and the width of Bowman’s space (BSW) for glomeruli without and with GCH. Values are means ± one standard deviation or not determined (nd).
| Group | Drug Treatment | Sample Delay | Hematuria Score | GCH % | Fibrin % | BSW w/o GCH μm | BSW w/GCH μm |
|---|---|---|---|---|---|---|---|
| Exposed | none | 5 min | nd | 61.0 ± 17.5 | nd | 8.7 ± 2.2 | 15.6 ± 6.0 |
| Exposed | none | 30 min | nd | 68.7 ± 23.0 | nd | 9.2 ± 3.6 | 15.6 ± 6.9 |
| Sham | none | 4 h | 0.6 ± 0.5 | 0 | 0 | 7.1 ± 2.1 | nd |
| Exposed | none | 4 h | 50 ± 23 | 36.3 ± 14.3 | 46.8 ± 13.3 | 8.9 ± 3.3 | 14.0 ± 6.5 |
| Exposed | none | 2 d | 56 ± 31 | 0 | 11.8 ± 4.8 | 9.2 ± 2.8 | nd |
| Sham | heparin | 4 h | 2.6 ± 3.0 | 0 | 0 | 7.4 ± 1.8 | nd |
| Exposed | heparin | 4 h | 53 ± 18 | 15.0 ± 7.7 | 32.0 ± 11.3 | 9.0 ± 3.4 | 15.6 ± 5.2 |
| Sham | ACA | 4 h | 2.0 ± 1.7 | 0 | 0 | 7.9 ± 2.1 | nd |
| Exposed | ACA | 4 h | 52 ± 15 | 63.7 ±10.7 | 67.8 ± 22.0 | 9.0 ± 2.3 | 14.3 ± 5.5 |
Figure 1.
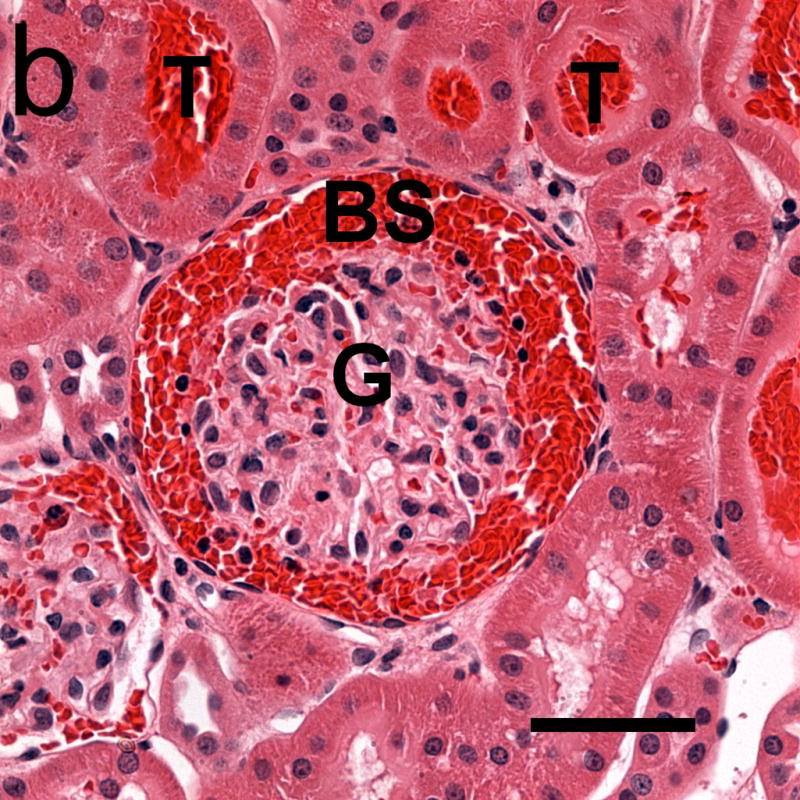
Photomicrographs of glomeruli (G) with capillary hemorrhage in samples taken 5 min after exposure (a) with only a few red cells evident in Bowman’s space (BS) and (b) with Bowman’s space virtually full of red cells. Red cells also appear in some urinary tubules (T). Scale bar: 50 μm.
Figure 2.
The percentage of glomeruli having glomerular capillary hemorrhage (GCH) counted in histological sections for samples taken at the indicated times after exposure, and with the indicated drug treatment. There was no GCH in shams. The percentage which appeared to be full of hemorrhaged red cells is also shown. For the 4 h samples, the GCH was significantly (*) decreased for heparin treated rats (P<0.05), and increased for aminocaproic acid treated rats (P<0.02), relative to normal rats.
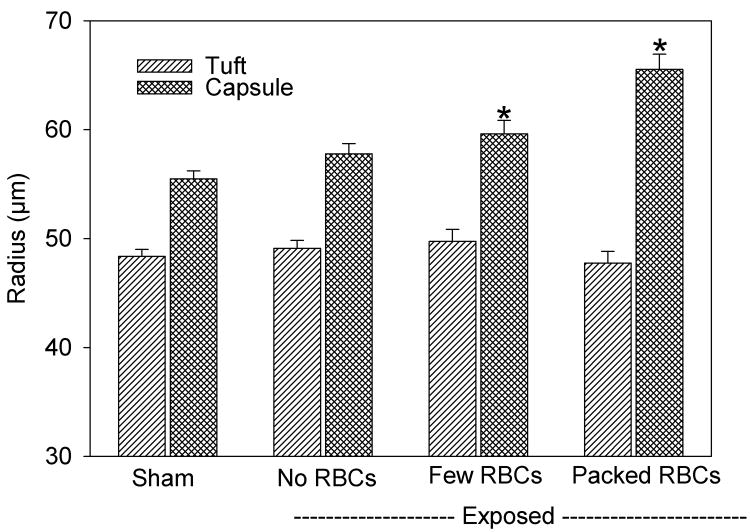
The classification of the Bowman’s spaces, which had few cells or were full of cells, seemed to be an important distinction. The full spaces tended to have clots and also showed widening of the Bowman’s space, which is indicative of intratubular obstruction. The width of Bowman’s space was measured for the sham and exposed samples at 5 min for the three categories of glomeruli: normal without red cells in Bowman’s space, GCH with some red cells in Bowman’s space and GCH with Bowman’s space full of red cells. Results for the radii of the capillary tuft and capsule are shown in Fig. 3. ANOVA showed that the radius of the tuft was not significantly different for any group. However, the radius of the capsule and the width of Bowman’s space (the difference between the tuft and capsule radii) were significantly different for both categories of GCH (P<0.05). It seems likely that the swelling of Bowman’s capsule results from an increase in the hydrostatic pressure due to the hemorrhage and tubular obstruction (eliminating the filtration pressure differential), which was most pronounced for the glomeruli packed with cells. Numerical data for the width of Bowman’s space is listed in Table 1 for normal glomeruli and the combined result for both categories of GCH.
Figure 3.
A plot of measurements of the radii of the glomerular tuft and capsule in histological samples taken 5 min after exposure. For glomeruli with GCH, the radius of the capsule was significantly (*) increased (P<0.05), but the radius of the tuft was unchanged, relative to shams. The width of Bowman’s space (the capsule radius minus the tuft radius) was approximately doubled for glomeruli with GCH.
The Bowman’s spaces, which appeared to be full of red cells, also tended to show indications of fibrin and clotting. The fibrinogen antibody staining confirmed the formation of clots in Bowman’s space as shown in Fig. 4 for 4 h samples. The fibrin clots seemed to be retained in Bowman’s space even when most of the red cells were gone. No clotting was seen in the shams. The percentages of glomeruli with clear clot formation are listed in Table 1. The clotting persisted in the 2 d samples, but was significantly reduced (P<0.001). Fig. 5 shows a glomerulus from a 2 d sample with some clot remaining in Bowman’s space. In addition, nearby tubules are dilatated, which represents injury to the tubular epithelium.
Figure 4.
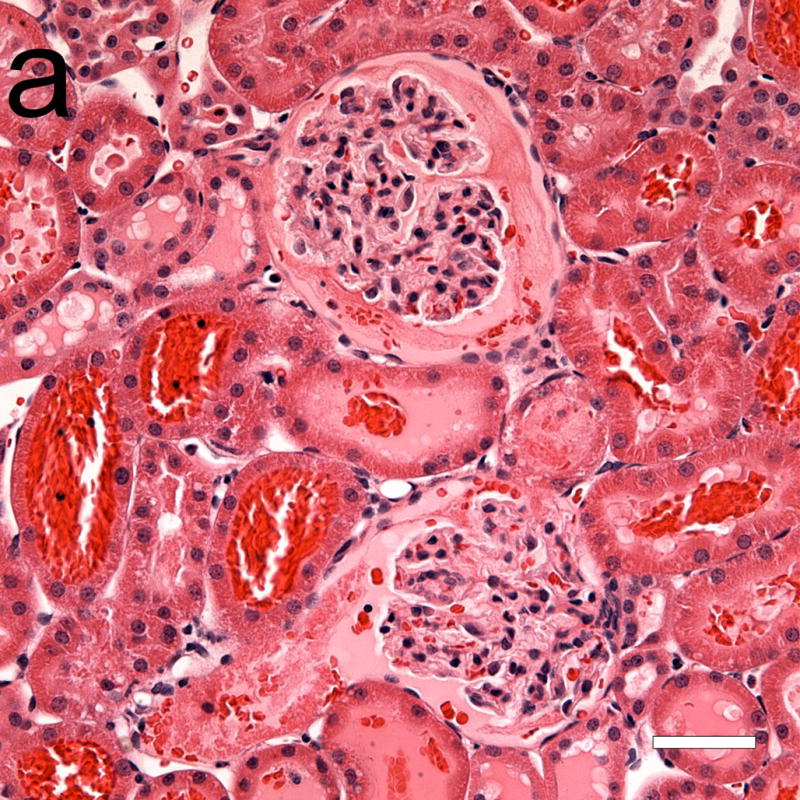
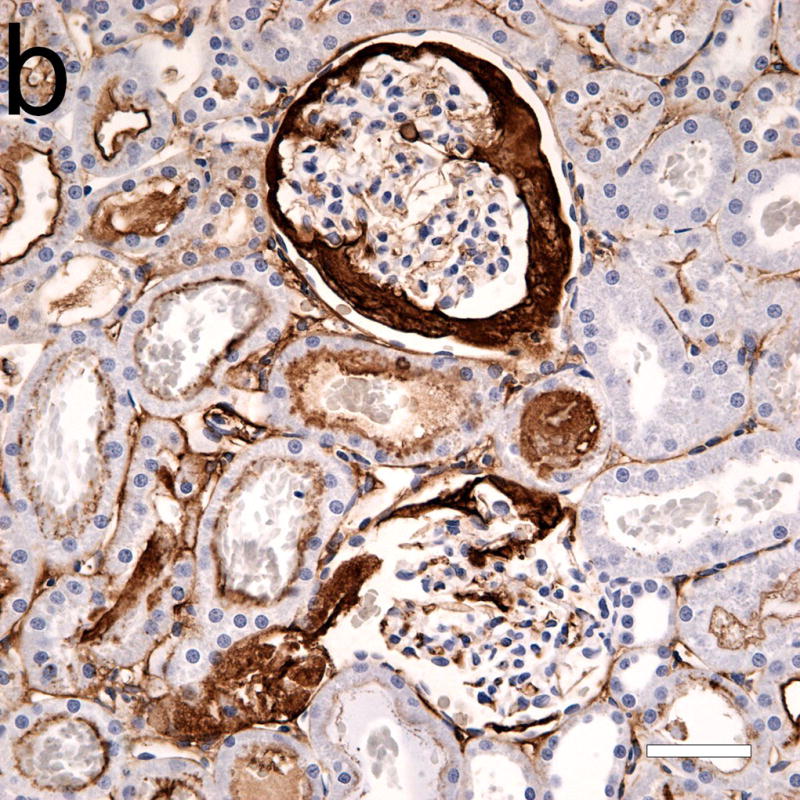
Photomicrographs of adjacent serial sections (a) from a 4 h sample stained with hematoxylin and eosin, and (b) with hematoxylin and labeled anti-fibrinogen antibody (dark frown stain). Some light staining of glomerular and peritubular capillaries was normal, and was also seen in shams. Although the two glomeruli in (a) seem mostly free of red cells from GCH, the anti-fibrinogen stain reveals large areas occupied by fibrin clots (b). Scale bars: 50 μm.
Figure 5.
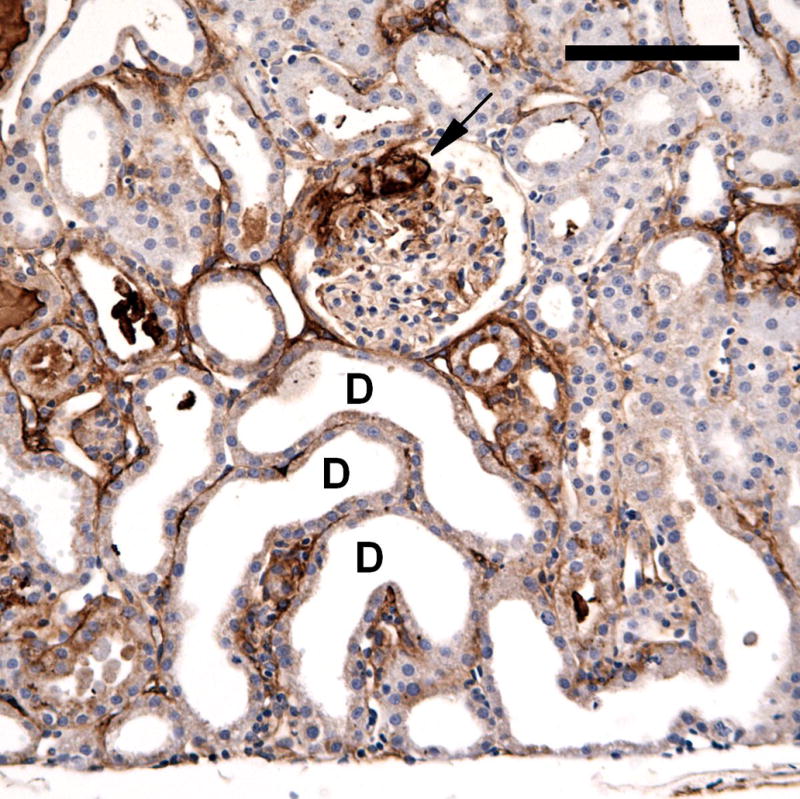
A photomicrograph of an anti-fibrinogen stained section from a 2 day post-exposure sample. A glomerulus retains some fibrin clot (arrow) and some nearby tubules have become dilatated (some examples marked D). The tubular dilatation represented tubular injury, with swelling and loss of the brush border of the epithelial cells. Scale bar: 100 μm.
The administration of heparin or aminocaproic acid modulated the impact of GCH on the nephron, which was assessed at the 4 h time point. The difference was grossly evident on the surface of the kidneys, as shown in Fig. 6. Results for the measured parameters are listed in Table 1. Compared to normal (no drug treatment), the results for hematuria and Bowman’s space were unchanged by the drug treatments. This indicates that the initial GCH effect of ultrasound interaction with contrast agent gas bodies was not changed by the drug treatment. The increase in the width of Bowman’s space was also unchanged. Tubular obstruction appeared to have the same tendency to enlarge the capsule regardless of the drug treatment. However, the apparent incidence of GCH was significantly smaller for the heparin treated samples (P<0.05) and significantly larger for the ACA treated samples (P<0.001) (Fig. 2). The influence of the drug treatment on the fibrin stain results was less substantial: the results for the heparin and ACA treated samples were significantly different (P<0.05) but neither reached a significant difference relative to the normal samples.
Figure 6.
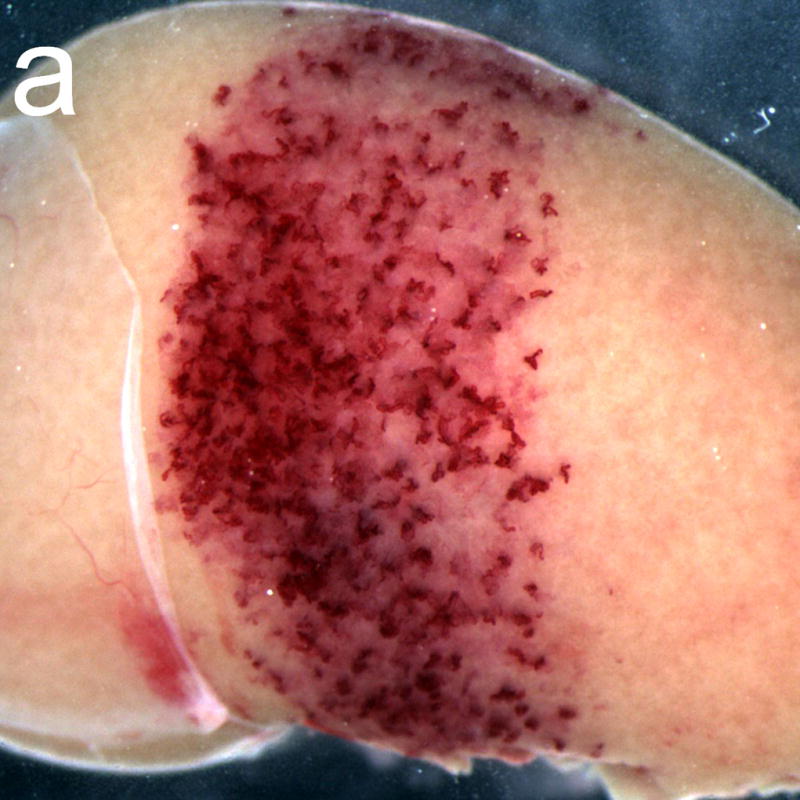
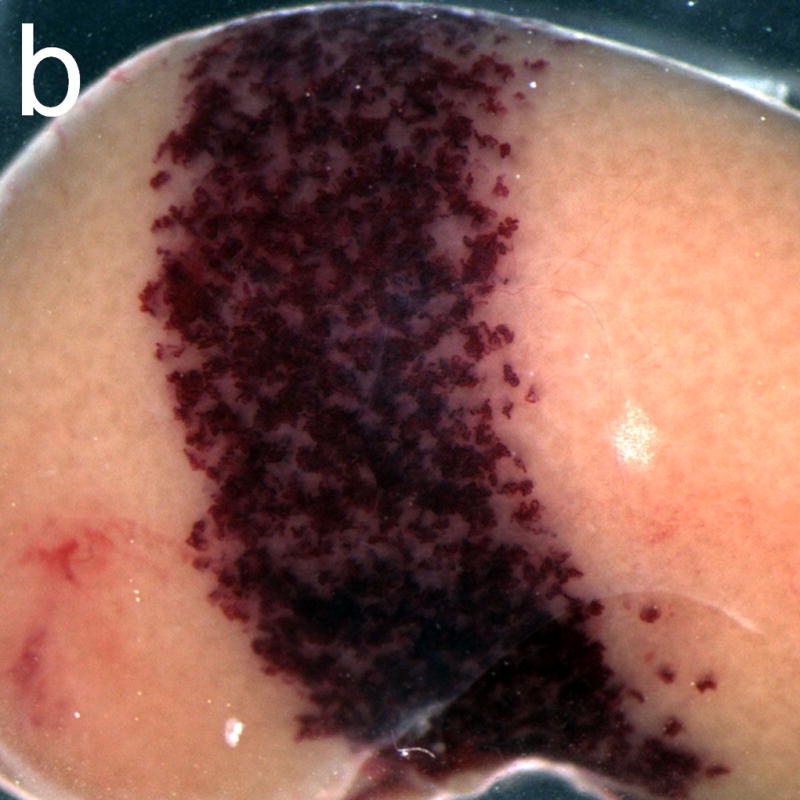
Gross photographs of rat kidneys exposed after treatment with the anticoagulant heparin (a) and with the pro-coagulant aminocaproic acid (b). The band of petechiae generated in the diagnostic ultrasound scan plane (about 4.5 mm wide) was much more intense for the aminocaproic acid treatment.
The results up to two days post exposure indicate a gradual resolution of the initial GCH. No red cells remained in Bowman’s space after two days, and the antibody staining of fibrin clots was greatly reduced. However, the tubular obstruction could have a persistent impact on the tubular components of the nephron even if the obstruction was gradually resolved. Some samples were collected 1 week and 4 weeks after exposure (no drug treatment). Unfortunately, the exact location of the scan plane could not be ascertained for these samples, because the markings on the kidney surface had faded. The histology was performed on the cross sectional sample from the middle of the kidneys, which was known to be at least partly exposed from the ultrasound image during exposure. Several changes were seen in these samples which were not seen in shams. In 1 week samples, the occurrence of dilatated tubules was pronounced. In addition, areas of inflammatory cell infiltration were evident, as shown in Fig. 7. After 4 weeks, samples stained with Masson’s trichrome stain showed areas of interstitial fibrosis in the cortex, as shown in Fig. 8a. Some tubules in the medulla appeared to have retained material from the initial GCH, as shown in Fig. 8b. These observations suggest the some level of injury persists, for this type of insult, in the form of fibrosis and scarring of localized areas.
Figure 7.
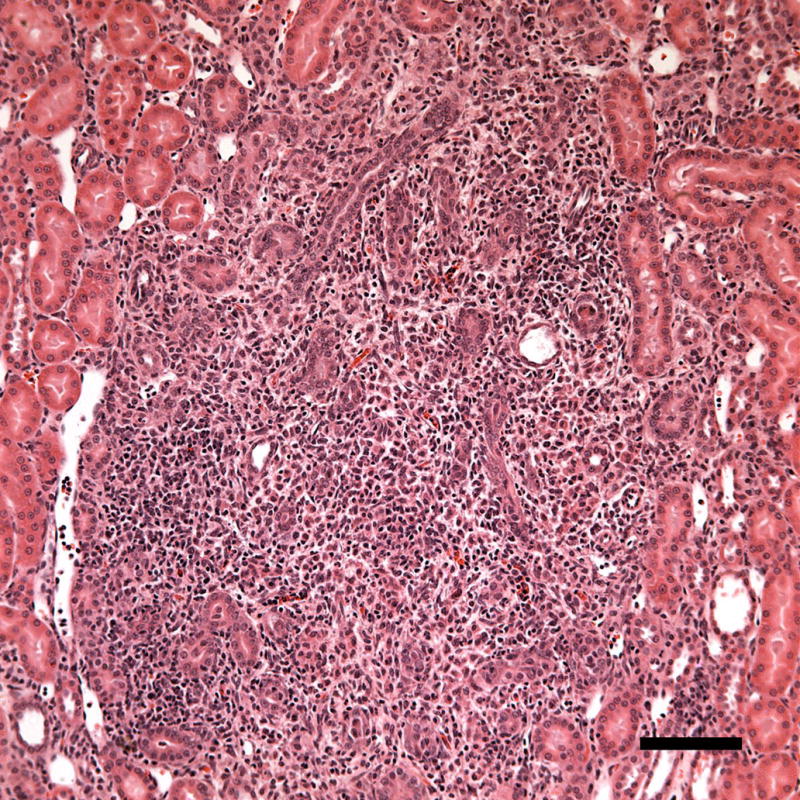
A photomicrograph of a histological sample taken 1 week post-exposure showing a region with inflammatory cell infiltration (probably neutrophils). The inflammatory response may represent removal of necrotic debris during healing. Scale Bar: 100 μm.
Figure 8.
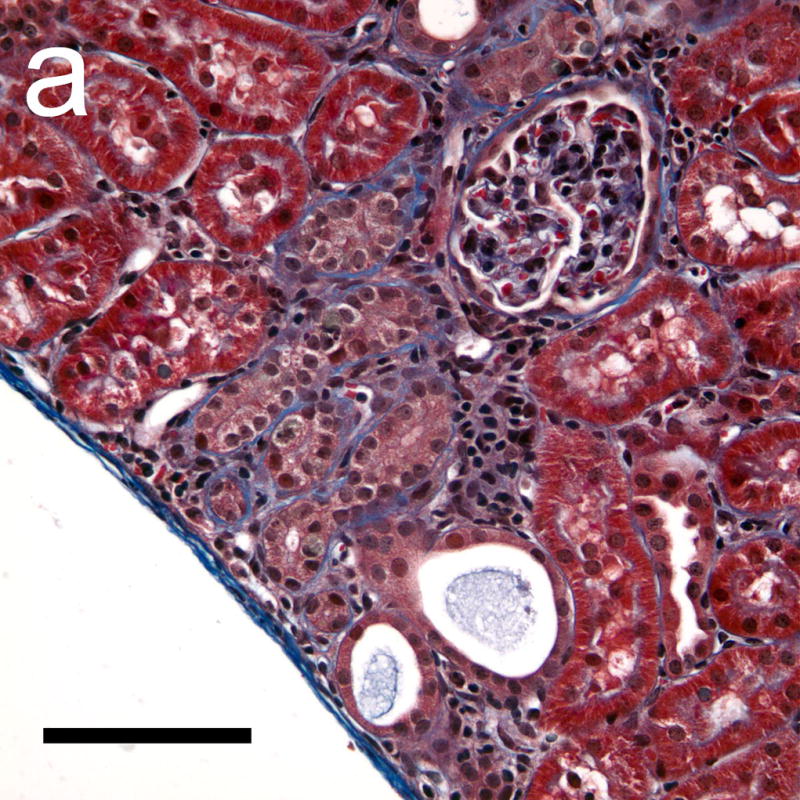
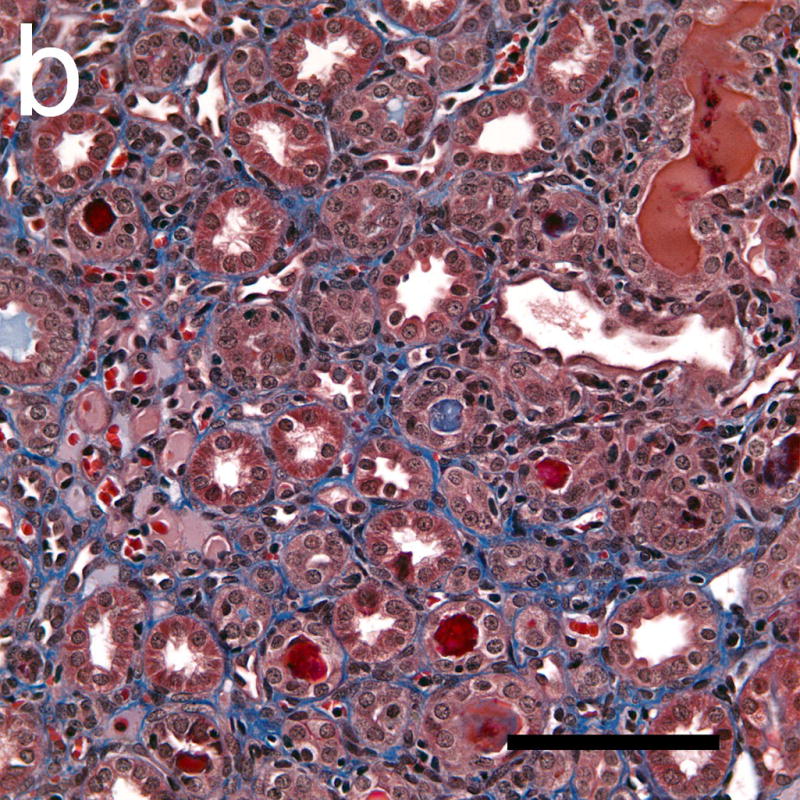
Photomicrographs of histological sections taken 4 weeks after exposure which were stained with Masson’s trichrome stain to show collagen (blue). The collagen formation around some tubules in the cortex (a) indicated a progression of interstitial fibrosis in response to the tubular injury following GCH. Some tubules in the medulla (b) also appeared to have retained material from the initial GCH, with the lumen of the tubules appearing red or pink (rather than clear white). Scale Bar: 100 μm.
DISCUSSION
In previous research, the induction of glomerular capillary hemorrhage (GCH) was noted to occur from exposure to simulated clinical diagnostic ultrasound with contrast agent (Miller et al. 2007). Hematuria together with indications of fibrin in the urinary space and localized acute tubular necrosis were seen histologically (Williams et al. 2007). This effect is believed to occur by the mechanism of ultrasonic cavitation (Miller et al. 2008a), which can be modeled by physical theory in general terms (Qin and Ferrara 2006). Essentially, when diagnostic ultrasound pulses interact with a contrast agent gas body in a glomerular capillary, the gas body can expand in response to high rarefactional pressure amplitudes and rupture the capillary. The purpose of this study was to define the consequences of GCH, which might be associated with the hemorrhage and fibrin formation. Relatively high intermittent imaging-exposure was used to provide ample GCH for study, including a 2.3 MPa in situ PRPA at 1.5 MHz and infusion of a 50 μl/kg contrast agent dose in 8 min of intermittent imaging. The in situ PRPA corresponds to an MI of 1.9 (at the upper limit of diagnostic ultrasound). The MI is a valuable on-screen indicator of exposure, but it should be noted that the frequency dependence implied by the MI does not agree with the observed frequency dependence of the GCH bioeffect (Miller et al. 2008b).
The GCH was scored in histology, and a distinct difference was noted between glomeruli with only a few cells and those with many cells in Bowman’s space (Fig. 1). Observation of the tuft and capsule radii revealed that the capsule enlarged, presumably as the hemorrhage equalized the pressure across the capillary and urinary space (Fig. 3). After 4 hr, the percentage of glomeruli which were full of cells appeared to decrease (Fig. 2). However, immunohistochemistry staining of fibrinogen/fibrin showed that some glomeruli, which appeared to have few red cells, were in fact mostly full of fibrin clot (Fig. 4). All these observations are consistent with intra-tubular obstruction of some nephrons. The Bowman’s spaces in glomeruli increased from about 7 μm in shams to 14 μm in glomeruli with GCH in exposed samples after 4 h (Table 1).
Pretreatment with common drugs, which are used clinically to modulate the coagulation process, also modulated the obstruction of nephrons. Heparin (anticoagulant) reduced the percentage of glomeruli with GCH and clots with fibrin staining, while treatment with aminocaproic acid increased the percentage of GCH and clots (Table 1). However, these drugs did not modulate the amount of hematuria detected, nor the magnitude of the increase in the width of Bowman’s space in glomeruli with GCH. That is, the drugs did not effect the initial capillary hemorrhage, which was a physical event caused by activation of a contrast agent gas body, but did modulate the subsequent hemostasis and clot formation.
These observations show that the GCH induced by ultrasonic cavitation is a unique acute event with significant impact on a nephron. Histological observations were also made on samples carried out 2 days, 1 week and 4 weeks. The two day samples still had many glomeruli with evident clots, although the width of Bowman’s space was not increased substantially (Table 1). However, there was early evidence of tubular injury owing to the impact of the hemorrhage and obstruction. This included acute tubular necrosis, infiltration of inflammatory cells (probably neutrophils) and dilatation of tubules in which the epithelium was injured with loss of the brush border (Fig. 5). The dilatation phenomenon is thought to be a consequence of injury to the tubular epithelium, rather than a direct result of the obstruction responsible for the widening of Bowman’s space (Shimizu et al. 1994). After 1 week these effects were still present, with the inflammatory reaction involving injured tubules and tubular interstitium (Fig. 7). After 4 weeks, the tubular dilatation was no longer evident, but inflammation with collagen formation, indicative of interstitial fibrosis and scarring, was demonstrated with trichrome staining (Fig. 8). These changes over time are not unlike changes seen in research on ischemia-reperfusion injury or on ureteral obstruction, and were somewhat surprising to find in young rats without global insult to the kidney. The progression of the injury to the development of interstitial fibrosis and scarring occurs in some affected nephrons, even though the cavitation-induced capillary injury is isolated within otherwise young healthy kidney.
Acknowledgments
We thank Dr. Alun R. Williams for many discussions of this project and Dr. Kent Johnson for help with interpreting the histological findings. This work was supported by PHS grant EB00338 awarded by the National Institutes of Health, DHHS.
Footnotes
Publisher's Disclaimer: This is a PDF file of an unedited manuscript that has been accepted for publication. As a service to our customers we are providing this early version of the manuscript. The manuscript will undergo copyediting, typesetting, and review of the resulting proof before it is published in its final citable form. Please note that during the production process errors may be discovered which could affect the content, and all legal disclaimers that apply to the journal pertain.
References
- Averkiou M, Powers J, Skyba D, Bruce M, Jensen S. Ultrasound contrast imaging research. Ultrasound Q. 2003;19:27–37. doi: 10.1097/00013644-200303000-00004. [DOI] [PubMed] [Google Scholar]
- Ay T, Havauz X, Van Camp G, Campanelli B, Gisellu G, Pasquet A, Denef JF, Melin JA, Vanoverschelde JL. Destruction of contrast microbubbles by ultrasound effects on myocardial function, coronary perfusion pressure and microvascular integrity. Circulation. 2001;104:461–466. doi: 10.1161/hc3001.092038. [DOI] [PubMed] [Google Scholar]
- Bergstein JM. Glomerular fibrin deposition and removal. Pediatr Nephrol. 1990;4:78–87. doi: 10.1007/BF00858447. [DOI] [PubMed] [Google Scholar]
- Chevalier RL. Pathogenesis of renal injury in obstructive uropathy. Curr Opin Pediatr. 2006;18:153–160. doi: 10.1097/01.mop.0000193287.56528.a4. [DOI] [PubMed] [Google Scholar]
- Choudhury D, Ahmed Z. Drug-associated renal dysfunction and injury. Nat Clin Pract Nephrol. 2006;2:80–91. doi: 10.1038/ncpneph0076. [DOI] [PubMed] [Google Scholar]
- Correas JM, Claudon M, Tranquart F, Hélénon AO. The kidney: imaging with microbubble contrast agents. Ultrasound Q. 2006;22:53–66. [PubMed] [Google Scholar]
- Daykin HJ, Sturgeon SA, Jones C, Wright CE. Arterial antithrombotic effects of aspirin, heparin, enoxaparin and clopidogrel alone, or in combination, in the rat. Thromb Res. 2006;118:755–762. doi: 10.1016/j.thromres.2005.11.015. [DOI] [PubMed] [Google Scholar]
- Deray G, Dubois M, Martinez F, Baumelou B, Beaufils H, Bourbouze R, Baumelou A, Jacobs C. Renal effects of radiocontrast agents in rats: a new model of acute renal failure. Am J Nephrol. 1990;10:507–513. doi: 10.1159/000168177. [DOI] [PubMed] [Google Scholar]
- Druid H, Eneström S, Rammer L. Effect of anticoagulation upon nephron obstruction in experimental acute ischaemic renal failure. A morphological study. Int J Exp Pathol. 1998;79:55–66. doi: 10.1046/j.1365-2613.1998.00055.x. [DOI] [PMC free article] [PubMed] [Google Scholar]
- Eddy AA. Experimental insights into the tubulointerstitial disease accompanying primary glomerular lesions. J Am Soc Nephrol. 1994;5:1273–1287. doi: 10.1681/ASN.V561273. [DOI] [PubMed] [Google Scholar]
- Ersoy H, Rybicki FJ. Biochemical safety profiles of gadolinium-based extracellular contrast agents and nephrogenic systemic fibrosis. J Magn Reson Imaging. 2007;26:1190–1197. doi: 10.1002/jmri.21135. [DOI] [PMC free article] [PubMed] [Google Scholar]
- Hertig A, Rondeau E. Role of the coagulation/fibrinolysis system in fibrin-associated glomerular injury. J Am Soc Nephrol. 2004;15:844–853. doi: 10.1097/01.asn.0000115400.52705.83. [DOI] [PubMed] [Google Scholar]
- Hruby Z, Wendycz D, Kope W, Czerchawski L, Jozefowiak M, Rabczy ski J. Effect of antiproteolytic drugs: epsilon-aminocaproic acid (EACA) and aprotinin on experimental anti-GBM nephritis. Nephrol Dial Transplant. 1996;11:32–39. [PubMed] [Google Scholar]
- Li P, Armstrong WR, Miller DL. Impact of myocardial contrast echocardiography on vascular permeability: Comparison of three different contrast agents. Ultrasound Med Biol. 2004;30:83–91. doi: 10.1016/j.ultrasmedbio.2003.09.004. [DOI] [PubMed] [Google Scholar]
- Miller DL, Gies RA. Gas-body-based contrast agent enhances vascular bioeffects of 1.09 MHz ultrasound on mouse intestine. Ultrasound Med & Biol. 1998;24:1201–1208. doi: 10.1016/s0301-5629(98)00063-5. [DOI] [PubMed] [Google Scholar]
- Miller DL, Quddus J. Diagnostic ultrasound activation of contrast agent gas bodies induces capillary rupture in mice. Proc Nat Acad Sci. 2000;97:10179–10184. doi: 10.1073/pnas.180294397. [DOI] [PMC free article] [PubMed] [Google Scholar]
- Miller DL, Li P, Dou C, Gordon D, Edwards CA, Armstrong WF. Influence of contrast dose and ultrasound exposure on cardiomyocyte injury induced by myocardial contrast echocardiography in rats. Radiology. 2005;237:137–143. doi: 10.1148/radiol.2371041467. [DOI] [PubMed] [Google Scholar]
- Miller DL, Dou C, Wiggins RC, Wharram BL, Goyal M, Williams AR. An in vivo rat model simulating imaging of human kidney by diagnostic ultrasound with gas-body contrast agent. Ultrasound Med Biol. 2007;33:129–135. doi: 10.1016/j.ultrasmedbio.2006.07.033. [DOI] [PubMed] [Google Scholar]
- Miller DL, Averkiou MA, Brayman AA, Everbach EC, Holland CK, Wible JH, Jr, Wu J. Bioeffects considerations for diagnostic ultrasound contrast agents. J Ultrasound Med. 2008a;27:611–632. doi: 10.7863/jum.2008.27.4.611. [DOI] [PubMed] [Google Scholar]
- Miller DL, Dou C, Wiggins RC. Frequency dependence of kidney injury induced by contrast-aided diagnostic ultrasound in rats. Ultrasound Med Biol. 2008b;34:1678–1687. doi: 10.1016/j.ultrasmedbio.2008.03.001. [DOI] [PMC free article] [PubMed] [Google Scholar]
- Qin S, Ferrara KW. Acoustic response of compliable microvessels containing ultrasound contrast agents. Phys Med Biol. 2006;51:5065–5088. doi: 10.1088/0031-9155/51/20/001. [DOI] [PMC free article] [PubMed] [Google Scholar]
- Shanley PF. The pathology of chronic renal ischemia. Semin Nephrol. 1996;16:21–32. [PubMed] [Google Scholar]
- Shimizu A, Masuda Y, Ishizaki M, Sugisaki Y, Yamanaka N. Tubular dilatation in the repair process of ischaemic tubular necrosis. Virchows Arch. 1994;425:281–290. doi: 10.1007/BF00196151. [DOI] [PubMed] [Google Scholar]
- Skyba DM, Price RJ, Linka AZ, Skalak TC, Kaul S. Direct in vivo visualization of intravascular destruction of microbubbles by ultrasound and its local effects on tissue. Circulation. 1998;98:290–293. doi: 10.1161/01.cir.98.4.290. [DOI] [PubMed] [Google Scholar]
- Strutz F, Muller GA. Interstitial pathomechanisms underlying progressive tubulointerstitial damage. Kidney Blood Press Res. 1999;22:71–80. doi: 10.1159/000025911. [DOI] [PubMed] [Google Scholar]
- Tumlin J, Stacul F, Adam A, Becker CR, Davidson C, Lameire N, McCullough PA. CIN Consensus Working Panel. Pathophysiology of contrast-induced nephropathy. Am J Cardiol. 2006;98:14K–20K. doi: 10.1016/j.amjcard.2006.01.020. [DOI] [PubMed] [Google Scholar]
- van Der Wouw PA, Brauns AC, Bailey SE, Powers JE, Wilde AA. Premature ventricular contractions during triggered imaging with ultrasound contrast. J Am Soc Echocardiogr. 2000;13:288–294. doi: 10.1067/mje.2000.103865. [DOI] [PubMed] [Google Scholar]
- Vancraeynest D, Kefer J, Hanet C, Fillee C, Beauloye C, Pasquet A, Gerber BL, Philippe M, Vanoverschelde JL. Release of cardiac bio-markers during high mechanical index contrast-enhanced echocardiography in humans. Eur Heart J. 2007;28:1236–1241. doi: 10.1093/eurheartj/ehm051. [DOI] [PubMed] [Google Scholar]
- Wible JH, Jr, Galen KP, Wojdyla JK, Hughes MS, Klibanov AL, Brandenburger GH. Microbubbles induce renal hemorrhage when exposed to diagnostic ultrasound in anesthetized rats. Ultrasound Med Biol. 2002;28:1535–1546. doi: 10.1016/s0301-5629(02)00651-8. [DOI] [PubMed] [Google Scholar]
- Williams AR, Wiggins RC, Wharram BL, Goyal M, Dou C, Johnson KJ, Miller DL. Nephron injury induced by diagnostic ultrasound imaging at high mechanical index with gas body contrast agent. Ultrasound Med Biol. 2007;33:1336–1344. doi: 10.1016/j.ultrasmedbio.2007.03.002. [DOI] [PMC free article] [PubMed] [Google Scholar]


