

Abstract
This paper presents a method for measuring the optical absorption cross-sections (σa) of Au-Ag nanocages and Au nanorods. The method is based on photoacoustic (PA) imaging, where the detected signal is directly proportional to the absorption coefficient (μa) of the nanostructure. For each type of nanostructure, we firstly obtained μa from the PA signal by benchmarking against a linear calibration curve (PA signal vs. μa) derived from a set of methylene blue solutions with different concentrations. We then calculated σa by dividing the μa by the corresponding concentration of the Au nanostructure. Additonally, we obtained the extinction cross-section (σe, sum of absorption and scattering) from the extinction spectrum recorded using a conventional UV-vis-NIR spectrometer. From the measurements of σa and σe, we were able to easily derive both the absorption and scattering cross-sections for each type of gold nanostructure. The ratios of absorption to extinction obtained from experimental and theoretical approaches agreed well, demonstrating the potential use of this method in determining the optical absorption and scattering properties of gold nanostructures and other types of nanomaterials.
Introduction
Due to their unique optical properties, Au-based nanostructures have received considerable attention in biomedical applications as both diagnostic contrast agents and therapeutic agents.1,2 Gold-based nanostructures can interact with incident light and give rise to a strong extinction peak in the visible and near-infrared (NIR) regions.3 This extinction peak is known as the localized surface plasmon resonance (LSPR), which consists of two components: scattering and absorption. By manipulating the size, shape, and internal structure (solid vs. hollow) of the nanostructures, one can tune not only the position and intensity of the peak but also the relative magnitude of light being absorbed or scattered.4-7 The magnitude of light being absorbed or scattered is determined by the absorption and scattering cross-sections (σa and σs, respectively) of the nanostructures. In general, different applications may require nanostructures having specific optical properties. For example, while Au-based nanostructures with relatively large σs are ideal for enhancing the contrast of optical coherence tomography (OCT),8 photoacoustic (PA) imaging requires contrast agents with relatively large σa.9 Similarly, the nanostructures must have a large σa in order to effectively convert the incident light into heat for photothermal therapy.10 Therefore, it is essential to know both the σa and σs of a nanostructure for a specific biomedical application.
A conventional UV-vis-NIR spectrometer can be used to easily record the extinction spectra of nanostructures. Using the Beer-Lambert law,11 one can obtain the molar extinction coefficient, and thus the extinction cross-section (σe, with σe = σa + σs) of the nanostructures. In general, one has to rely on theoretical calculation in order to separate σe into σa and σs. In this regard, the Mie theory12 works perfectly for spherical particles, while the discrete-dipole approximation (DDA) is well-suited for nanostructures with other geometric shapes.13-16 Experimentally, a number of groups have tried to measure the σa of aquatic particles with integrating spheres in a dual-beam configuration.17 Others have attempted to use OCT to quantify the backscattered light of gold nanostructures and then derive the σa using a numerical model.18 In an early study, Rossler and Faxvog tried to obtain the ratio of optical absorption to extinction for aerosols by simultaneously monitoring photoacoustic signals and light attenuation in a small chamber containing cigarette smoke.19 They also compared their experimental data with the results obtained from theoretical calculations. For gold and other metal nanostructures, they are typically dispersed in water so that one must design a different system for measuring the optical absorption.
In this study, we experimentally measured the σa of Au-Ag nanocages and Au nanorods using a PA imaging system, a hybrid imaging modality that can provide strong optical absorption contrast and high ultrasonic resolution. This technique can provide three-dimensional images of optical absorption heterogeneities in biological tissue in vivo.9, 20 It is known that the PA signal is generated due to the optical absorption of a material, and the signal is expected to be directly proportional to the absorption coefficient (μa) of the material within a certain concentration range.21,22 Based on this principle, we could convert the PA signal from a sample of the nanostructures into the μa by benchmarking against a linear calibration curve based on an organic dye (e.g., methylene blue) that describes the relationship between the PA signal and the μa. Then we could acquire σa by dividing μa by the concentration of the nanostructure. When combined with the conventional UV-vis-NIR spectroscopic method, we could experimentally determine the σe, σa, and σs of the Au-based nanostructure.
Experimental Methods
Preparation of Au nanostructures
Four types of nanostructures were evaluated in this study: Au-Ag nanocages with two different sizes, Au nanorods, and Au nanospheres. Figure 1 shows their extinction coefficients (μe) and TEM images (insets). Their corresponding chemical compositions and geometric parameters are provided in the supporting information (Table S1). The two types of Au-Ag nanocages (45 nm and 32 nm in outer edge length, respectively) were prepared by titrating the corresponding Ag nanocubes with 1 mM HAuCl4.7b Once the LSPR peak had reached 650 nm, addition of HAuCl4 was immediately stopped. The Au nanorods (44.0×19.8 nm2 in length × width) were synthesized using the method developed by El-Sayed and co-workers.23 The longitudinal LSPR peak of the Au nanorods was tuned to 650 nm. The Au nanospheres (~150 nm in diameter) were purchased as an aqueous suspension from Ted Pella. They exhibited a very broad LSPR peak around 650 nm due to the involvement of multipole excitations. An organic dye, methylene blue (MB), was used as a reference for calibration because its molar absorption coefficient is well documented.24
Figure 1.

Extinction coefficients (μe) of nanostructures: (A) Au-Ag nanocages of 45.0 nm in outer edge length and 5.8 nm in wall thickness, at a concentration of 0.13 nM; (B) Au-Ag nanocages of 32.0 nm in outer edge length and 4.0 nm in wall thickness, at a concentration of 0.33 nM; (C) Au nanorods of 44 nm ×19.8 nm2 in length × width, at a concentration of 0.56 nM; and (D) Au nanospheres of 150 nm in diameter at a concentration of 1.42 pM. The insets show corresponding TEM images.
PA imaging system
Figure 2A shows a setup of the PA imaging system used for the optical measurements. The principle of this dark-field illumination PA imaging system can be found elsewhere.10b, 22a A wavelength-tunable dye laser (ND6000, Continuum), pumped by a Q-switched Nd:YAG laser (LS-2137, LOTIS), produced laser pulses with <15 ns pulse width at a rate of 10-Hz. 5% of the energy of each pulse was split from the laser beam, measured by a photodiode and used to compensate for the fluctuation of pulse energy. A ring-shaped illumination (λ = 638 nm) was formed by a concave and conical lenses. The light traveling down through an optical condenser and the ultrasound focal zone were focused on the Au nanostructures. We used an optically scattering medium to prevent direct illumination of the sample by light, protecting the Au nanostructures and MB molecules from deformation and photobleaching, respectively. Three Tygon® tubes were embedded in the optically scattering medium, and the tubes were then filled with aqueous suspensions of the Au nanostructures or aqueous solutions of MB. When the solution was illuminated by the laser, PA waves were generated through thermo-elastic expansion due to optical absorption. The PA waves were detected by a single-element 5-MHz ultrasound transducer (V308, Panametrics-NDT) placed inside the optical condenser. The PA signals were collected, amplified, and then transferred to an oscilloscope. The spatial resolutions of this PA imaging system were 138 μm in the axial direction and 490 μm in the transverse direction. We obtained depth-resolved (z-direction) one-dimensional images (A-lines) by measuring the arrival times of the PA signals. By scanning along the x direction, we can obtain two-dimensional PA image (B-scan). Figure 2B shows a typical depth-resolved B-scan PA image of the Au-Ag nanocages shown in Figure 1A with concentrations at 0.13, 0.07, and 0.03 nM. The PA signal decreased in amplitude as the concentration of nanocages was reduced. For each data point, we obtained 20 B-scan images from the same solution by scanning samples along the y direction and the PA signals were averaged from the images.
Figure 2.

(A) An experimental setup of the photoacoustic (PA) imaging system. (B) A typical depth-resolved B-scan PA image (x-z scan) of the Au-Ag nanocage suspension (45.0 nm in outer edge length, Figure 1A) at three different concentrations.
Results and Discussion
The PA signal measured from a material is related to μa (cm-1) according to the following equation:22
| (1) |
where P0 is the initial photoacoustic pressure due to laser excitation, Γ is the Grueneisen parameter, and F is the optical fluence. Γ and F are determined by the properties of the medium and the incident light. Since we used the same scattering medium and a single wavelength, Γ and F were essentially the same for all experiments. Therefore, the PA signal was directly proportional to μa of the light absorbing species.
For simplicity in data analysis, it is important to determine the concentration range in which there is a linear relationship between the PA signal and the concentration of the dye molecules or nanostructures. As a control experiment, we measured the PA signal by filling the tube with deionized water and a value of 0.55 a.u. was detected. We then measured the PA signals of the reference dye, MB, and we found that the PA signals linearly increased to 1.1 a.u. (62.5 μM) as the concentration of MB was increased (Fig. S1), and then the signals became saturated. In Figure 3, we plot the PA signal as a function of the nanostructure concentration for the two types of Au-Ag nanocages and Au nanorods. In all cases, the PA signal increased linearly as the concentration of nanostructures was increased. We could not detect any PA signal from the suspension of Au nanospheres up to a concentration of 50 pM, at which point the aqueous suspension started to show an opaque appearance (probably due to particle agglomeration).
Figure 3.

Plots of PA signal amplitude versus concentration for three types of nanostructures. No PA signal was detected from the suspension of Au nanospheres under the experimental conditions.
We next tried to acquire the absorption coefficients of the nanostructures (μa,nano). To directly calculate μa,nano from equation (1), we need to know Γ and F, two parameters that are difficult to measure experimentally. We came up with a suitable way to acquire μa,nano by using a calibration curve derived from the linear relationship between the PA signal and μa for MB solutions at various concentrations. In this case, we firstly measured the PA signals from aqueous solutions of MB at various concentrations (see Fig. S1), and then plotted the μa against the PA signal to derive the linear correlation (Figure 4). We calculated μa from the molar absorption coefficient at 638 nm.24 The linear dependence in Figure 4 can be described using the following empirical equation:
Figure 4.

The linear relationship between optical absorption coefficient (μa) and PA signal amplitude derived from the plot in Figure S1 and the known σa of methylene blue (R2=0.99).
| (2) |
After obtaining μa,nano for the nanostructures from equation (2) at the concentrations shown in Figure 3, we calculated their absorption cross-sections using the following equation:22
| (3) |
where σa,nano is the absorption cross-section (m2), and Nnano is the concentration of nanostructure (number of particles per m3).
We also obtained the extinction coefficients of the four types of nanostructures from their UV-vis-NIR spectra and the Beer-Lambert law (see Fig. S2). Table 1 summarizes the extinction (σe,nano) and absorption (σa,nano) cross-sections of the nanostructures. To validate our experimental approach, we compared our experimental data with calculation results. Figure 5 shows the spectra calculated for individual particles of the four types of nanostructures. The LSPR peaks of all these nanostructures were located at 650 nm. In calculation, the elemental compositions of Au-Ag nanocages and all the geometrical data (see the insets of Fig. 5) were determined experimentally by EDX and TEM analysis. For the Au nanosphere, calculation was performed by Mie theory,12 while calculation for the Au-Ag nanocages and the Au nanorods were carried out using the DDA method.13-16 For the Au-Ag nanocages, the electric field was set along [100], and the calculation used a dielectric function modified by considering electron surface scattering.14 As shown in the insets, we assumed that the nanocages had a cubic shape. For the Au nanorod, the electric field (e-field) was set with a direction of 65 degrees from the long axis. The rod was assumed to take a square cross-section with the corners slightly rounded with a radius of 6.1 nm.
Table 1.
Comparison of the optical cross-sections of Au-based nanostructures obtained experimentally by photoacoustic imaging and theoretical calculation, respectively.a
| Cross-section (10-15 m2) |
||||
|---|---|---|---|---|
| Extinction (σe) | Absorption (σa) | σa / σe | ||
| Nanocages (45.0 nm) | Experimental | 7.26 ± 0.06 | 5.96 ± 0.25 | 0.82 ± 0.04 |
| Calculated | 19.88 | 16.26 | 0.82 | |
| Nanocages (32.0 nm) | Experimental | 2.99 ± 0.04 | 3.05 ± 0.12 | 1 ± 0.04 |
| Calculated | 6.39 | 6.02 | 0.94 | |
| Nanorods (44.0 × 19.8 nm2) | Experimental | 2.16 ± 0.02 | 1.87 ± 0.23 | 0.87 ± 0.11 |
| Calculated | 2.15 | 1.83 | 0.85 | |
| Nanospheres (150 nm) | Experimental | 145 ± 14.76 | -b | - |
| Calculated | 99.96 | 5.73 | 0.056 | |
All the values were obtained at 638 nm.
Not detected with photoacoustic imaging.
Figure 5.
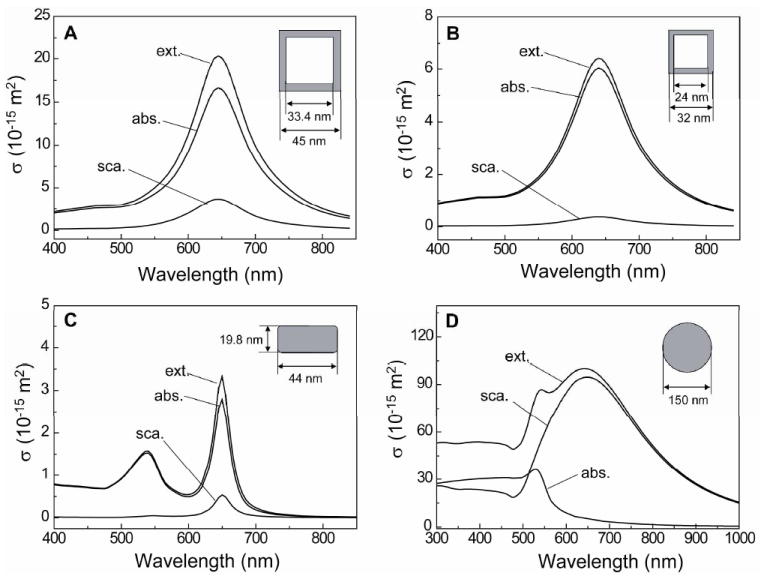
Spectra calculated for (A) Au-Ag nanocages with an outer edge length of 45.0 nm and wall thickness of 5.8 nm; (B) Au-Ag nanocages with an outer edge length of 32.0 nm and wall thickness of 4.0 nm; (C) Au nanorods of 44.0 nm and 19.8 nm in length and width, respectively; and (D) Au nanospheres of 150 nm in diameter. For the Au-Ag nanocages and Au nanorods, the discrete dipole approximation (DDA) method was used and the Mie theory was used for the Au nanospheres. The inset shows the corresponding geometric parameters for each type of gold-based nanostructure. Abbreviation: ext.= extinction; abs.= absorption; sca.= scattering.
From Table 1, it is apparent that the ratios of absorption to extinction cross-sections (σa/σe) obtained from experimental and theoretical approaches agreed well. Each type of nanostructure has its own characteristic σa/σe ratio, which is essentially the same as that predicted by calculation. This agreement demonstrates the practical value of our experimental approach, which can be used to quickly measure the absorption and scattering cross-sections of Au-based nanostructures. There are some discrepancies in absolute units between the experimentally measured and calculated values of σa and σe for both Au-Ag nanocages. These discrepancies might have been caused by factors such as variations in size, shape, and wall thickness in the actual sample, as well as pores that were often found in the surface of small Au-Ag nanocages (see the inset in Fig. 1B). These parameters can affect the concentrations of Au nanostructures determined by inductively-coupled mass spectroscopy (ICP-MS). Despite these discrepancies, the experimental data can still be employed to validate the effect of size and geometric shape of nanostructures on their optical properties.
When comparing the optical properties of the two types of Au-Ag nanocages, we found that the smaller nanocages had a higher σa/σe ratio, while the absolute value of σa is larger for the larger nanocages. This finding agrees with the previous results in that small Au-Ag nanocages had smaller extinction cross-sections than the larger counterparts, and that optical absorption became more significant as the dimensions of Au-Ag nanocages were reduced.2b,25 As explained above, however, the absolute values of the calculated extinction and absorption cross-sections are 2.7 times and 2.1 times the experimental data for 45-nm and 32-nm Au-Ag nanocages, respectively. In the present work, we used 45-nm Au-Ag nanocages consisting of a Au-Ag alloy for the walls and some pure Ag in the interior (see the inset in Fig. 1A), while we only considered a Au-Ag alloy for the walls in our DDA calculations. Along with variations in size and wall thickness of the Au-Ag nanocages, this simplification might result in some differences for the absolute values. In addition, the 32-nm Au-Ag nanocages we used in our experiments were rather deviated from a cubic shape, and some cages had pores in the side faces. Our calculation results from the 32-nm nanocages indicate that corner truncation tends to reduce both σa and σe, while a similar σa/σe ratio is maintained (see Fig. S3). For the effect of pores, it was reported that the formation of pores could decrease the absolute values while the peak positions are maintained.25
For the Au nanorods, both the experimental data and calculation results were almost the same. The σa/σe ratio of the Au nanorods was found to be between those for the 45-nm and 32-nm Au-Ag nanocages. On the other hand, the absolute values of σa and σe for the Au nanorods were smaller than those for both the samples of Au-Ag nanocages. This might be due to the fact that the Au nanorods have two peaks in the spectra: a longitudinal mode at 650 nm and a transversal mode at 520 nm. In our calculations, we assumed that the Au nanorod was aligned in a diagonal manner with an angle of 65 degrees between the long axis and the e-field in order to generate the two peaks. If we consider only the longitudinal mode, or by aligning the Au nanorod perpendicular to the incident beam or the long axis is parallel to the e-field, σa and σe were increased to 9.9×10⁻¹⁵ and 11.6×10⁻¹⁵ m-2 (σa/σe = 0.85), respectively (Fig. S4). The round corners of the Au nanorods (see inset in Fig. 1C) could also cause reduction for the cross-sections. It is known that sharp corners tend to form a strong dipole, giving the metal nanorod a larger cross-section.15 A recent calculation studied the effect of the geometric shape of a Au nanorod on its optical cross-section, and σe was found to increase as the shape of the Au nanorod became more rectangular.16,26 As in the case of Au-Ag nanocages, the size of the Au nanorods influenced both the absolute values of the cross-sections and the σa/σe ratio. Lee and El-Sayed reported in their calculations that increasing the size of the Au nanorod with a fixed aspect ratio resulted in a decrease in σa while σe remained almost constant.16
We attribute the lack of PA signals from the Au nanospheres to the low absorption at 638 nm. In our calculation, σa was 5.7% of σe for the Au nanospheres at this wavelength so that a much higher concentration is required for the Au nanosphere suspension in order to detect the PA signals. Unfortunately, as we stated above, we found that the Au nanospheres became opaque at 50 pM probably due to particle aggregation. The extinction spectra taken from the suspensions of Au nanospheres supported this claim as the extinction coefficient at 638 nm was nonlinearly increased above a concentration of 5.7 pM and became saturated at 50 pM (see Fig. S5). A concentration of Au nanospheres higher than 50 pM is needed in order to detect PA signals at 638 nm, but we could not prepare such a sample for the aforementioned reason. Although we could not detect PA signals at this wavelength, we believe it is possible to detect PA signals from the Au nanospheres if we use a laser with a different wavelength (e.g., at 530 nm). At this wavelength, the Au nanospheres have a fairly high σa/σe ratio (0.44).
Conclusion
We have demonstrated a method based on photoacoustic imaging for measuring the absorption cross-sections of Au-based nanostructures. Using the calibration curve between PA signals and the absorption coefficients of MB solutions, we could convert the PA signal from an aqueous suspension of Au nanostructures into the absorption coefficient, and further derive the absorption cross-section. Combining this method with conventional UV-vis-NIR spectroscopy, we have determined both the absorption and scattering cross-sections of Au-Ag nanocages and Au nanorods. In this study, we found that the geometric parameters (including size and shape) of the Au nanostructures can have a strong influence on their cross-sections and σa/σe ratios; and the non-uniformity in geometric parameters can sometimes cause a deviation for the absolute values of cross-sections obtained experimentally by PA imaging from those obtained by calculation. We believe this approach is extendable to other types of metal nanostructures or Au-based nanostructures with LSPR peaks being tuned to other spectral regions. We recommend using MB as a reference dye to obtain the calibration curve if the LSPR peaks of the nanostructures are located in the range of 600-680 nm. For other spectral regions, we need to use other dyes with appropriate absorption peak positions to construct the calibration curves. For example, we have recently found that indocyanine green (ICG) is useful as a reference dye when the LSPR peaks of Au-Ag nanocages or Au nanorods are tuned to 800 nm. This method can help us better understand the optical properties of various metal nanostructures and thus have them optimized for different applications.
Supplementary Material
Acknowledgments
This work was supported in part by grants from National Institutes of Health (R01 EB000712, R01 EB008085, R01 NS46214, and U54 CA136398 -- the Network for Translational Research -- to L.V.W.). L.V.W. has a financial interest in Endra, Inc., which, however, did not support this work. Y.X. thanks the National Institutes of Health for a 2006 Director’s Pioneer Award (DP1 OD000798-04). Z.Y.L. was supported by the National Natural Science Foundation of China (60736041 and 10874238). E.C.C. was also partially supported by a fellowship award from the Korea Research Foundation (KRF-2007-357-D00070) funded by the Korean Government.
References
- 1.Jain PK, Huang X, El-Sayed IH, El-Sayed MA. Acc Chem Res. 2008;41:1578. doi: 10.1021/ar7002804. [DOI] [PubMed] [Google Scholar]
- 2.(a) Skrabalak SE, Chen J, Sun Y, Lu X, Au L, Cobley CM, Xia Y. Acc Chem Res. 2008;41:1587. doi: 10.1021/ar800018v. [DOI] [PMC free article] [PubMed] [Google Scholar]; (b) Skrabalak SE, Chen J, Au L, Lu X, Li X, Xia Y. Adv Mater. 2007;19:3177. doi: 10.1002/adma.200701972. [DOI] [PMC free article] [PubMed] [Google Scholar]
- 3.Xia Y, Halas NJ. MRS Bull. 2005;30:338. [Google Scholar]
- 4.El-Sayed MA. Acc Chem Res. 2001;34:257. doi: 10.1021/ar960016n. [DOI] [PubMed] [Google Scholar]
- 5.(a) Mohamed MB, Volkov V, Link S, El-Sayed MA. Chem Phys Lett. 2000;317:517. [Google Scholar]; (b) Hu M, Chen J, Li Z-Y, Au L, Hartland GV, Li X, Marqueze M, Xia Y. Chem Soc Rev. 2006;35:1084. doi: 10.1039/b517615h. [DOI] [PubMed] [Google Scholar]
- 6.(a) Wiley B, Sun Y, Xia Y. Acc Chem Res. 2007;40:1067. doi: 10.1021/ar7000974. [DOI] [PubMed] [Google Scholar]; (b) Xiong Y, Wiley B, Chen J, Li Z-Y, Yin Y, Xia Y. Angew Chem Int Ed. 2005;44:7913. doi: 10.1002/anie.200502722. [DOI] [PubMed] [Google Scholar]
- 7.(a) Métraux GS, Cao YC, Jin R, Mirkin CA. Nano Lett. 2003;3:519. [Google Scholar]; (b) Skrabalak SE, Au L, Li X, Xia Y. Nature Prot. 2007;2:2182. doi: 10.1038/nprot.2007.326. [DOI] [PubMed] [Google Scholar]
- 8.(a) Chen J, Saeki F, Wiley BJ, Cang H, Cobb MJ, Li ZY, Au L, Zhang H, Kimmey MB, Li XD, Xia Y. Nano Lett. 2005;5:473. doi: 10.1021/nl047950t. [DOI] [PubMed] [Google Scholar]; (b) Zagaynova EV, Shirmanova MV, Kirillin MY, Khlebtsov BN, Orlova AG, Balalaeva IV, Sirotkina MA, Bugrova ML, Agrba PD, Kamensky VA. Phys Med Biol. 2008;53:4995. doi: 10.1088/0031-9155/53/18/010. [DOI] [PubMed] [Google Scholar]
- 9.(a) Yang X, Skrabalak SE, Li Z-Y, Xia Y, Wang LV. Nano Lett. 2007;7:3798. doi: 10.1021/nl072349r. [DOI] [PubMed] [Google Scholar]; (b) Song KH, Kim C, Cobley CM, Xia Y, Wang LV. Nano Lett. 2009;9:183. doi: 10.1021/nl802746w. [DOI] [PMC free article] [PubMed] [Google Scholar]; (c) Kim K, Huang S-W, Ashkenazi S, O’Donnell M, Agarwal A, Kotov NA, Denny MF, Kaplan MJ. Appl Phys Lett. 2007;90:223901. [Google Scholar]; (d) Agarwal A, Huang S-W, O’Donnell M, Day KC, Day M, Kotov M, Ashkenazi S. J Appl Phys. 2007;102:064701. [Google Scholar]
- 10.(a) Adler DC, Huang S-W, Huber R, Fujimoto JG. Opt Exp. 2008;16:4376. doi: 10.1364/oe.16.004376. [DOI] [PubMed] [Google Scholar]; (b) van Dijk MA, Tchebotareva AL, Orrit M, Lippitz M, Berciaud S, Lasne D, Cognetc L, Lounisc B. Phys Chem Chem Phys. 2006;8:3486. doi: 10.1039/b606090k. [DOI] [PubMed] [Google Scholar]; (c) Au L, Zheng D, Zhou F, Li Z-Y, Li X, Xia Y. ACS Nano. 2008;2:1645. doi: 10.1021/nn800370j. [DOI] [PMC free article] [PubMed] [Google Scholar]; (d) Chen J, Wang D, Xi J, Au L, Siekkinen A, Warsen A, Li Z-Y, Zhang H, Xia Y, Li X. Nano Lett. 2007;7:1318. doi: 10.1021/nl070345g. [DOI] [PMC free article] [PubMed] [Google Scholar]; (e) Li JL, Day D, Gu M. Adv Mater. 2008;20:3866. [Google Scholar]
- 11.Ingle JDJ, Crouch SR. Spectrochemical Analysis. Prentice Hall; New Jersey: 1988. [Google Scholar]
- 12.(a) Mie G. Anal Phys. 1908;25:376. [Google Scholar]; (b) Yguerabide J, Yguerabide EE. Anal Biochem. 1998;262:137. doi: 10.1006/abio.1998.2759. [DOI] [PubMed] [Google Scholar]
- 13.(a) Draine BT, Flatau PJJ. Opt Soc Am A. 1994;11:1491. [Google Scholar]; (b) Purcell EM, Pennypacker CR. Astrophysical J. 1973;186:705. [Google Scholar]; (c) Kelly KL, Coronado E, Zhao LL, Schatz GC. J Phys Chem B. 2003;107:668. [Google Scholar]
- 14.Hu M, Petrova H, Sekkinen AR, Chen J, McLellan JM, Li Z-Y, Marquez M, Li X, Xia Y, Hartland GV. J Phys Chem B. 2006;110:19923. doi: 10.1021/jp0621068. [DOI] [PubMed] [Google Scholar]
- 15.Wiley BJ, Im SH, Li Z-Y, McLellan J, Siekkinen A, Xia Y. J Phys Chem B. 2006;110:15666. doi: 10.1021/jp0608628. [DOI] [PubMed] [Google Scholar]
- 16.Lee K-S, El-Sayed MA. J Phys Chem B. 2005;109:20331. doi: 10.1021/jp054385p. [DOI] [PubMed] [Google Scholar]
- 17.Tassan S, Mitchell BG, Stramski D, Bricaud A. Geoscience and Remote Sensing, IGARSS ’97, Remote Sensing - A Scientific Vision for Sustainable Development 1997 IEEE International. 1997;2:825. [Google Scholar]
- 18.Cang H, Sun T, Li Z-Y, Chen J, Wiley BJ, Xia Y, Li X. Optics Lett. 2005;30:3048. doi: 10.1364/ol.30.003048. [DOI] [PubMed] [Google Scholar]
- 19.Rossler DM, Faxvog FR. Appl Optics. 1980;19:578. doi: 10.1364/AO.19.000578. [DOI] [PubMed] [Google Scholar]
- 20.Zerda ADL, Zavaleta C, Keren S, Vaithilingam S, Bodapati S, Liu Z, Levi J, Smith BR, Ma T-J, Oralkan O, Cheng Z, Chen X, Dai H, Khuri-Yakub BT, Gambhir SS. Nat Nanotech. 2008;3:557. doi: 10.1038/nnano.2008.231. [DOI] [PMC free article] [PubMed] [Google Scholar]
- 21.Zhang HF, Maslov K, Stoica G, Wang LV. Nat Biotech. 2006;24:848. doi: 10.1038/nbt1220. [DOI] [PubMed] [Google Scholar]
- 22.Wang LV, Wu H. Biomedical Optics: Principles and Imaging. 1. John Wiley and Sons; 2007. [Google Scholar]
- 23.Nikoobakht B, El-Sayed MA. Chem Mater. 2003;15:1957. [Google Scholar]
- 24.http://omlc.ogi.edu/spectra/mb/index.html
- 25.Chen J, Wiley B, Li Z-Y, Campbell D, Saeki F, Cang H, Au L, Lee J, Li X, Xia Y. Adv Mater. 2005;17:2255. [Google Scholar]
- 26.Muskens OL, Bachelier G, Fatti ND, Vallee F, Brioude A, Jiang X, Pileni M-P. J Phys Chem C. 2008;112:8917. [Google Scholar]
Associated Data
This section collects any data citations, data availability statements, or supplementary materials included in this article.