

Abstract
The three-phase respiratory pattern observed during normal breathing changes with alterations in metabolic or physiological conditions. A recent study using in situ perfused rat brain preparations demonstrated a reorganization of the respiratory pattern with sequential reduction of the brain stem respiratory network. Specifically, with removal of the pons, the normal three-phase pattern transformed to a two-phase inspiratory–expiratory pattern and, with more caudal transections, to one-phase, intrinsically generated inspiratory oscillations. A minimal neural network proposed to reproduce these transformations includes 1) a ringlike mutually inhibitory network composed of the postinspiratory, augmenting expiratory, and early-inspiratory neurons and 2) an excitatory preinspiratory neuron, with persistent sodium current (INaP)-dependent intrinsic bursting properties, that dynamically participates in the expiratory–inspiratory phase transition and inspiratory phase generation. We used activity-based single-neuron models and applied numerical simulations, bifurcation methods, and fast–slow decomposition to describe the behavior of this network in the functional states corresponding to the three-, two-, and one-phase oscillatory regimes, as well as to analyze the transitions between states and between respiratory phases within each state. We demonstrate that, although INaP is not necessary for the generation of three- and two-phase oscillations, it contributes to control of the oscillation period in each state. We also show that the transitions between states can be produced by progressive changes of drives to particular neurons and proceed through intermediate regimes, featuring high-amplitude late-expiratory and biphasic-expiratory activities or ectopic burst generation. Our results provide important insights for understanding the state-dependent mechanisms for respiratory rhythm generation and control.
INTRODUCTION
Experimental evidence suggests that most stereotypic rhythmic movements such as breathing and locomotion are generated by central pattern generators (CPGs), special networks of neurons located in particular regions of the CNS that are capable of endogenous (i.e., without rhythmic inputs from other structures or sensory feedback) generation of patterned rhythmic output (for review see Grillner 2006; Marder and Bucher 2001). The patterned rhythmic activities generated by CPGs are usually defined by both the intrinsic properties of neurons comprising a CPG and the interconnections among these neurons. Each CPG, however, is incorporated into a larger neural system and operates under the control of various central and peripheral inputs. These external inputs modify the motor patterns generated by the CPG and adjust it to the internal and/or external environment, current motor task, and organismal needs. These inputs not only may regulate oscillation period and amplitude of the output rhythmic motor activity but also, under certain conditions, may dramatically reconfigure the CPG by changing the rhythmogenic mechanisms in operation. Understanding the complex mechanisms and processes involved in control of CPG activity including such reconfiguration, which provides adaptive alteration of patterned rhythmic output, is a central and challenging problem in neuroscience.
Our study addressed these issues in the mammalian respiratory CPG, which is located in the lower brain stem (Cohen 1979) and generates the rhythmic pattern of alternating inspiratory and expiratory activities that drives breathing. The motor pattern observed during normal breathing is considered to consist of three phases: a phase of inspiration, associated with phrenic motor activity producing lung inflation, and two expiratory phases: postinspiration and late (stage 2) expiration (Richter 1982, 1996). The postinspiratory phase is evident in recordings from the recurrent laryngeal or central vagus nerves (e.g., Smith et al. 2007). It is associated with the formation of cranial motor outflows and is essential for control of the glottal musculature and upper airway and for several other behaviors, such as vocalization and swallowing (e.g., Paton and Dutschmann 2002).
This rhythmic pattern of respiratory activity originates within a bilateral column of medullary neurons, the ventral respiratory column (VRC), and is controlled by inputs from other medullary structures (e.g., the retrotrapezoid nucleus [RTN] and raphé) and the pons. The VRC includes several rostrocaudally arranged compartments (see Fig. 1A): the Bötzinger complex (BötC), the pre-Bötzinger complex (pre-BötC), and the rostral (rVRG) and caudal (cVRG) parts of the ventral respiratory group (VRG). Respiratory neurons in these compartments are usually classified based on their firing patterns (e.g., decrementing, augmenting) and their phases of activity relative to the breathing cycle, such as: early-inspiratory (early-I) neurons, with a decrementing firing pattern during inspiration; ramp-inspiratory (ramp-I) neurons, with an augmenting firing pattern during inspiration; postinspiratory (post-I) neurons, with a decrementing firing pattern during expiration; augmenting expiratory (aug-E) neurons, with an augmenting firing pattern during expiration; and preinspiratory (pre-I) neurons that start firing before the onset of inspiration and continue activity throughout the inspiratory phase (for review see Richter 1996).
FIG. 1.

Respiratory regions in the brain stem and network model schematic. A: parasagittal section (Neutral Red stain) of the mature rat brain stem at the level of nucleus ambiguus (NA), ventral respiratory group (VRG), facial nucleus (7), and pons (5, trigeminal nucleus; 7, facial nucleus; 7n, facial nerve; BötC, Bötzinger complex; cVRG, caudal ventral respiratory group; NA, nucleus ambiguus; pre-BötC, pre-Bötzinger complex; RTN, retrotrapezoid nucleus; rVRG, rostral ventral respiratory group; scp, superior cerebellar peduncle; SO, superior olive). B: schematic of the 4-neuron core model of the brain stem respiratory network considered here. Spheres represent neurons (excitatory: red; inhibitory: blue); green triangles represent 3 sources of tonic excitatory drives (in pons, RTN, and raphé) to different neural populations. Excitatory and inhibitory synaptic connections are indicated by red or green arrows and small blue circles, respectively. See text for details. Vertical dot-dashed lines through both A and B indicate transections that delineate reduced preparations in A and reduced models in B. The “medullary preparation” in A and “medullary” model in B are obtained after transection 1 at the pontine–medullary junction. The pre-BötC preparation in A and pre-BötC model in B are obtained after transection 2 at the rostral boundary of the pre-BötC. Dimensions indicated are typical for a 4- to 5-wk-old rat (after Smith et al. 2007).
The BötC, with predominantly inhibitory expiratory neurons (post-I and aug-E), is considered to be a major source of expiratory inhibition in the network (Ezure 1990; Ezure et al. 2003; Jiang and Lipski 1990; Tian et al. 1999). The adjacent, more caudal pre-BötC contains circuitry essential for generating inspiratory activity (Smith et al. 1991, 2000). This region, when isolated in vitro, can intrinsically generate rhythmic bursting activity (Johnson et al. 2001; Koizumi and Smith 2008; Koshiya and Smith 1999). This activity was proposed to be based on persistent sodium current (INaP)–dependent mechanisms (Butera et al. 1999a,b; Koizumi and Smith 2008; Rybak et al. 2003a,b, 2004b; Smith et al. 2000). This proposition, however, was debated by other investigators (see Del Negro et al. 2002; Pace et al. 2007b) whose studies suggested that INaP may not be necessary for the generation of rhythmic activity in the pre-BötC in vitro and that the generation of this activity may involve Ca2+-activated nonspecific cation current (ICAN), synaptically activated by metabotropic glutamate receptors and intracellular Ca2+ release from internal stores (Mironov 2008; Pace and Del Negro 2008; Pace et al. 2007a). Moreover, the mechanisms underlying the generation of inspiratory activity in the pre-BötC in more intact preparations, in which the pre-BötC is embedded in the brain stem respiratory network, have also not been well established.
It has also been suggested that a region ventral and caudal to the facial nucleus (termed the parafacial respiratory group [pFRG]) overlapping with RTN may contain an independent “expiratory oscillator,” activated under certain conditions, and that coupling of this oscillator with the inspiratory oscillator in the pre-BötC may contribute to respiratory rhythm and pattern generation (Feldman and Del Negro 2006; Janczewski and Feldman 2006). However, the specific conditions for activation of this additional pFRG oscillator and cellular/network mechanisms providing its rhythmicity remain to be determined.
In a recent study, the spatial and functional organization of the brain stem respiratory network was studied in an in situ perfused rat brain stem–spinal cord preparation using sequential rostral-to-caudal transections through the brain stem (Rybak et al. 2007; Smith et al. 2007). It was shown that the sequential reduction of the respiratory network reorganizes the network dynamics, such that new rhythmogenic mechanisms emerge. Specifically, starting from a transection at the pontine–medullary junction (transection 1 in Fig. 1A), the normal three-phase respiratory pattern was transformed to a two-phase (inspiratory–expiratory) pattern lacking the postinspiratory phase (including postinspiratory discharges in the central vagus and laryngeal nerves). Subsequent, more caudal transections, made close to or at the rostral boundary of pre-BötC (transection 2 in Fig. 1A), transformed this two-phase (inspiratory–expiratory) activity to synchronized inspiratory oscillations originating within the pre-BötC that were not accompanied by rhythmic expiratory activity and did not require phasic expiratory inhibition to be expressed. The characteristic pattern of these synchronized inspiratory oscillations was termed a one-phase pattern (Rybak et al. 2007; Smith et al. 2007). It was concluded that 1) the expression of the three-phase pattern requires the presence of the pons (i.e., excitatory drive from the pons to the VRC), 2) the generation of the two-phase pattern requires the presence of both the BötC and the pre-BötC and is also dependent on the integrity of the RTN (i.e., on RTN excitatory drive to the VRC), and 3) the one-phase pattern is generated within the pre-BötC and relies on mechanisms endogenous to the pre-BötC. Moreover, the three-phase and two-phase patterns persisted after application of riluzole, a blocker of INaP. In contrast, the one-phase pattern is abolished by administration of riluzole, indicating that this rhythmic activity involves INaP in pre-BötC neurons (Rybak et al. 2007; Smith et al. 2007).
A biophysically detailed computational model of the brain stem respiratory network has been developed to reproduce these observations (Rybak et al. 2007; Smith et al. 2007). The model incorporated interacting populations of respiratory neurons (modeled in the Hodgkin–Huxley style) within spatially organized brain stem compartments (pons, RTN, BötC, pre-BötC, rVRG). The state and behavior of the network were proposed to be dependent on excitatory drives from three major sources putatively located in the pons, RTN, and raphé. The model was able to reproduce the intact three-phase respiratory pattern and its transformation to the two-phase pattern after “pontine transaction” and to the INaP-dependent one-phase pattern after removal of network elements located rostral to the pre-BötC. Analysis of this model has suggested that a minimal neural network that could reproduce these three rhythmogenic mechanisms should include the post-I and aug-E neurons of the BötC and the early-I neurons of the pre-BötC, coupled in a ringlike network with mutually inhibitory interactions, and the excitatory pre-I neurons of the pre-BötC, with intrinsic INaP-dependent bursting properties, that dynamically participate in the expiratory–inspiratory phase transition and in inspiratory phase generation. The state and behavior of this network are also dependent on three excitatory drives attributed to the pons, RTN, and raphé (see Fig. 1B).
The objective of the present study was to develop a relatively simple reduced network model that was suggested to represent the core of the previous biophysical model (Rybak et al. 2007; Smith et al. 2007) and to harness this reduced model to theoretically investigate the functional states and corresponding oscillatory regimes inherent in the network. Using numerical simulations in combination with bifurcation analysis and fast–slow decomposition methods, we gained insight into key features of the dynamics of these states. In particular, within each oscillatory regime, we considered the dynamic mechanisms underlying transitions between respiratory phases and the ways in which gradual changes of excitatory drives to particular cells in the network (that may represent changes in metabolic and physiological conditions) can control oscillation period and phase durations. Further, we explored how simulated transections or more gradual changes of drives can produce state transitions, changing the rhythmogenic mechanism operating in the network and the respiratory pattern generated.
METHODS
Model description
The spatially organized model of the respiratory network considered herein represents a reduced version of the earlier computational model proposed by Smith et al. (2007). The model presented here contains four neurons (i ∈ {1, 2, 3, 4}) and three sources of excitatory drive (dk; k ∈ {1, 2, 3}) (see Fig. 1B). The four neurons include one excitatory pre-I (i = 1) and one inhibitory early-I (i = 2) neuron, representing these neuronal types in the pre-BötC, and two inhibitory neurons, post-I (i = 3), and aug-E (i = 4), representing these neuronal types in the BötC.
The inhibitory connections from the BötC post-I and aug-E neurons to inspiratory neurons (pre-I and early-I) and to each other are based on the numerous experimental data confirming that these neuron types generate expiratory inhibition that is widely distributed within the medullary respiratory network (e.g., see Bianchi et al. 1995; Duffin et al. 2000; Ezure 1990; Ezure et al. 2003; Fedorko et al. 1989; Jiang and Lipski 1990; Lindsey et al. 1987; Segers et al. 1987; Shen and Duffin 2003; Tian et al. 1999) and were suggested by previous models (Balis et al. 1994; Botros and Bruce 1990; Duffin 1991; Duffin et al. 1995; Gottschalk et al. 1992; Ogilvie et al. 1992; Rybak et al.1997, 2004a). The presence of excitatory neurons in the pre-BötC (represented in the model by the pre-I neuron) has been confirmed by many studies (e.g., Koshiya and Smith 1999; Rekling et al. 2000; Stornetta et al. 2003). The inhibitory early-I neurons of pre-BötC represent inspiratory neurons that inhibit expiratory neurons during inspiration (Bianchi et al. 1995; Ezure 1990; Richter 1982, 1996; Segers et al. 1987; see also previous models, cited earlier). The assumption that these neurons are located within the pre-BötC is based on earlier studies in cats (Schwarzacher et al. 1995) and recent studies in rats (Hulsmann et al. 2007; Kuwana et al. 2006), confirming the presence of inhibitory interneurons in this region.
All neurons are described as activity-based (nonspiking) models. This simplified yet well-established general form of neuronal model was selected for specific reasons. First, we sought to check whether the network's rhythmogenic capabilities could be encapsulated in such a minimal representation, implying that more complex features, and the tuning of additional parameters, are not necessary for the investigated network behaviors to occur. Second, this simplified description allowed us to perform bifurcation analysis of the transitions between different oscillatory regimes (states), and between different phases within each regime, and to understand the emergence of intermediate activity patterns in transitions between rhythms.
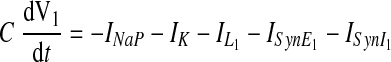
Each neuron in the reduced model represents a specific neural population and is described by an activity-based model, in which the dependent variable V represents an average voltage for that population and each output f(V) represents the average or integrated population activity at the corresponding average voltage (Ermentrout 1994). At the same time, we formulated the model to include explicit representation of ionic currents so that we could consider the role of the persistent (slowly inactivating) sodium current INaP. Specifically, the excitatory pre-I neuron in our model has intrinsic oscillatory properties defined by INaP (see Butera et al. 1999). The membrane potential of this neuron, V1, obeys the following differential equation
 |
(1) |
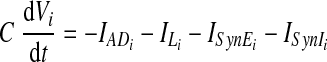
The other three neurons (i ∈ {2, 3, 4}) are adaptive neurons (with adaptation behavior defined by the outward potassium current IADi), each with a membrane potential Vi that evolves as follows
 |
(2) |
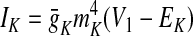
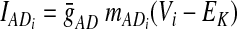
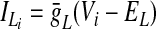
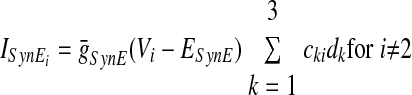
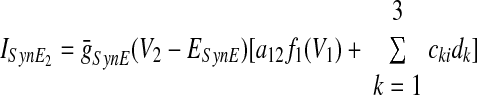
In the preceding equations, C is the neuronal capacitance; IK represents the potassium delayed rectifier current; ILi (i ∈ {1, 2, 3, 4}) is the leakage current; and ISynEi and ISynIi (i ∈ {1, 2, 3, 4}) are the excitatory and inhibitory synaptic currents, respectively. These currents are described as follows
 |
 |
 |
 |
(3) |
 |
 |
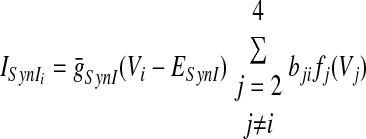 |
where g¯NaP, g¯K, g¯AD, g¯L, g¯SynE, and g¯SynI are the maximal conductances of the corresponding currents; ENa, EK, EL, ESynE, and ESynI are the corresponding reversal potentials; a12 defines the weight of the excitatory synaptic input from the pre-I to the early-I neuron (see Fig. 1B); bji defines the weight of the inhibitory input from neuron j to neuron i (i ∈ {1, 2, 3, 4}, j ∈ {2, 3, 4}); and cki defines the weight of the excitatory synaptic input to neuron i from drive k (dk, k ∈ {1, 2, 3}).
In some cases during simulation, total independent excitatory drives (Di, i ∈ {1, 2, 3, 4}) were varied, without decomposition into weighted sums of drives dk. In these cases, in the equations for ISynEi and ISynIi in equation system 3, term ∑k=13 ckidk was replaced with Di.
The nonlinear function fi(Vi) defines the output activity of each neuron (indirectly representing the rate of spiking activity)
 |
(4) |
where V1/2 is the half-activity voltage and kVi defines the slope for the output function for each neuron. Since each Vi represents an average voltage, it is reasonable to have nonzero output even at hyperpolarized values of Vi, although fi(Vi) becomes quite small when Vi is low enough.
There are two types of slow variables in the model. One variable (hNaP) represents the slow inactivation of the persistent sodium current (Butera et al. 1999) in neuron 1 (pre-I); the other variables (mADi, i ∈ {2, 3, 4}) denote the levels of adaptation in the other three neurons (each with fixed time constant τADi and maximal adaptation kADi)
 |
 |
(5) |
Voltage-dependent activation and inactivation variables and time constants for the persistent sodium and potassium rectifier channels in neuron 1 are described as follows (Butera et al. 1999)
 |
 |
 |
(6) |
 |
Model parameters
The following values of parameters were used (unless other values are specified in particular simulations):
Membrane capacitance (pF): C = 20.
Maximal conductances (nS): g¯NaP = 5.0, g¯K = 5.0, g¯AD = 10.0, g¯L = 2.8, g¯SynE = 10.0, g¯SynI = 60.0.
Reversal potentials (mV): ENa = 50, EK = −85, EL = −60, ESynE = 0, ESynI = −75.
Synaptic weights: a12 = 0.4; b21 = 0, b23 = 0.25, b24 = 0.35, b31 = 0.3, b32 = 0.05, b34 = 0.35, b41 = 0.2, b42 = 0.35, b43 = 0.1; c11 = 0.115, c12 = 0.3, c13 = 0.63, c14 = 0.33, c21 = 0.07, c22 = 0.3, c23 = 0, c24 = 0.4, c31 =0.025, c32 = c33 = c34 = 0.
Parameters of fi(Vi) functions (mV): V1/2 = −30, kV1 = 8, kV2 = kV3 = kV4 = 4. Thus these functions were identical for all neurons except the pre-I [and labeled in figures as f(Vi)]
Time constants (ms): τhNaPmax = 6,000, τAD2 = τAD4 = 2,000, τAD3 = 1,000.
Adaptation parameters: kAD2 = kAD4 = 0.9, kAD3 = 1.3.
The asymmetries in synaptic weights defining mutual inhibitory interactions between early-I, post-I, and aug-E neurons (e.g., b23 > b32, b34 > b43, but b24 = b42) were set to specify the order in which these cells fire. These and other synaptic weights (e.g., those defining interactions between the pre-I and other neurons, a12, b31, b41, and the effects of external drives, cij) and other model parameters were adjusted to qualitatively reproduce the typical firing profiles and/or voltage time courses of the corresponding respiratory neuron types and were not based on experimental measurements. The drive parameters d1, d2, and d3 represent input to various respiratory cells, hypothesized to come from different brain stem regions (pons, RTN, and raphé, respectively; see Fig. 1A). By default we considered d1 = d2 = d3 = 1. In simulations of transections, the value of drive parameter di for the removed drive source i was switched to zero. In some simulations, these parameters were varied gradually to simulate modulation of the activity levels in the corresponding regions.
Simulations and bifurcation analysis
Direct simulations were performed using Matlab 7.5.0. Differential equations were solved using a variable order multistep differential equation solver ode15s available in Matlab. Bifurcation analysis was performed using XPPAUT, freely available at http://www.pitt.edu/∼phase (Ermentrout 2002). Note that there are eight variables in the full respiratory CPG model that we consider. At most points in the corresponding eight-dimensional phase space, the voltages V1, …, V4 evolve much more quickly than the inactivation variable hNaP and the adaptation variables mADi (i = 2, 3, 4). Thus we refer to the voltages as the fast variables and the system of differential equations for V1, …, V4 as the fast subsystem. Equilibrium points of the fast subsystem occur where the right-hand sides of all equations in the fast subsystem are zero and typically form smooth equilibrium surfaces. Mathematical theory (singular perturbation theory) shows that in a small neighborhood of each such surface, the activation variables evolve according to Eq. 5 and, in general, the fast variables follow along in a way that keeps the right-hand sides of the fast subsystem small. This slaving of the fast variables to the activation variables persists until the variables reach some sort of transitional feature, typically a fold, on the equilibrium surface that they are following. When such a feature is reached, the fast variables typically make a fast jump, away from the equilibrium surface near that the system had been evolving, until the variables reach a neighborhood of another equilibrium surface and Eq. 5 once again controls the dynamics.
Bifurcation analysis was used to identify fast subsystem equilibrium surfaces and transitional features. Bifurcation diagrams were created by treating the variables hNaP and mADi as fixed parameters and following curves of equilibrium points of the differential Eqs. 1 and 2 for voltages V1, …, V4. In some cases, bifurcation curves were generated by simultaneously varying two activation variables, holding the other two fixed. In other cases, all four activation variables were varied simultaneously along a one-dimensional curve in four-dimensional space. To select this curve, the full system (Eqs. 1, 2, and 5) for all eight variables was first simulated in XPPAUT for n time steps. The values of the activation variables along the resulting solution were saved in an n × 4 matrix, where each row corresponded to the values of the four activation variables at a particular time step. A single auxiliary bifurcation parameter was introduced and variation of this parameter corresponded to selection of different rows in the matrix and thus to selection of different vectors of activation variable values. XPPAUT was used to track one-dimensional curves of equilibrium points for the four voltage differential equations as this parameter was varied, to determine the stability of points on these curves and to identify transitional points along these curves, defined by a change in stability.
RESULTS
Intact core model of the pontine–medullary respiratory network
GENERATION OF THREE-PHASE RESPIRATORY OSCILLATIONS.
The intact (pontine–medullary) model shown in Fig. 1B with the basic set of parameters (see methods) generated stable oscillations with period T = 2.5 s, duration of inspiration TI = 0.9 s, and duration of expiration TE = 1.6 s (Fig. 2A). These values are within the physiological ranges of these characteristics observed in the arterially perfused preparations of the juvenile rat (Paton 1996; Paton et al. 2006; Smith et al. 2007).
FIG. 2.

Generation of the 3-phase respiratory pattern in the intact model. A: traces of model output activities for all 4 neurons. B: mathematical representation of the “bio” 3-phase pattern, projected to (V1, V2, V3). During the early-inspiratory (early-I), postinspiratory (post-I), and augmenting expiratory (aug-E) phases, the solution trajectory follows curves of fast subsystem equilibria (dark solid curves). When transition surfaces are reached (red curves denote one-dimensional bifurcation curves within these surfaces), fast jumps between equilibrium surfaces occur (blue dashed curves, arrows), indicating transitions between phases of activity. Light blue curves show curves of unstable equilibria of the fast subsystem for the vectors (hNaP, mAD2, mAD3, mAD4) that arise along each fast jump. Each curve of unstable equilibria eventually connects with a curve of stable equilibria (green curves) at a fold point. C: the solution trajectory (solid) projected to (mAD2, mAD3) space consists of an inspiratory phase of increasing mAD2 and an expiratory phase of decreasing mAD2; fast jumps do not appear since mAD2, mAD3 are essentially constant along these jumps. Arrows show direction of time evolution. Transitions occur at bifurcation curves (dashed, inspiration-to-expiration or I-to-E; dash-dotted, expiration-to-inspiration or E-to-I). The E-to-I transition curve features 2 components, one corresponding entirely to escape from inhibition (escape) and the other to a combination of release and escape (release); see text for further details.
During expiration, the post-I neuron demonstrates adapting (decrementing) activity (Fig. 2A) that is defined by the dynamic increase in its adaptation variable mAD3 (see Eqs. 2 and 5). The corresponding decline in inhibition from the post-I neuron shapes the augmenting profile of aug-E activity. This reduction in post-I inhibition also produces slow depolarization of pre-I and early-I neurons. In addition, the pre-I neuron is depolarizing because of the slow deinactivation of INaP (slow increase of hNaP; see Eq. 5). Finally, at some moment during expiration, the pre-I neuron rapidly activates, providing excitation of early-I. The latter inhibits both post-I and aug-E, completing the switch from expiration to inspiration (Fig. 2A). At a higher level of excitability (e.g., with a higher drive to this neuron), early-I can release from inhibition first and initiate the transition to inspiration itself.
The abruptness of the switch to inspiration arises naturally from the dynamics of the model. To understand this, we define a fast subsystem of our model, consisting of the four voltage variables. Numerically, we can track the fast subsystem equilibrium surfaces along which these variables are relatively constant and we can also detect bifurcation curves, where solutions will jump away from each surface (see methods). During expiration, the system drifts along near an equilibrium surface (Fig. 2B). It is important to note that, although the expiratory period can be conditionally subdivided into postinspiration (with a dominant post-I activity) and late expiration (with reduced post-I and expressed aug-E activity), there is no clear switching between post-I and aug-E phases in the three-phase rhythm. In contrast, the moment of pre-I activation occurs when the system reaches a bifurcation curve along the post-I/aug-E equilibrium surface (Fig. 2B). This event allows the fast voltage variables to evolve quickly until they again reach an equilibrium surface, yielding a fast jump to the inspiratory phase (early-I in Fig. 2B).
During inspiration, the system drifts near this new equilibrium surface, with its dynamics governed by Eq. 5. Specifically, the early-I neuron demonstrates adapting (decrementing) activity (Fig. 2A), defined by the dynamic increase in its adaptation variable mAD2 (see Eqs. 2 and 5). The decline in inhibition from this neuron produces a slow depolarization of the post-I and aug-E neurons. Eventually, the system reaches another bifurcation curve and a second fast jump occurs (Fig. 2B). Within this fast jump, the post-I neuron rapidly activates and inhibits both inspiratory neurons (pre-I and early-I) and the aug-E neuron (initially), producing the switch from inspiration to expiration (Figs. 1B and 2A).
Since the post-I and aug-E regimes represent a continuous curve along the same equilibrium surface, without a fast jump between them, the three-phase respiratory rhythm remains two-phase in a mathematical sense. We call this regime a “biological” (or “bio”) three-phase pattern, in contrast to another regime, described later, representing a “mathematical” (or “math”) three-phase pattern, complete with three fast jumps. Since the bio three-phase pattern includes only two fast jumps, it is informative to consider projections of the corresponding trajectories and transition curves to two-dimensional phase planes. An example of such a projection is shown in Fig. 2C. Two distinct transition curves, for the inspiration-to-expiration and expiration-to-inspiration fast jumps, are evident and the oscillatory trajectory becomes a loop between these curves, with one part of the loop corresponding to the inspiratory (early-I active) phase and a second corresponding to both expiratory (post-I and aug-E) phases.
Interestingly, when projected to the (mAD2, mAD3) plane, the transition curve from expiration to inspiration is composed of two branches (Fig. 2C), corresponding to release (upper branch) and escape (lower branch) components of transition, respectively (e.g., Skinner et al. 1994). Note that the fast jumps themselves are not visible in this projection, since the changes in mAD2, mAD3 across these jumps are negligible. The difference between release and escape may be explained as follows. From a starting condition in the expiratory regime, a trajectory would require an increase in mAD3 to reach the uppermost of these two branches. An increase in mAD3 would yield a drop in V3 and thus a decrease in inhibition from post-I to pre-I/early-I. We can think of this as a transition facilitated by release of the pre-I and early-I cells from inhibition, although technically the inhibition from aug-E to pre-I/early-I would still be increasing during this period. In fact, however, we find that trajectories always reach the other, lower branch of the transition curve, rather than the release branch (Fig. 2C). This other branch is reached via a decrease in mAD3, such that the inhibition from post-I to pre-I/early-I is increasing again (along with the inhibition from aug-E) when the transition occurs, but V1, V2 are nonetheless able to escape from this inhibition and jump up, due to the rise in hNaP and the decay in mAD2. The transition from inspiration to expiration, in contrast, is always facilitated by release, with mAD2 growing throughout inspiration. These transition mechanisms have implications for the control of oscillation frequencies and phase durations (see also Curtu et al. 2008). Which mechanism governs a particular transition cannot be predicted from knowledge of the relevant connection strengths (say bij and bji) alone and an advantage of the reduced model formulation is that it allows us to identify these mechanisms.
CONTROL OF OSCILLATION PERIOD AND PHASE DURATIONS IN THE THREE-PHASE RHYTHM-GENERATING STATE.
To study the possible control of period and phase durations in the intact respiratory network state we investigated the effects of variations in the total excitatory drive to each neuron on the oscillation period (T) and on the durations of inspiration (TI) and expiration (TE). The results are summarized in Fig. 3, whereas Fig. 4 shows projections to the (mAD2, mAD3) plane that are useful in understanding why the observed changes occur.
FIG. 3.

Control of oscillation period and phase durations in the 3-phase rhythm-generating state. Changes of the oscillation period (T) and durations of inspiration (TI) and expiration (TE) were produced by the changes in total (dimensionless) drives to the preinspiratory (pre-I) neuron (D1, A), early-I neuron (D2, B), post-I neuron (D3, C), and aug-E neuron (D4, D).
FIG. 4.

Effects of changes in drives Di to each neuron in the 3-phase rhythm-generating state, in (mAD2, mAD3) space. As in Fig. 2C, solid curves are trajectories, dashed curves denote I-to-E transitions, and dash-dotted curves denote E-to-I transitions. As in Fig. 3, changes were produced by changes in total drives to the pre-I neuron (D1, A), the early-I neuron (D2, B), the post-I neuron (D3, C), and the aug-E neuron (D4, D). Note that each trajectory evolves in a counterclockwise direction, with mAD2 increasing during inspiration and decreasing during expiration. Also, each E-to-I transition curve includes 2 components, as in Fig. 2C. Different levels of drives are color-coded as indicated in the figure panels.
An increase in total drive to the pre-I neuron (D1) from 0 to 0.6 produced monotonic shortening in the durations of both expiration and, to a lesser degree, inspiration, with the maximal value of T equal to 4.4-fold its minimal value (Fig. 3A). The reduction of TE occurs because an increase in drive to the pre-I neuron allows this neuron to escape from inhibition earlier, inducing an earlier switch to inspiration. Indeed, although the increased drive would slow deinactivation of INaP (see Eq. 5), its dominant effect is lowering the threshold for the pre-I cell (see Daun et al. 2009). Note that because this transition occurs earlier, the early-I neuron jumps up with a larger value of mAD2 (Fig. 4A). The reduction of TI occurs because, given the larger value of mAD2 at the start of inspiration, less time is needed for early-I to adapt sufficiently to terminate inspiration (i.e., to reach the inspiration-to-expiration transition curve; see Fig. 4A).
An increase in total drive to the early-I neuron (D2) from 0.5 to 0.85 reduces T approximately by half (Fig. 3B). This reduction results from a strong shortening of TE that overcomes a slight increase in TI, seen here but not when the drive to the pre-I neuron was increased. The shortening of TE results from an earlier escape of pre-I/early-I from inhibition and a corresponding earlier switch to inspiration (Fig. 4B). Indeed, as is subsequently discussed further in the following text, with a sufficient increase in D2 the early-I cell replaces the pre-I cell as the initiator of the transition to inspiration. The slight prolongation of TI occurs because inspiration cannot be terminated until there is an additional increase in mAD2, corresponding to further adaptation of the early-I cell, to compensate for the enhanced drive to early-I (Fig. 4B).
An increase in total drive to the post-I neuron (D3) causes a relatively small reduction of both TI and TE (and T) (Fig. 3C). TE becomes shorter because the additional drive to post-I leads to stronger inhibition on aug-E. The resulting weaker activation of aug-E leads to a net weaker inhibition of pre-I and early-I, allowing a slightly earlier escape to inspiration. The reduction in TI results from two main effects. First, a shorter expiration yields a slightly larger mAD2 at the start of inspiration (Fig. 4C), which promotes a shorter inspiration. Second, the stronger drive to post-I allows it to initiate the switch to expiration with slightly less reduction in inhibition from early-I to post-I (Fig. 4C).
An increase in total drive to the aug-E neuron (D4) produces a strong increase in TE and a small increase in TI, leading to an overall large increase in T (Fig. 3D). The prolongation of TE results from a stronger aug-E inhibition of inspiratory neurons that decreases V1 and V2 and necessitates a greater recovery from adaptation and inactivation before inspiration can begin, yielding a delay in the onset of inspiration (Fig. 4D). A small increase in TI follows the TE prolongation because the greater early-I recovery from adaptation during the prolonged expiratory period implies that mAD2 is smaller at the start of inspiration (Fig. 4D). Since aug-E has little effect on the end of inspiration, this change means that more time is needed for the early-I neuron to adapt sufficiently such that the transition to the next expiratory phase can occur.
In summary, variations in drive to different cells in the network influence the durations of inspiration and expiration, and the overall oscillatory period, differently (Fig. 3). These effects are determined by the particular features of the cells’ activity patterns, which translate into the forms of the transition curves between phases, and the distinctive role each cell plays in the transitions between phases, seen in the effects that changes in drive have on the transition curves (Fig. 4).
ROLE OF THE INTRINSIC INAP-DEPENDENT MECHANISMS.
In experimental studies, the role of intrinsic INaP-dependent mechanisms in rhythmogenesis is usually studied by administration of specific blockers of this current (e.g., riluzole) and investigation of the effects of these blockers on rhythm generation and characteristics of oscillations. In our model, only the pre-I cell has INaP. To investigate the role of this current in the intact pontine–medullary model and predict possible effects of such blockers, we investigated how period and amplitude of the pre-I output change with the reduction of maximal conductance of the persistent sodium channels (g¯NaP) from the basic value (5 nS) to zero (Fig. 5, A–D). Even a complete suppression of INaP in the pre-I neuron (g¯NaP = 0) does not stop oscillations in the network (Fig. 5B). Both the amplitude and the duration of inspiratory (pre-I) bursts decline with a decrease in g¯NaP, reaching about 50% of their original levels at g¯NaP = 0 (Fig. 5, B and C). The reduction in inspiratory phase duration arises because the pre-I neuron excites the early-I neuron more weakly and is itself less capable of maintaining a high activity state, such that less adaptation of early-I is needed for inspiration to end (Fig. 5D).
FIG. 5.

Role of INaP in generation of 3-phase oscillations. A: output activity of all neurons at the basic value of g¯NaP = 5.0 nS. B: output activity of all neurons with fully suppressed INaP, i.e., g¯NaP = 0. C: relative changes in the oscillation period (solid line) and the amplitude (dashed line) with g¯NaP variation from 0 to 5 nS. The horizontal dashed-dot line shows a 100% level. D: projections of trajectories and transition curves to (mAD2, mAD3) space. All conventions are as in Figs. 2C and 4, except that colors now code for g¯NaP levels.
The oscillation period also changes with a reduction of g¯NaP, in a way that depends on the relative excitability of the pre-I and early-I neurons. If the excitability of the pre-I neuron is higher than the excitability of the early-I neuron, so that the pre-I neuron escapes from inhibition first and initiates the transition to inspiration, then the reduction of pre-I excitability with lowering of g¯NaP delays the transition to inspiration. This effect increases the duration of expiration and the overall burst period (Fig. 5, C and D). Indeed, the difficulty in initiating inspiration in this regime is apparent in Fig. 5D, where the curve in the (mAD2, mAD3) plane corresponding to g¯NaP = 0 nS shows an additional inflection, and mAD2 begins to grow, before the expiration-to-inspiration transition curve (Fig. 5D, dash-dotted) is reached. Alternatively, if the escape of the early-I neuron defines the transition from expiration to inspiration, then the shortened inspiratory phase is the dominant effect and the burst period decreases as g¯NaP is reduced (data not shown).
Medullary model and generation of two-phase oscillations
Experimental studies in an in situ perfused rat brain stem–spinal cord preparation have demonstrated that brain stem transections at the pontine–medullary junction (see Fig. 1A) (or more caudal transections through the RTN) convert the normal three-phase respiratory pattern to a two-phase pattern lacking the postinspiratory phase (Rybak et al. 2007; Smith et al. 2007). Modeling described in these studies has also suggested that this transformation results from the elimination of pontine drive to VRC, and especially the drive to post-I neurons whose activity is most dependent on this drive. The term “medullary model” is applied here to a reduced basic model lacking tonic drive from the pons (Fig. 1B, under conditions when d1 = 0). Switching to d1 = 0 in the model reduces the excitatory drive to all neurons, but this reduction most strongly affects the post-I neuron, which becomes completely inhibited by the aug-E neuron during inspiration and by the early-I neuron during inspiration. Therefore in the medullary model, the post-I neuron is always inhibited and does not contribute to rhythm generation or the resultant two-phase inspiratory–expiratory oscillations (Fig. 6). With the basic set of parameters (see methods), these oscillations exhibit a period T = 3.23 s, an inspiratory duration TI = 1.38 s, and an expiratory duration TE = 1.85 s (Fig. 6A). These values are within the physiological ranges of these characteristics observed in the arterially perfused preparations of the mature rat (Smith et al. 2007).
FIG. 6.

Generation of the 2-phase respiratory pattern in the medullary model. A: traces of output activities of all 4 neurons. B: projections of a trajectory and corresponding transition curves to (mAD2, mAD4) space. Arrows indicate the direction of evolution for the trajectory. Note that unlike the 3-phase case, the E-to-I transition curve (dash-dotted) has a single component, corresponding to release of the pre-I and early-I cells from inhibition due to the adapting aug-E activity (increasing mAD4) during expiration.
It is important to note that the lack of post-I activity in the two-phase oscillations dramatically changes the shape of the aug-E activity pattern in comparison with the intact state. In the intact model, because of the slow disinhibition from the adapting post-I neuron, the aug-E neuron showed a classical augmenting burst shape (see Fig. 2A). In the medullary model with the lack of post-I inhibition, this neuron is active throughout expiration and exhibits an adapting pattern (Fig. 6A) defined by the dynamic increase in its adaptation variable mAD4 (see Eq. 5 and Fig. 6B). This change in the aug-E firing pattern with the switch to two-phase oscillations has not been considered experimentally and represents a prediction from our model for further experimental studies.
The decline in inhibition from the decrementing activity of the aug-E neuron allows a slow depolarization of the pre-I and early-I neurons (Fig. 6A). In addition, the slow deinactivation of INaP (slow increase of hNaP; see Eq. 5) promotes the depolarization of the pre-I neuron. After some time during which these effects accumulate, the system reaches a transition curve, at which the pre-I neuron activates and thus excites the early-I cell. The latter inhibits aug-E, completing the switch from expiration to inspiration (Fig. 6A). Note that the aug-E neuron plays the same role in the generation of two-phase oscillations as the post-I played in the three-phase oscillations in the intact model. Unlike the transition from expiration to inspiration in the three-phase oscillation, however, the gradual release of the inspiratory cells from inhibition now continues right up to the fast jump, together with an escape component provided by these cells’ recovery from adaptation and inactivation, respectively (Fig. 6B). At a higher level of excitability (e.g., with a higher drive to this neuron), early-I can release from inhibition first and initiate the transition to inspiration itself.
During inspiration, the early-I neuron demonstrates adapting (decrementing) activity (Fig. 6A) defined by the dynamic increase in its adaptation variable mAD2 (see Eq. 5 and Fig. 6B). The decay in inhibition from this neuron allows a slow depolarization of aug-E. Eventually, the system reaches a transition curve, at which the aug-E neuron activates and inhibits both inspiratory neurons (pre-I and early-I), producing a switch from inspiration to expiration (Fig. 6, A and B).
Both the bio three-phase oscillations discussed earlier and the biological two-phase oscillations feature two fast jumps, qualifying as two-phase oscillations mathematically (see Figs. 2, B and C and 6B). It is important to note, however, that the expiratory phase is spent on different equilibrium surfaces or, possibly, distinct branches of a single equilibrium surface, in the bio three-phase and two-phase oscillations. Clearly, the values and dynamics of V3, V4 are very different on these different expiratory equilibrium surfaces. We will explore their distinctiveness more fully later in the text, when we specifically discuss transitions between oscillatory states.
Figure 7, A–C shows how the period of oscillation (T) and phase durations (TI and TE) change with variation in the drive to each neuron in the medullary model. An increase in total drive to the pre-I neuron (D1) from 0.025 to about 0.1 causes a steep drop in the duration of expiration (TE) and, correspondingly, the oscillation period T (Fig. 7A). This occurs because at a relatively low drive to the pre-I neuron, its escape from inhibition is mostly defined by the dynamics of persistent sodium inactivation (hNaP; see Eq. 5). Specifically, an increase in drive allows escape from inhibition to occur at a significantly lower level of hNaP, allowing for a much shorter expiratory phase (for more details see also Daun et al. 2009). Once the drive to the pre-I cell becomes sufficiently large, this effect saturates, leading to fairly constant TE and T. Eventually, the extra drive to pre-I can become strong enough that it prolongs the inspiratory phase via indirect inhibitory effects on the aug-E cell, mediated by the early-I cell that it excites, and T can increase slightly as a result.
FIG. 7.

Control of the oscillation period and phase durations in the 2-phase rhythm-generating state. Changes of the oscillation period (T) and the durations of inspiration (TI) and expiration (TE) in the medullary model were produced by the changes in total (dimensionless) drives to pre-I neuron (D1, A), early-I neuron (D2, B), and aug-E neuron (D4, C).
An increase in total drive to the early-I neuron (D2) from about 0.06 to 0.4 causes a balanced increase of TI and reduction of TE without significant changes in T (Fig. 7B). These changes are expected from a half-center adaptation-based oscillator, comprised here by the early-I and aug-E neurons, coupled with mutual inhibition (see also Daun et al. 2009). Note that the effects of varying D2 are different here from the three-phase case (Fig. 4B), particularly with respect to the expiratory phase, due to the difference in expiration-to-inspiration transition mechanisms across these cases.
An initial increase in total drive to the aug-E neuron (D4) from 2.29 to about 3.7 causes a balanced increase of TE and decrease of TI with only small changes in T (Fig. 7C). These changes are opposite to those produced by an increase in tonic drive to the early-I neuron (Fig. 7B), corresponding to their opposite roles in the oscillations, and are typical for a half-center adaptation-based oscillator, as mentioned earlier. In contrast, with a further increase of D4, the duration of expiration and the period increase drastically (Fig. 7C). This steep increase occurs because of two mechanisms. First, with an increase in inhibition from aug-E, the early-I neuron is no longer able to make the jump to the inspiratory phase without the “help” of (excitatory input from) the pre-I neuron. Second, the increasing aug-E inhibition to pre-I reduces the excitability of the latter, necessitating significantly greater deinactivation of INaP (increase in hNaP) for the transition to inspiration to occur.
In summary, changes in period and phase durations with changes in drive fall into two regimes: one in which the pre-I cell dominates the transition from expiration to inspiration and drives act primarily though effects on INaP and another in which the early-I cell leads this transition and thus the aug-E and early-I cells behave as a typical adaptation-based half-center oscillator.
To further understand the role of INaP in the two-phase oscillations generated by the medullary model and predict possible effects of INaP blockers on two-phase oscillations, we investigated how period and amplitude of the output (pre-I) activity change with the reduction of the maximal conductance of the persistent sodium channels (g¯NaP). A reduction of g¯NaP in the pre-I neuron all the way down to zero does not abolish two-phase oscillations in the network (Fig. 8). Instead, oscillations in the network persist, with the amplitude and duration of inspiratory bursts falling, and burst period increasing, as g¯NaP is reduced. At g¯NaP = 0, burst amplitude, duration, and period are changed by about −80, −50, and +45%, respectively (see Fig. 8, A–C). Interestingly, these effects are different from those seen by reducing the drive D1 to the pre-I cell and keeping g¯NaP intact. This difference arises because, unlike reductions in D1, decreases in g¯NaP can switch control of the onset of inspiration from the pre-I to the early-I cell. That is, the initial increase of burst period results from reducing the availability of INaP at the onset of inspiration, necessitating additional deinactivation for the transition to occur. When g¯NaP becomes sufficiently small, the early-I cell takes over the transition to inspiration, and therefore the burst period becomes stabilized at some higher duration, independent of g¯NaP.
FIG. 8.

Role of INaP in the generation of the 2-phase oscillations. A: output activity of all neurons at the basic value of g¯NaP = 5.0 nS. B: output activity of all neurons with fully suppressed INaP, i.e., at g¯NaP = 0. C: relative changes in the oscillation period (solid line) and the amplitude (dashed line) with g¯NaP variation from 0 to 5 nS. The horizontal dashed-dot line shows a 100% level.
Pre-BötC model and generation of one-phase oscillations
As shown in experimental studies on an in situ perfused rat brain stem–spinal cord preparation, medullary transections at the rostral boundary of the pre-BötC (see Fig. 1A) transform the remaining circuitry to a state in which rhythmic (“one-phase”) inspiratory activity is produced endogenously within the pre-BötC (Rybak et al. 2007; Smith et al. 2007). Modeling studies have suggested that this transformation results from the reduction of total drive and elimination (or significant reduction) of phasic inhibition to the pre-BötC. The term “pre-BötC model” is applied here to a reduced model lacking inhibition from expiratory (post-I and aug-E) neurons and tonic drives from the pons and RTN (Fig. 1B, under conditions when b31 = b32 = b41 = b42 = 0 and d1 = d2 = 0). Therefore in the pre-BötC model, rhythmic activity results exclusively from the dynamics in the pre-I neuron, which incorporates INaP.
With the basic set of parameters (see methods), the pre-BötC model (i.e., actually, the pre-I neuron alone) generates stable intrinsic “inspiratory” oscillations with period of about T = 3.85 s and with approximately half the period spent in active inspiration measured at the 0.25 level of f1(V1) (Fig. 9A), which is within the physiological range for these oscillations (Smith et al. 2007).
FIG. 9.

Generation of one-phase oscillations in the pre-BötC model. A: traces of output activities of pre-I and early-I neurons. B: bifurcation diagram for the full system given by Eqs. 1, 2, and 5, generated with dimensionless bifurcation parameter D1. For each fixed D1, the full system has a unique equilibrium point, at which the time derivatives of all variables are zero. The curve formed of these points is plotted, with a dashed component where these points are unstable and a solid component where they are stable. Also, for each D1 value that is not too large, the system has a periodic solution, which is a one-phase oscillation. For each such D1 value, the maximal and minimal values of V1 along the one-phase oscillation are marked with circles. As D1 grows, oscillations are terminated in an Andronov–Hopf (AH) bifurcation near D1 = 0.03 and, for larger D1, the only stable state is an equilibrium point of the full system. C: one-phase oscillations (solid) superimposed on V1 nullclines (dashed) in the (V1, hNaP) plane, for various D1 values as indicated. Recall that each V1 nullcline is the collection of points on which dV1/dt = 0 for the corresponding D1. The hNaP-nullcline, which consists of points where dhNaP/dt = 0 and which is independent of D1 (see Eq. 5), is also shown (dash-dotted). The oscillations evolve clockwise and the amplitude shrinks as D1 increases such that the bifurcation is approached. D: changes of the oscillation period (T) and the durations of inspiration (TI) and expiration (TE) produced by changes in total (dimensionless) drive to pre-I neuron (D1).
The INaP-dependent mechanism for the generation of endogenous rhythmic bursting activity in a single pre-BötC neuron model has been well described, starting from the original work by Butera et al. (1999a). Our pre-BötC neuron model is a reduced version formed by removing the fast sodium current from the model of Butera et al. This reduced model displays a simple relaxation oscillation in the (V1, hNaP) phase plane, unless D1 becomes too large (Fig. 9, B and C). If this happens, then a stable equilibrium point on the V1-nullcline, at relatively elevated V1, results via an Andronov–Hopf (AH) bifurcation, corresponding to sustained depolarization (Fig. 9, B and C).
Figure 9D shows how the period of oscillation (T) and phase durations (TI and TE) are reduced with an increase in drive to the pre-I neuron (D1 = c31d3) from zero to 0.03. Because the bifurcation mechanism that terminates the oscillations is an AH bifurcation, the period of the oscillations approaches that specified by the associated eigenvalues of the linearization of the model at the bifurcation point as D1 approaches the bifurcation point from below. This specified period is significantly smaller than the times of passage around the periodic orbits that exist for small D1, away from the bifurcation. This difference arises because as the bifurcation is approached, the neuron becomes pinned at a high voltage and thus as drive increases, the period of oscillations is reduced threefold (see Fig. 9, C and D).
As noted earlier, the one-phase inspiratory oscillations in the pre-I neuron (and thus in the pre-BötC model) are defined by the slow dynamics of INaP inactivation (hNaP; see Eq. 5). A reduction of the associated maximal conductance g¯NaP in the pre-I neuron causes an increase in oscillation period and decrease in amplitude and, at g¯NaP = 2.5 nS, these oscillations are abolished through an AH bifurcation, giving rise to a stable equilibrium point on the lower branch of the V1-nullcline, corresponding to quiescence (Fig. 10, B–D). As with the AH bifurcation achieved by varying D1, the eigenvalues obtained by linearization determine the nonzero limiting period at which the oscillations terminate. In this case, however, the amplitude of the oscillations remains essentially constant as g¯NaP is varied and the limiting period increases to twice that occurring at the original value of g¯NaP because decreases in g¯NaP make it progressively harder for the neuron to become active (Fig. 10, B–D).
FIG. 10.

Role of INaP in the generation of the one-phase oscillations. A: output activity of early-I neuron at the values of g¯NaP = 5.0 nS (top trace), g¯NaP = 3.0 nS (middle trace), and g¯NaP = 2.5 nS (bottom trace). B: relative changes in the oscillation period (solid line) and the amplitude (dashed line) with g¯NaP variation from 0 to 5 nS; note that oscillations were abolished near g¯NaP = 2.6 nS. C: bifurcation diagram for equation systems 1, 2, and 5 with parameter g¯NaP. For each g¯NaP, the system has a unique equilibrium point, whereas for sufficiently large g¯NaP, the system exhibits one-phase oscillations. Labeling conventions are as in Fig. 9. Oscillations are terminated in an AH bifurcation near g¯NaP = 2.6 nS. D: nullclines and one-phase oscillations in the (V1, hNaP) plane for g¯NaP values as indicated. Because g¯NaP = 2.6 nS is so close to the AH bifurcation, the oscillation at this value is not apparent on this scale.
Transition from three-phase to two-phase oscillations
The modeling studies described earlier directly paralleled the experimental investigations of Rybak et al. (2007) and Smith et al. (2007), in which brain stem transections were used to uncover different rhythmogenic mechanisms embedded in the brain stem respiratory network (see Fig. 1). Such dramatic perturbations, however, do not happen under natural conditions. Nonetheless, similar transformations of rhythmogenesis may occur in the intact network under different physiological and/or metabolic conditions associated with alterations of excitatory drives to particular structures or neural populations. Therefore it was of interest to investigate possible transformations of rhythm-generating mechanisms induced by gradual changes of particular drives in the intact model.
Figure 11 (see also Supplemental Fig. S1A)1 shows the sequential transformation of the respiratory pattern occurring with gradual reduction of total drive to the post-I neuron (D3). With the reduction of D3 to about 0.62, the intact model continued generating oscillations with a (“biological” or “bio”) three-phase pattern (Fig. 11A and Supplemental Fig. S1A). Further reduction of D3 resulted in the emergence of high-amplitude late-E activity in aug-E neuron (at the end of expiration) expressed in every third cycle; then (with further D3 reduction) this late-E was expressed in every second cycle (Fig. 11B); and finally (approximately at D3 = 0.58) in each cycle (Fig. 11C and Supplemental Fig. S1A). We called this pattern (with an expressed late-E activity at the end of expiration) a “mathematical” or “math” three-phase pattern because it involved three fast jumps between surfaces of fast subsystem equilibrium points (Fig. 12; discussed further in the following text).
FIG. 11.

Transition from the “bio” 3-phase pattern to the 2-phase pattern with progressive changing of drive to post-I neuron (D3). All diagrams show traces of output activities of all 4 neurons. D3 reduces from top to bottom, as is evident from diagram labels. A illustrates the initial “bio” 3-phase pattern. Note the emergence of late-E burst in aug-E neuron in B and C. Diagram C represents the “math” 3-phase oscillations. Diagram D shows an example of biphasic-E pattern in aug-E neuron. Finally, diagram E illustrates 2-phase oscillations.
FIG. 12.

Trajectory and curves of equilibrium points for the math 3-phase pattern, generated with d1 = 0.85. As in Fig. 2B, the dashed blue curves represent the fast jumps of the solution trajectory under projection to (V2, V3, V4) space, which initiate at transition curves shown in red. The additional solid curves consist of equilibrium points of the fast (voltage) equations. The equilibrium curves along which the solution slowly travels between fast jumps are labeled (early-I, post-I, aug-E). Additional curves that exist for each vector (hNaP, mAD2, mAD3, mAD4) assumed along a fast jump are shown in light blue (unstable) and green (stable). Jump 1 refers to the jump from early-I to post-I, jump 2 to the jump from post-I to aug-E, and jump 3 to the jump from aug-E to early-I. The latter features a small “blip” at which V3 increases, labeled in the figure and also apparent in Fig. 13B2, for example. Where this blip occurs, the trajectory passes near a small segment of a stable branch of fast subsystem equilibria (magenta) that connects curves of unstable equilibria (light blue).
Further reduction of D3 beyond the math three-phase oscillation (≲0.46) produces multiple oscillations during expiration, with alternating activity of aug-E and post-I neurons (not shown), and with D3 ≲0.42, a biphasic-E activity (with post-I and late-E components) emerged in the aug-E neuron output (Fig. 11D and Supplemental Fig. S1A).
With further reduction of D3 (≲0.34), the post-I neuron became fully inhibited during expiration by the aug-E neuron and the intact model switched to the generation of two-phase oscillations (with lack of post-I activity; see Fig. 11E and Supplemental Fig. S1A). Thus we have demonstrated that a gradual reduction of the drive to post-I neuron can sequentially transform the network state (and output oscillations) from a state producing bio three-phase oscillations to a state generating math three-phase oscillations, and then to a state producing two-phase oscillations. The latter are similar to those generated by the medullary model, i.e., after complete removal of pontine drive, and indeed, gradual reduction in the pontine drive parameter d1 yields a similar transition sequence (data not shown). We have also demonstrated that an increase of the drive to aug-E can also switch the network from the state generating bio three-phase oscillations to the state generating math three-phase oscillations (Supplemental Fig. S1B), but a further increase in this drive cannot switch the network to the two-phase oscillation regime.
It is informative to consider the bifurcation events underlying the three- to two-phase transition sequence. As discussed previously, in the bio three-phase oscillatory regime, the post-I and aug-E expiratory regimes correspond to passage along the same expiratory fast subsystem equilibrium surface, with low V1, V2 and relatively elevated V3 (Figs. 2B and 13, A1 and A2). As d1 or D3 was reduced, additional equilibrium branches with less elevated V3 (Fig. 13B2, red and magenta curves), but elevated V4, emerged. One new branch corresponds to the late-E component of the aug-E phase (Fig. 13, B1 and B2, red curve) and math three-phase oscillations incorporate a jump to this branch, for a total of three fast jumps per oscillation cycle: early-I to post-I, post-I to aug-E, and aug-E to early-I. As in Fig. 2B, the relevant equilibrium surfaces and bifurcation curves can be plotted in (V2, V3, V4) space to give a more complete view of the relative positions of the equilibrium surfaces and bifurcation curves relate, which is helpful in confirming that they represent distinct states (Fig. 12). Interestingly, during the jump from aug-E to early-I, a transient increase in V3 occurs, which appears to reflect passage near the additional equilibrium surface that is never actually visited (Figs. 11, B and C, 12, and 13B2, magenta curve).
FIG. 13.

Fast subsystem equilibrium points encountered along solutions. Simulation of each rhythm yields values of (hNaP, mAD2, mAD3, mAD4) along the corresponding solution. These values form a one-dimensional curve in 4-dimensional (hNaP, mAD2, mAD3, mAD4) space, which we parameterize by an abstract “bifurcation parameter” (see methods). Each panel shows the equilibrium points for the fast (voltage) subsystem at each point along the one-dimensional curve. Different branches of stable equilibria (blue, black, red, magenta) are connected by branches of unstable equilibria (light blue). Oscillations consist of phases spent near these branches (early-I, post-I, etc., as labeled in the figure panels) and fast jumps between these branches (arrows). A1 and A2 show, respectively, changes of V1 and V3 for the bio 3-phase oscillation, with d1 = 1. B1 and B2 show changes of V1 and V3 for the math 3-phase oscillation, with d1 = 0.85. C1 and C2 show changes of V1 and V3 for the 2-phase oscillation, with d1 = 0.35.
With a further reduction in d1 or V3, the elevated V3 equilibrium branch (Fig. 13B2, black curve) was lost, through an additional sequence of bifurcation events, leading to a complicated sequence of switches between post-I and aug-E dominance (e.g., Fig. 11D). At the end of the sequence, two-phase oscillations, lacking a period of high V3 activity, remained (Fig. 13, C1 and C2).
The key point here is that the transition from the bio three-phase rhythm, with appropriate characteristics, to the two-phase rhythm requires the birth of a new equilibrium state with elevated V4. This birth eventually gives rise to two new equilibrium branches (Fig. 13, B1 and B2, red and magenta curves) and occurs while the elevated V3 state still exists, making available a branch of equilibria (Fig. 13, B1 and B2, magenta curve) that is not essential to the three-phase rhythm but that can participate in the annihilation of the elevated V3 state (Fig. 13, A1, A2, B1, and B2, black curve). The late-E surges in aug-E activity arise before the elevated V3 state disappears, as a natural consequence of this bifurcation sequence.
Transition from two-phase to one-phase oscillations
The transitions from two-phase to one-phase oscillations were studied using a reduced medullary model that, for the basic set of parameters, generated typical two-phase oscillations. Figure 14 shows that the gradual reduction of total drive to the early-I neuron (D2) altered network activity. Specifically, with reduction of this drive ≲0.06, the two-phase pattern went through a series of transitional states and finally (with D2 <0.05) transformed to one-phase oscillations similar to those generated by the pre-BötC model (Fig. 14; see also Supplemental Fig. S2). A similar sequence could be obtained with a decrease in drive d2 (from the RTN; see Fig. 1).
FIG. 14.

Transition from the 2-phase oscillations to the one-phase oscillations with progressive changing of drive to early-I neuron (D2). All diagrams show traces of output activities of all 4 neurons. D2 reduces from top to bottom, as is evident from diagram labels. A illustrates the initial 2-phase pattern. Note the emergence of ectopic bursts in pre-I neuron in B and C. Finally, diagram D illustrates the resultant one-phase oscillations.
The transitional states between two- and one-phase oscillations (e.g., with D2 between 0.06 and 0.05) were characterized by the emergence of “ectopic” bursts of activity, which were actually the “one-phase,” INaP-dependent bursts generated intrinsically by the pre-I neuron and could be eliminated by a reduction of g¯NaP <2.5 nS (not shown). As D2 was reduced, first just one such ectopic burst emerged between the normal network bursts (Fig. 14B), then two such bursts (Fig. 14C), and so on until the network completely switched to pure one-phase oscillations accompanied by tonic activity in the aug-E neuron (Fig. 14D and Supplemental Fig. S2). This sequential transformation occurred because the reduction of drive to early-I reduces its excitability. In addition to external drive, this adaptive neuron receives excitatory synaptic input from the pre-I neuron and inhibitory synaptic input from the aug-E neuron. With low drive and relatively weak excitation from pre-I, the early-I neuron can switch to the active state only after a significant recovery from adaptation (reduction of mAD2) that occurs during the expiratory periods. With progressively reduced drive, this recovery needs increasingly more cycles to accumulate sufficiently to allow the early-I cell to activate. Finally, the early-I neuron can no longer become active and the network starts generating pure one-phase oscillations.
DISCUSSION
We have constructed a simplified model of the respiratory CPG and analyzed its behavior to gain insight into the dynamic interactions of different neuronal elements that are considered to be the basic network substrates for rhythm and pattern generation in a variety of states. The four-neuron model considered here (Fig. 1B) represents a simplified version of the core model of the brain stem respiratory CPG proposed in previous modeling studies (Smith et al. 2007). The reduced model robustly reproduced the three major dynamic regimes observed in previous experimental studies and more complicated models (Rybak et al. 2007; Smith et al. 2007), supporting the idea that the proposed architecture and drive structure are conceptually reasonable. In contrast to earlier models, which were based on interacting populations of neurons described in the Hodgkin–Huxley style, the simplified model formulation used here allowed application of bifurcation methods and fast–slow decomposition to analyze the behavior of the model under different conditions. This approach facilitated analysis of mechanisms controlling phase durations, oscillation period, transitions between phases within rhythms (including contributions of escape and release; Skinner et al. 1994), and transitions between rhythmic states. As discovered in the experimental studies with a series of brain stem transections, the removal of pontine drive, which we assigned as one of the main drives in the model, converted the initial bio three-phase oscillations (Fig. 2A) to two-phase oscillations lacking the postinspiratory phase (Fig. 6A). A subsequent removal of inhibition from BötC expiratory neurons associated with a postulated removal of tonic drive from RTN converted the two-phase oscillations to one-phase inspiratory oscillations (Fig. 9A).
Our analyses led to mathematical representations of three functional states in the model, corresponding to the three-, two-, and one-phase oscillatory regimes, in terms of collections of slow excursions along equilibrium surfaces of the neurons’ voltage dynamics interspersed with fast jumps between these surfaces (Figs. 2B and 12). Changes in these structures underlie the changes in rhythms that result from variation of drives and our findings, in particular, suggest that regimes exhibiting late-E or biphasic-E activity may be features of this network that arise naturally within gradual transitions between states. Neural ring structures with mutual inhibition were intensively studied in earlier works (e.g., see Matsuoka 1987; Morishita and Yajima 1972). The representations of functional states presented here are reminiscent of heteroclinic cycles arising, for example, in winnerless competition models (Rabinovich et al. 2001). However, previous exploration of such cycles in winnerless competition has not involved excursions along surfaces featuring slow dynamics (i.e., slow manifolds) and associated issues of identifying bifurcation curves at which jumps away from these surfaces occur. Our identification of such surfaces and bifurcation curves, in the context of a model with four fast and four slow variables, is a novel computational aspect of this work that may prove useful in future studies of models with multiple slowly evolving variables.
In the present model, both the three-phase and two-phase oscillations in the respiratory network are not abolished with the suppression of persistent sodium current (Figs. 5 and 8), unlike the one-phase oscillations, which are critically dependent on INaP dynamics in the pre-BötC (Fig. 10), which is fully consistent with the results of experimental studies using in situ perfused rat preparations (Rybak et al. 2007; Smith et al. 2007). Moreover, our model was able to closely reproduce the alterations in oscillation period resulting from gradual suppression of INaP in these three regimes (Figs. 5, 8, and 10) that were demonstrated in the preceding in situ studies with increases in riluzole concentration (see Fig. 2, A1–C1 in Rybak et al. 2007; and Fig. 6 in Smith et al. 2007).
We need to note, however, that recent studies of the role of INaP for the generation of bursting rhythmic activity in the pre-BötC in vitro have produced inconsistent results. Some studies reported that bursting rhythmic activity in the pre-BötC slices was abolished by riluzole (Koizumi and Smith 2008; Rybak et al. 2003b) and others failed to demonstrate this effect and concluded that INaP might not be necessary for the generation of rhythmic bursting in the pre-BötC in vitro (Del Negro et al. 2002; Pace et al. 2007b). This contradiction requires further investigation and a careful analysis of possible differences in experimental methods and preparations used (for review, see Koizumi and Smith 2008). In addition, several recent studies have suggested that the generation of rhythmic bursting activity in the pre-BötC in vitro involves Ca2+-activated nonspecific cation current (ICAN), which could be synaptically activated by metabotropic glutamate receptors causing intracellular Ca2+ release from internal stores (Pace and Del Negro 2008; Pace et al. 2007a; Rubin et al. 2009). It is very likely that this intrinsic mechanism indeed operates (together with INaP-based mechanisms) and contributes to the intrinsic bursting activity in the pre-BötC in vitro as well as in reduced pre-BötC preparations [e.g., after removing more rostral brain stem compartments as in studies of Rybak et al. (2007) and Smith et al. (2007)]. Fundamental testing of this suggestion has not been performed in more intact preparations and thus the ICAN-based mechanism was not considered in the preceding models of Rybak et al. and Smith et al. or in the model described here. It is important to note, however, that the ICAN-based mechanism can contribute only to the initial activation (onset) of the inspiratory burst and cannot explain burst termination and interburst recovery without invoking additional mechanisms, such as activation of Na+/K+ pump current, activation of Ca2+- or Na+-activated potassium current, or other processes. Identifying the currently unknown burst termination and recovery mechanisms, and how these interact with other cellular mechanisms, will be critical to achieving a complete understanding of rhythmic bursting activity in the pre-BötC in vitro.
Regardless of which intrinsic or cellular burst termination mechanisms operate in vitro and/or in highly reduced preparations in situ, it is unlikely that these mechanisms provide termination of inspiratory bursts in more intact preparations or under normal conditions in vivo. As shown in many earlier studies, the termination of inspiratory bursts in vivo involves network interactions (providing the so-called inspiratory off-switch; reviewed by Bianchi et al. 1995; Cohen 1979; Richter 1996) and is controlled by both inputs from the rostral pons and afferent feedback from the lungs (Hering–Breuer reflex). Indeed, a removal of both of these drives converts the normal respiratory pattern to apneusis, which is characterized by significantly prolonged (up to several seconds) inspiratory activity (Cohen 1979; Lumsden 1923; Morrison et al. 1994; St.-John 1998). Consistent with these results, the generation of both three-phase and two-phase oscillations in our model relies on network interactions that are independent of the intrinsic bursting mechanism operating in the pre-BötC. Therefore we believe that, although intrinsic cellular mechanisms involving INaP (considered in our model) or ICAN (not considered here) may be important for the control of oscillation period and phase durations, they are not critical for the generation of respiratory oscillations in vivo or in more intact preparations in situ.
Control of phase durations and oscillation period: new insights
One important issue in the neural control of breathing, which has not been so far analyzed in detail at the network level, is the control of breathing period. As mentioned in the introduction, the operation of circuits within the ventral respiratory column is controlled by inputs and drives from various structures in the medulla (such as RTN and raphé) and pons. An important part of this study is the investigation of how drives to particular network elements could affect the oscillation period and respiratory phase durations. Specifically, we demonstrate that the period of oscillations in the intact model (generating the three-phase breathing pattern) may be reduced by more than fourfold by increasing drive to the pre-I excitatory neuron and more than twofold by increasing drive to the early-I inhibitory neuron (Fig. 3, A and B). Both of these neuron types are postulated to be located in the pre-BötC (see Fig. 1), as indicated by early electrophysiological recordings in vivo (e.g., Schwarzacher et al. 1995) and more recent studies demonstrating substantial populations of inhibitory (Hulsmann et al. 2007; Kuwana et al. 2006) and excitatory (Koshiya and Smith 1999; Rekling et al. 2000; Stornetta et al. 2003) neurons in the pre-BötC. Our results suggest that both excitatory and inhibitory neuron populations in the pre-BötC represent important nodes for period control and point to the basic role of the pre-BötC in period control through multiple mechanisms. Alternatively, the period could be prolonged by 2.5-fold with the increase of drive to aug-E neurons of BötC (see Fig. 3D). Drives to the pre-I and aug-E can also dramatically change (decrease or increase, respectively) the period of the two-phase oscillation regime (Fig. 7, A and C). The specific distribution of excitatory drives from various potential sources in the medulla (e.g., RTN, raphé) and pons to different types of respiratory neurons and how these drives change with metabolic conditions (e.g., levels of CO2, O2, pH) remain largely unknown and require further investigations. Our modeling results may provide useful predictions and initial guidance for such studies.
In general our results indicate how distinct populations of inspiratory and expiratory neurons represent fundamental nodes that may be targeted by external drives for control of period and phase durations. The significant changes in the oscillation period following changes in drives to particular neurons demonstrated by our model are not typical for classical half-center models (Matsuoka 1987; Skinner et al. 1993, 1994). Mathematically, the various effects on period observed relate in part to the asymmetry between decrementing and augmenting activity patterns seen in different cells. Transitions between phases in the model occur via combinations of adaptation, which leads to release from inhibition, and recovery from adaptation (or deinactivation of the pre-I cell), which yields escape (Skinner et al. 1994). Indeed, an important attribute of our reduced, activity-based model is that it allows changes in respiratory phase durations and oscillation periods with variation in drives to be linked mathematically to the different balances of release and escape from inhibition present in different parameter regimes and to the impact of adaptation that together underlie the transitions between inspiration and expiration. Related issues have been considered recently in the context of binocular rivalry (Curtu et al. 2008; Shpiro et al. 2007) and digestive (Kintos et al. 2008) and locomotor (Daun et al. 2009) CPG operation.
The changes in oscillation period that we have found depend on the contribution of INaP dynamics. Indeed, as we describe in results, the significant changes in T and TE with changing drives to pre-I and aug-E neurons demonstrated in our model are based on the essential involvement of the kinetics of INaP inactivation in the pre-I neuron (hNaP). Therefore although the three-phase and two-phase oscillations can persist with full blockade of INaP, this current nonetheless plays a role in the control of oscillation period in both the intact and two-phase oscillation states (see also Daun et al. 2009).
Control of oscillatory state by external drives
In the preceding experimental and modeling studies, extreme manipulations (transections) were used to uncover the possible states of the system and rhythmogenic mechanisms engaged in each state (Fig. 1). Such extreme changes, however, generally do not occur in physiological conditions. Nonetheless, system states similar to those uncovered by transections may occur as a result of alterations of external drives and/or their balances. As described in the introduction, some of these drives originate in multiple brain stem regions, some of which are proposed to be involved in central chemoreception, such as RTN and raphé, or receive inputs from peripheral chemoreceptors and are thus dependent on the metabolic state of the system. Therefore changes in the metabolic conditions, such as levels of CO2, pH, or O2, may alter the balance between the various drives, change interactions between the key respiratory neuron types, and finally produce transformations to the two- or one-phase oscillation states investigated in this study. In particular, it was shown that hypocapnia (a reduced level of CO2) can convert the initial three-phase pattern to a two-phase pattern (Abdala et al. 2007a; Sun et al. 2001) similar to that obtained after the pontine transection. Severe hypoxia (an extreme reduction of the O2 level) can switch the system to a gasping state driven by one-phase oscillations (Paton et al. 2006) similar to those obtained by transections at the rostral border of pre-BötC. In contrast to the intact rhythm, and similar to the one-phase rhythm described here, this gasping rhythm could be abolished by the INaP blocker riluzole (Paton et al. 2006). In this context, our reduced model offered the opportunity to investigate the important issue of how transitions between the above-cited regimes may occur through gradual changes of particular drives, without dramatic perturbations like transections.
Our modeling results show that a gradual reduction of the drive to the post-I neuron can produce the transition from three-phase to two-phase oscillations (Fig. 11 and Supplemental Fig. S1A). This transformation may occur because of the reduction of the pontine drive to post-I neurons in the BötC and/or because of lowering the level of CO2 during hypocapnia (Abdala et al. 2007a; Sun et al. 2001; APL Abdala, IA Rybak, JC Smith, and JFR Paton, unpublished observations). These observations suggest that post-I neurons may be the neurons most sensitive to pontine input (Dutschmann and Herbert 2006; Rybak et al. 2004a) and to the lowering of chemosensitive drive with a reduction of CO2 level in the system. Our results also predict that a change in the aug-E firing pattern, from augmenting to decrementing, may occur with the switch from three- to two-phase oscillations.
It is important to notice that the “biological” (bio) three-phase respiratory pattern, generated by our basic model and representing operation of the respiratory CPG under normal conditions, is actually not a three-phase pattern from a mathematical perspective, based on the number of phase switches involved (two) and the corresponding lack of possibility for independent control of postinspiratory and expiratory phase durations (see Figs. 2, B and C and 13, A1 and A2). The terminology accepted in respiration physiology follows the three-phase theory of respiratory rhythm generation (Richter 1982, 1996), which distinguishes the two expiratory phases (postinspiration and stage 2, or active expiration) because of specific physiological processes associated with each of these phases (see introduction). This bio three-phase pattern may in fact be a two-phase pattern in a mathematical sense. At the same time, we show that under some conditions, such as a reduced drive to post-I neuron (Fig. 11C and Supplemental Fig. S1A) or an increased drive to aug-E (Supplemental Fig. S1B), the generated pattern may be converted to a “mathematical” (math) three-phase rhythm with three phase switches and a “mathematically” separate late-E phase of activity not expressed in the basic model (Figs. 11, 12, and 13, B1 and B2). From a mathematical perspective, the math three-phase regime appears to be an inevitable consequence of the sequence of bifurcations needed to transition from the bio three-phase to the two-phase state. We suggest that the resultant pattern may represent an additional, specific state of the system, featuring augmented late-E or biphasic-E expiratory activity (Fig. 11 and Supplemental Fig. S1, A and B).
Feldman and collaborators (Feldman and Del Negro 2006; Janczewski and Feldman 2006) recently proposed that an independent “expiratory generator” located in the pFRG couples with the inspiratory generator in the pre-BötC and produces an enhanced expiratory (late-E or biphasic-E) activity in the abdominal muscles. Interaction between independent pFRG and pre-BötC oscillators have been recently modeled by Wittmeier et al. (2008). The conditions for activation of this expiratory generator have not been well defined and the pFRG was not included in our current model. At the same time, Fortuna et al. (2008) failed to find rhythmically active biphasic-E neurons in the RTN in the anesthetized adult rat under normal conditions in vivo. Instead, they found that certain augmenting expiratory cells (aug-E) in BötC transformed to a biphasic-E firing pattern during hypercapnic hypoxia. Interestingly, our results show that an increased drive to the BötC aug-E neuron and a reduced drive to the BötC post-I neuron (Supplemental Fig. S1, A and B) can produce late-E and biphasic-E activities. Although it may be premature to explicitly relate our simulation results to experimental data demonstrating an expressed late-E or biphasic-E expiratory activity under certain conditions (Abdala et al. 2007b; Feldman and Del Negro 2006; Fortuna et al. 2008; Janczewski and Feldman 2006; Abdala et al., unpublished observations), a preliminary prediction of our study would be that an increase of RTN drive during hypercapnia (with the increase of CO2 level) should impose a more significant excitatory effect on aug-E neurons than that on post-I neurons.
The transition from the two-phase respiratory oscillation to the INaP-dependent one-phase inspiratory rhythm was produced in the model by a progressive reduction of drive to the inhibitory early-I neuron (Fig. 14 and Supplemental Fig. S2). This transformation went through intermediate stages of mixed-mode oscillations with progressively increasing number of ectopic, INaP-dependent inspiratory bursts emerging between each two consecutive network-generated bursts. This behavior was fully consistent with the preceding experimental studies in which more caudal transections (reducing the remaining part of RTN and thus the RTN drive) caused the emergence and increased the number of INaP-dependent ectopic bursts interposed between regular square-wave bursts (Smith et al. 2007).
In summary, our results bolster the conclusion that the neural organization in the respiratory CPG supports multiple rhythmogenic mechanisms (Smith et al. 2007). This CPG appears to contain multiple functionally embedded oscillatory loops and intrinsic neural oscillators with rhythmogenic mechanisms ranging from (primarily) inhibitory network-based interactions, resembling classical half-center type structures, to conductance-based endogenous rhythmic mechanisms. We suggest that the expression of the different oscillatory mechanisms inherent in this system depends on the metabolic and functional state of the system and is controlled by multiple sources of drives located within the medulla and pons, some of which are sensitive to the levels of CO2, O2, and pH (e.g., RTN, raphé) and some of which are controlled by multiple descending systems (pons, NTS). The ringlike architecture with an embedded excitatory kernel, and the asymmetrical dynamic interactions within the network, provide multiple nodes for control of oscillation period and phase durations as well as for controlling the mode of rhythmic pattern generation by the external drives. We therefore propose that these drives may have a specially organized mapping on the network, which enables the generation of highly stable but flexible breathing patterns that can adaptively respond to various changes in internal (physiological and metabolic) and external conditions. We have offered theoretical predictions of how various drives map onto the network and control its behavior. Further experimental investigations are now required to more precisely define the connection patterns of drives and to test the new hypotheses proposed by our model.
GRANTS
This study was supported by National Science Foundation (NSF) Division of Mathematical Sciences grants to J. E. Rubin and G. B. Ermentrout, the NSF/National Institutes of Health Collaborative Research in Computational Neuroscience Program, National Institute of Neurological Disorders and Stroke (NINDS) Grant R01 NS-057815 to I. A. Rybak, N. A. Shevtsova, and J. C. Smith, and by the NINDS Intramural Research Program to J. C. Smith.
Supplementary Material
The costs of publication of this article were defrayed in part by the payment of page charges. The article must therefore be hereby marked “advertisement” in accordance with 18 U.S.C. Section 1734 solely to indicate this fact.
Footnotes
The online version of this article contains supplemental data.
REFERENCES
- Abdala et al. 2007a.Abdala APL, Koizumi H, Rybak IA, Smith JC, Paton JFR. The 3-2-1 state respiratory rhythm generator hypothesis revealed by microsectioning, reduced extracellular chloride and alterations in arterial gas tensions in the in situ rat. Exp Biol Abstr 610.4, 2007a.
- Abdala et al. 2007b.Abdala APL, Rybak IA, Smith JC, Paton JFR. Brainstem origins and mechanisms of abdominal expiratory activity in the rat in situ. Soc Neurosci Abstr 627.1, 2007b.
- Balis et al. 1994.Balis UJ, Morris KF, Koleski J, Lindsey BG. Simulations of a ventrolateral medullary neural network for respiratory rhythmogenesis inferred spike train cross-correlation. Biol Cybern 70: 311–327, 1994. [DOI] [PubMed] [Google Scholar]
- Bianchi et al. 1995.Bianchi AL, Denavit-Saubie M, Champagnat J. Central control of breathing in mammals: neuronal circuitry, membrane properties, and neurotransmitters. Physiol Rev 75: 1–45, 1995. [DOI] [PubMed] [Google Scholar]
- Botros and Bruce 1990.Botros SM, Bruce EN. Neural network implementation of the three-phase model of respiratory rhythm generation. Biol Cybern 63: 143–153, 1990. [DOI] [PubMed] [Google Scholar]
- Butera and Rinzel 1999a.Butera RJ, Rinzel JR, Smith JC. Models of respiratory rhythm generation in the pre-Bötzinger complex. I. Bursting pacemaker neurons. J Neurophysiol 82: 382–397, 1999a. [DOI] [PubMed] [Google Scholar]
- Butera et al. 1999b.Butera RJ, Rinzel JR, Smith JC. Models of respiratory rhythm generation in the pre-Bötzinger complex. II. Populations of coupled pacemaker neurons. J Neurophysiol 82: 398–415, 1999b. [DOI] [PubMed] [Google Scholar]
- Cohen 1979.Cohen MI Neurogenesis of respiratory rhythm in the mammal. Physiol Rev 59: 1105–1173, 1979. [DOI] [PubMed] [Google Scholar]
- Curtu et al. 2008.Curtu R, Shpiro A, Rubin N, Rinzel J. Mechanisms for frequency control in neuronal competition models. SIAM J Appl Dyn Syst 7: 609–649, 2008. [DOI] [PMC free article] [PubMed] [Google Scholar]
- Daun et al. 2009.Daun S, Rubin JE, Rybak IA. Control of oscillation periods and phase durations in half-center central pattern generators: a comparative mechanistic analysis. J Comput Neurosci (January 6, 2009). [Epub ahead of print]. [DOI] [PMC free article] [PubMed]
- Del Negro et al. 2002.Del Negro CA, Morgado-Valle C, Feldman JL. Respiratory rhythm: an emergent network property? Neuron 34: 821–830, 2002. [DOI] [PubMed] [Google Scholar]
- Duffin 1991.Duffin J A model of respiratory rhythm generation. Neuroreport 2: 623–626, 1991. [DOI] [PubMed] [Google Scholar]
- Duffin et al. 1995.Duffin J, Ezure K, Lipski J. Breathing rhythm generation: focus on the rostral ventrolateral medulla. News Physiol Sci 10: 133–140, 1995. [Google Scholar]
- Duffin et al. 2000.Duffin J, Tian G, Peever J. Functional synaptic connections among respiratory neurons. Respir Physiol 122: 237–246, 2000. [DOI] [PubMed] [Google Scholar]
- Dutschmann and Herbert 2006.Dutschmann M, Herbert H. The Kölliker–Fuse nucleus gates the postinspiratory phase of the respiratory cycle to control inspiratory off-switch and upper airway resistance in rat. Eur J Neurosci 24: 1071–1084, 2006. [DOI] [PubMed] [Google Scholar]
- Ermentrout 1994.Ermentrout B Reduction of conductance based models with slow synapses to neural nets. Neural Comp 6: 679–695, 1994. [Google Scholar]
- Ermentrout 2002.Ermentrout B Simulating, Analyzing, and Animating Dynamical Systems. Philadelphia, PA: Society for Industrial and Applied Mathematics, 2002.
- Ezure 1990.Ezure K Synaptic connections between medullary respiratory neurons and consideration on the genesis of respiratory rhythm. Prog Neurobiol 35: 429–450, 1990. [DOI] [PubMed] [Google Scholar]
- Ezure et al. 2003.Ezure K, Tanaka I, Kondo M. Glycine is used as a transmitter by decrementing expiratory neurons of the ventrolateral medulla in the rat. J Neurosci 23: 8941–8948, 2003. [DOI] [PMC free article] [PubMed] [Google Scholar]
- Ezure et al. 2003.Ezure K, Tanaka I, Saito Y. Brainstem and spinal projections of augmenting expiratory neurons in the rat. Neurosci Res 45: 41–51, 2003. [DOI] [PubMed] [Google Scholar]
- Fedorko et al. 1989.Fedorko LJ, Duffin J, England S. Inhibition of inspiratory neurons of the nucleus retroambigualis by expiratory neurons of the Bötzinger complex. Exp Neurol 106: 74–77, 1989. [DOI] [PubMed] [Google Scholar]
- Feldman and Del Negro 2006.Feldman JL, Del Negro CA. Looking for inspiration: new perspectives on respiratory rhythm. Nat Rev Neurosci 7: 232–241, 2006. [DOI] [PMC free article] [PubMed] [Google Scholar]
- Fortuna et al. 2008.Fortuna MG, West GH, Stornetta RL, Guyenet PG. Bötzinger expiratory-augmenting neurons and the parafacial respiratory group. J Neurosci 28: 2506–2515, 2008. [DOI] [PMC free article] [PubMed] [Google Scholar]
- Gottschalk et al. 1994.Gottschalk A, Ogilvie MD, Richter DW, Pack AI. Computational aspects of the respiratory pattern generator. Neural Comput 6: 56–68, 1994. [Google Scholar]
- Grillner 2006.Grillner S Biological pattern generation: the cellular and computational logic of networks in motion. Neuron 52: 751–766, 2006. [DOI] [PubMed] [Google Scholar]
- Hulsmann et al. 2007.Hulsmann S, Hirrlinger J, Winter SM. Multiphoton imaging of rhythmic neurons of the mouse respiratory network. Soc Neurosci Abstr 340.2, 2007.
- Janczewski and Feldman 2006.Janczewski WA, Feldman JL. Distinct rhythm generators for inspiration and expiration in the juvenile rat. J Physiol 570: 407–420, 2006. [DOI] [PMC free article] [PubMed] [Google Scholar]
- Jiang and Lipski 1990.Jiang C, Lipski J. Extensive monosynaptic inhibition of ventral respiratory group neurons by augmenting neurons in the Bötzinger complex in the cat. Exp Brain Res 81: 639–648, 1990. [DOI] [PubMed] [Google Scholar]
- Johnson et al. 2001.Johnson SM, Koshiya N, Smith JC. Isolation of the kernel for respiratory rhythm generation in a novel preparation: the pre-Bötzinger complex “island.” J Neurophysiol 85: 1772–1776, 2001. [DOI] [PubMed] [Google Scholar]
- Kintos et al. 2008.Kintos N, Nusbaum MP, Nadim F. A modeling comparison of projection neuron- and neuromodulator-elicited oscillations in a central pattern generating network. J Comput Neurosci 24: 374–397, 2008. [DOI] [PMC free article] [PubMed] [Google Scholar]
- Koizumi and Smith 2008.Koizumi H, Smith JC. Persistent Na+- and K+-dominated leak currents contribute to respiratory rhythm generation in the pre-Bötzinger complex in vitro. J Neurosci 28: 1773–1785, 2008. [DOI] [PMC free article] [PubMed] [Google Scholar]
- Koshiya and Smith 1999.Koshiya N, Smith JC. Neuronal pacemaker for breathing visualized in vitro. Nature 400: 360–363, 1999. [DOI] [PubMed] [Google Scholar]
- Kuwana et al. 2006.Kuwana S, Tsunekawa N, Yanagawa Y, Okada Y, Kuribayashi J, Obata K. Electrophysiological and morphological characteristics of GABAergic respiratory neurons in the mouse pre-Bötzinger complex. Eur J Neurosci 23: 667–674, 2006. [DOI] [PubMed] [Google Scholar]
- Lindsey et al. 1987.Lindsey BG, Segers LS, Shannon R. Functional associations among simultaneously monitored lateral medullary respiratory neurons in the cat. II. Evidence for inhibitory actions of expiratory neurons. J Neurophysiol 57: 1101–1117, 1987. [DOI] [PubMed] [Google Scholar]
- Lumsden 1923.Lumsden T Observations on the respiratory centers in the cat. J Physiol 57: 153–160, 1923. [DOI] [PMC free article] [PubMed] [Google Scholar]
- Marder and Bucher 2001.Marder E, Bucher D. Central pattern generators and the control of rhythmic movements (Review). Curr Biol 11: R986–R996, 2001. [DOI] [PubMed] [Google Scholar]
- Matsuoka 1987.Matsuoka K Mechanisms of frequency and pattern control in the neural rhythm generators. Biol Cybern 56: 345–353, 1987. [DOI] [PubMed] [Google Scholar]
- Mironov 2008.Mironov SL Metabotropic glutamate receptors activate dendritic calcium waves and TRPM channels which drive rhythmic respiratory patterns in mice. J Physiol 586: 2277–2291, 2008. [DOI] [PMC free article] [PubMed] [Google Scholar]
- Morishita and Yajima 1972.Morishita I, Yajima A. Analysis and simulation of networks of mutually inhibiting neurons. Kybernetik l 1: 154–165, 1972. [DOI] [PubMed] [Google Scholar]
- Morrison et al. 1994.Morrison SF, Cravo SL, Wilfehrt HM. Ponite lesions produce apneusis in the rat. Brain Res 652: 83–86, 1994. [DOI] [PubMed] [Google Scholar]
- Ogilvie et al. 1992.Ogilvie MD, Gottschalk A, Anders K, Richter DW, Pack AI. A network model of respiratory rhythmogenesis. Am J Physiol Regul Integr Comp Physiol 263: R962–R975, 1992. [DOI] [PubMed] [Google Scholar]
- Pace et al. 2008.Pace RW, Del Negro CA. AMPA and metabotropic glutamate receptors cooperatively generate inspiratory-like depolarization in mouse respiratory neurons in vitro. Eur J Neurosci 28: 2434–2442, 2008. [DOI] [PubMed] [Google Scholar]
- Pace et al. 2007a.Pace RW, Mackay DD, Feldman JL, Del Negro CA. Inspiratory bursts in the pre-Bötzinger complex depend on a calcium-activated non-specific cation current linked to glutamate receptors in neonatal mice. J Physiol 582: 113–125, 2007a. [DOI] [PMC free article] [PubMed] [Google Scholar]
- Pace et al. 2007b.Pace RW, Mackay DD, Feldman JL, Del Negro CA. Role of persistent sodium current in mouse pre-Bötzinger complex neurons and respiratory rhythm generation. J Physiol 580: 485–496, 2007b. [DOI] [PMC free article] [PubMed] [Google Scholar]
- Paton 1996.Paton JFR A working heart-brainstem preparation of the mouse. J Neurosci Methods 65: 63–68, 1996. [DOI] [PubMed] [Google Scholar]
- Paton et al. 2006.Paton JFR, Abdala APL, Koizumi H, Smith JC, St-John WM. Respiratory rhythm generation during gasping depends on persistent sodium current. Nat Neurosci 9: 311–313, 2006. [DOI] [PubMed] [Google Scholar]
- Paton and Dutschmann 2002.Paton JFR, Dutschmann M. Central control of upper airway resistance regulating respiratory airflow in mammals. J Anat 201: 319–323, 2002. . [DOI] [PMC free article] [PubMed] [Google Scholar]
- Rabinovich et al. 2001.Rabinovich M, Volkovskii A, Lecanda P, Huerta R, Abarbanel HDI, Laurent G. Dynamical encoding by networks of competing neuron groups: winnerless competition. Phys Rev Lett 87: 068102, 2001. [DOI] [PubMed] [Google Scholar]
- Rekling et al. 2000.Rekling JC, Shao XM, Feldman JL. Electrical coupling and excitatory synaptic transmission between rhythmogenic respiratory neurons in the pre-Bötzinger complex. J Neurosci 20: RC113, 2000. [DOI] [PMC free article] [PubMed] [Google Scholar]
- Richter 1982.Richter DW Generation and maintenance of the respiratory rhythm. J Exp Biol 100: 93–107, 1982. [DOI] [PubMed] [Google Scholar]
- Richter 1996.Richter DW Neural regulation of respiration: rhythmogenesis and afferent control. In: Comprehensive Human Physiology, edited by Gregor R, Windhorst U. Berlin: Springer-Verlag, 1996, vol. II, p. 2079–2095. [Google Scholar]
- Rubin et al. 2009.Rubin JE, Hayes JA, Mendenhall JL, Del Negro CA. Calcium-activated nonspecific cation current and synaptic depression promote network-dependent burst oscillations. Proc Natl Acad Sci USA (February 5, 2009) 10.1073/pnas.0808776106. [DOI] [PMC free article] [PubMed]
- Rybak et al. 2007.Rybak IA, Abdala APL, Markin SN, Paton JFR, Smith JC. Spatial organization and state-dependent mechanisms for respiratory rhythm and pattern generation. Prog Brain Res 165: 201–220, 2007. [DOI] [PMC free article] [PubMed] [Google Scholar]
- Rybak et al. 1997.Rybak IA, Paton JFR, Schwaber JS. Modeling neural mechanisms for genesis of respiratory rhythm and pattern. I. Models of respiratory neurons. J Neurophysiol 77: 1994–2006, 1997. [DOI] [PubMed] [Google Scholar]
- Rybak et al. 2003a.Rybak IA, Ptak K, Shevtsova NA, McCrimmon DR. Sodium currents in neurons from the rostroventrolateral medulla of the rat. J Neurophysiol 90: 1635–1642, 2003a. [DOI] [PubMed] [Google Scholar]
- Rybak et al. 2004a.Rybak IA, Shevtsova NA, Paton JFR, Dick TE, St.-John WM, Mörschel M, Dutschmann M. Modeling the ponto-medullary respiratory network. Respir Physiol Neurobiol 143: 307–319, 2004a. [DOI] [PubMed] [Google Scholar]
- Rybak et al. 2004b.Rybak IA, Shevtsova NA, Ptak K, McCrimmon DR. Intrinsic bursting activity in the pre-Bötzinger complex: role of persistent sodium and potassium currents. Biol Cybern 90: 59–74, 2004b. [DOI] [PubMed] [Google Scholar]
- Rybak et al. 2003b.Rybak IA, Shevtsova NA, St.-John WM, Paton JFR, Pierrefiche O. Endogenous rhythm generation in the pre-Bötzinger complex and ionic currents: modelling and in vitro studies. Eur J Neurosci 18: 239–257, 2003b. [DOI] [PubMed] [Google Scholar]
- Schwarzacher et al. 1995.Schwarzacher S, Smith JC, Richter DW. The pre-Bötzinger complex in the cat. J Neurophysiol 73: 1452–1461, 1995. [DOI] [PubMed] [Google Scholar]
- Segers et al. 1987.Segers LS, Shannon R, Saporta S, Lindsey BG. Functional associations among simultaneously monitored lateral medullary respiratory neurons in the cat. I. Evidence for excitatory and inhibitory connections of inspiratory neurons. J Neurophysiol 57: 1078–1100, 1987. [DOI] [PubMed] [Google Scholar]
- Shen et al. 2003.Shen L, Li YM, Duffin J. Inhibitory connections among rostral medullary expiratory neurones detected with cross-correlation in the decerebrate rat. Pflügers Arch 446: 365–372, 2003. [DOI] [PubMed] [Google Scholar]
- Shpiro et al. 2007.Shpiro A, Curtu R, Rinzel J, Rubin N. Dynamical characteristics common to neuronal competition models. J Neurophysiol 97: 462–473, 2007. [DOI] [PMC free article] [PubMed] [Google Scholar]
- Skinner et al. 1994.Skinner FK, Kopell N, Marder E. Mechanisms for oscillation and frequency control in reciprocal inhibitory model neural networks. J Comput Neurosci 1: 69–87, 1994. [DOI] [PubMed] [Google Scholar]
- Skinner et al. 1993.Skinner FK, Turrigiano GG, Marder E. Frequency and burst duration in oscillating neurons and two-cell networks. Biol Cybern 69: 375–383, 1993. [PubMed] [Google Scholar]
- Smith et al. 2007.Smith JC, Abdala APL, Koizumi H, Rybak IA, Paton JFR. Spatial and functional architecture of the mammalian brainstem respiratory network: a hierarchy of three oscillatory mechanisms. J Neurophysiol 98: 3370–3387, 2007. [DOI] [PMC free article] [PubMed] [Google Scholar]
- Smith et al. 2000.Smith JC, Butera RJ, Koshiya N, Del Negro C, Wilson CG, Johnson SM. Respiratory rhythm generation in neonatal and adult mammals: the hybrid pacemaker-network model. Respir Physiol Neurobiol 122: 131–147, 2000. [DOI] [PubMed] [Google Scholar]
- Smith et al. 1991.Smith JC, Ellenberger H, Ballanyi K, Richter DW, Feldman JL. Pre-Bötzinger complex: a brain stem region that may generate respiratory rhythm in mammals. Science 254: 726–729, 1991. [DOI] [PMC free article] [PubMed] [Google Scholar]
- St.-John 1998.St.-John WM Neurogenesis of patterns of automatic ventilatory activity. Prog Neurobiol 56: 97–117, 1998. [DOI] [PubMed] [Google Scholar]
- Stornetta et al. 2003.Stornetta RL, Rosin DL, Wand H, Sevigny CP, Weston MC, Guyenet PG. A group of glutamatergic interneurons expressing high levels of both neurokinin-1 receptors and somatostatin identifies the region of the pre-Bötzinger complex. J Comp Neurol 455: 499–512, 2003. [DOI] [PubMed] [Google Scholar]
- Sun et al. 2001.Sun Q-J, Goodchild AK, Pilowsky PM. Firing patterns of pre-Bötzinger and Bötzinger neurons during hypocapnia in the adult rat. Brain Res 903: 198–206, 2001. [DOI] [PubMed] [Google Scholar]
- Tian et al. 1999.Tian GF, Peever JH, Duffin J. Bötzinger-complex, bulbospinal expiratory neurones monosynaptically inhibit ventral-group respiratory neurones in the decerebrate rat. Exp Brain Res 124: 173–180, 1999. [DOI] [PubMed] [Google Scholar]
- Wittmeier et al. 2008.Wittmeier S, Song G, Duffin J, Poon CS. Pacemakers handshake synchronization mechanism of mammalian respiratory rhythmogenesis. Proc Natl Acad Sci USA 105: 18000–18005, 2008. [DOI] [PMC free article] [PubMed] [Google Scholar]
Associated Data
This section collects any data citations, data availability statements, or supplementary materials included in this article.