Abstract
The amygdala plays a crucial role in evaluating the emotional significance of stimuli and in transforming the results of this evaluation into appropriate autonomic responses. Lesion and stimulation studies suggest involvement of the amygdala in the generation of the skin conductance response (SCR), which is an indirect measure of autonomic activity that has been associated with both emotion and attention. It is unclear if this involvement marks an emotional reaction to an external stimulus or sympathetic arousal regardless of its origin. We recorded skin conductance in parallel with single-unit activity from the right amygdala of two rhesus monkeys during a rewarded image viewing task and while the monkeys sat alone in a dimly lit room, drifting in and out of sleep. In both experimental conditions, we found similar SCR-related modulation of activity at the single-unit and neural population level. This suggests that the amygdala contributes to the production or modulation of SCRs regardless of the source of sympathetic arousal.
INTRODUCTION
The skin conductance response (SCR) is an indirect measure of sympathetic autonomic activity that is associated with both emotion and attention. In humans, the amplitude of SCRs is related to the level of arousal elicited by visual stimuli with either positive or negative emotional valence (Bradley et al. 2001). The amygdala is known to play a crucial role in the evaluation of emotionally relevant stimuli and in the subsequent initiation of appropriate autonomic responses (for a review, see Davis and Whalen 2001). Studies involving electrical stimulation and lesions of the amygdala suggest that the structure exerts an excitatory influence on SCR generation and amplitude (Lang et al. 1964; Bagshaw and Benzies 1968; Bagshaw and Cappock 1968; Bagshaw and Pribram 1968 Bagshaw et al. 1965; Mangina and Beuzeron-Mangina 1996), though damage to the amygdala does not lead to the elimination of all SCRs (Tranel and Damasio 1989). Additionally, functional imaging studies have shown a correlation between BOLD signal in the amygdala and SCR amplitude and occurrence under conditions of emotional image presentation (Hoffman et al. 2007; Liberzon et al. 2000; Williams et al. 2001).
Emotional arousal, however, is only one of many triggers that can evoke SCRs. Various aspects of SCRs have been correlated with movements directed toward rewarded targets (Amiez et al. 2003), flashes of light, complex auditory stimuli (Yamazaki et al. 1972), cognitive tasks (Nikula 1991), general mental state (Critchley 2002), and simply opening the eyes (Bagshaw et al. 1965). The amygdala has also been studied outside of the context of emotion, specifically in the regulation of attention (Davis and Whalen 2001; Gallagher and Holland 1994). Although involvement of the amygdala in the production of fear-conditioned SCRs is well established, significant blood-oxygen-level-dependent (BOLD) responses within the amygdala do not accompany nonspecific, unconditioned, or orienting SCRs (Knight et al. 2005). Damage to the amygdala, however, can eliminate production of SCRs to a wide variety of unconditioned, nonemotional stimuli (Asahina et al. 2003). Furthermore, monkeys with amygdala lesions exhibit fewer and smaller amplitude SCRs than controls on hearing novel tones (Bagshaw et al. 1965).
In light of these conflicting results, the contribution of the amygdala to the modulation of various types of SCRs remains unclear. It is possible that the amygdala is involved with SCR production/generation regardless of the source of arousal. To test this hypothesis, SCR parameters and single-unit activity within the amygdala were analyzed under two experimental conditions: an image viewing task using emotional and neutral stimuli and a rest period where monkeys sat in a dimly lit room, drifting in and out of sleep.
METHODS
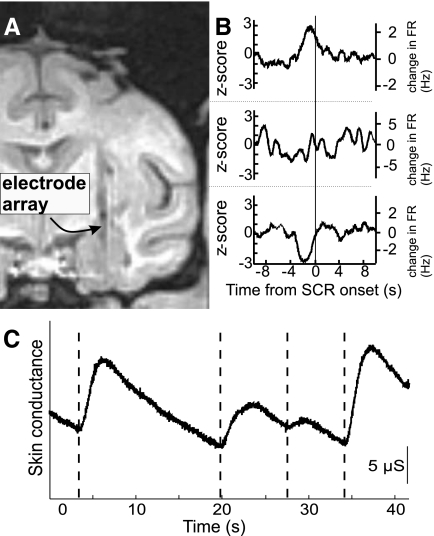
Two adult male monkeys (Macaca mulatta) were used in this study. The protocol conformed to National Institutes of Health guidelines and was approved by the IACUC at the University of Arizona. A detailed description of the surgical procedures and recording setup are provided in the supplementary material1 and have been previously described (Gothard et al. 2007). Briefly, monkeys were seated in a chair and head-immobilized during all recordings. A custom-built Eckhorn drive (Thomas Recording) independently advanced seven quartz-glass-insulated tungsten microelectrodes (80–100 μm diam) into the amygdala using an MRI-based method that has been histologically validated (Gothard et al. 2007). Figure 1A depicts an MRI taken of monkey T after the placement of seven electrodes in the amygdala using this method.
FIG. 1.
Anatomical reconstruction of recording sites, examples of skin conductance response (SCR)-triggered firing rate averages in 3 single units, and example of SCRs. A: a magnetic resonance imaging (MRI) slice containing the amygdala of monkey T. →, the artifact caused by an array of 7 microelectrodes (80 μm diam each, 600 μm spacing). B: SCR-triggered firing rate averages of 3 single units recorded from the accessory basal nucleus of monkey H during the image viewing task. Traces are in units of SDs from baseline activity (z-score; left axis) and change in firing rate (right axis). The average firing rates of these 3 units from top to bottom were 2.5, 21.3, and 17.3 Hz, respectively. C: typical trace of electrodermal activity with vertical lines marking the onset of skin conductance responses.
Neural signals were sampled continuously at 32 kHz, and single-unit activity was isolated off-line using commercial software (Spike, Cambridge Electronic Design). Electrodermal activity was recorded (Cambridge Electronic Design, 2502) at 100 Hz using EKG electrodes with adhesive solid gel (TenderTrodes, Vermed) placed on the thenar and central region of the palm. Ambient room temperature was maintained at 24–27°C. Figure 1C shows an example of electrodermal activity and the SCR onset times detected using a custom Matlab script. Eye movements were sampled at 120 Hz by an infrared eye tracker (ISCAN, Burlington, MA). Image display and the recording of trial events were controlled by NIMH Cortex software (NIMH, www.cortex.salk.edu).
Passive image viewing task
Each monkey was trained to maintain gaze on images displayed for 3 s on a monitor. During the task, the monkeys fixated for 100 ms on a square fixation icon subtending 0.5° of visual angle (dva), surrounded by a fixation window of 3 dva, which was then replaced with an image subtending 12 × 12 dva. Successful image viewing (3 s) was rewarded with 1 mL liquid reward. If the monkey failed to maintain gaze on the image, the image was removed, and a 2-s period was added to the 3-s intertrial interval. Both monkeys performed the image viewing task with >75% accuracy.
The stimuli depicted social (monkeys, humans, other animals) and nonsocial (objects, fractals, landscapes) factors. Monkey faces were chosen from a large library which categorized the images along the dimensions of monkey identity, direction of gaze (averted or direct), and facial expression (appeasing, neutral, or threatening) (Gothard et al. 2004). A stimulus set consisted of 10–24 images, presented in pseudorandom succession within 10–30 repeated trial blocks.
Rest condition
Each monkey was seated in a dimly lit room and allowed to drift in and out of sleep. The duration of this time period was not fixed, but a typical session would last 30 min. Two states within the rest condition were also identified: a period when the eyes remained closed for ≥5 s and a period when the eyes were open for ≥5 s.
Analysis of SCRs
The onset of SCRs was detected using a custom-designed Matlab script to identify positive deflections in the first derivative of smoothed electrodermal activity (500-ms moving average). SCRs were user verified in accordance with the canonical waveform described by Edelberg (1967). SCRs occurring 1–3 s after image onset were attributed to the image on the basis that the minimum latency of an SCR that could be elicited by an unexpected loud tone was 1.02 s for monkey H and 0.96 s for monkey T.
During the image viewing task, the probability of an SCR occurring at each of 30 time bins of 200 ms each, spanning the time course of trial events, was calculated for both monkeys. Spearman's rank correlation was used to determine if either the probability of images eliciting SCRs within a block or the magnitude of evoked SCRs indicated habituation of either measure.
Within the rest period, perievent time histograms of SCR occurrences were constructed using 1-s time bins spanning a 20-s window centered at the opening and closing of the eyes.
Analysis of spike trains
SINGLE-UNIT SCR-TRIGGERED AVERAGES.
The raw spike trains were converted to continuous firing rates using the spike count observed in a 1-s moving window translated across the spike train with a 1-ms step size. SCR-triggered averages were computed for each unit within a 20-s time window centered at the onset of SCRs. Each SCR-triggered average was normalized to its own baseline activity by subtracting the mean of the entire trace from the value of each time point along the trace. Additionally, for each individual SCR-triggered firing rate average, the largest deviation from baseline that occurred in the 2 s period prior to SCR onset (expressed as a z-score) was computed.
POPULATION SCR-TRIGGERED AVERAGES.
The mean and median change in firing rate was calculated at each time point across the population of mean-corrected SCR-triggered averages. The resulting population trace was then expressed in units of SDs away from its own mean (z-score). This was computed to determine if the net change from baseline firing activity observed across the population was significantly different near the onset of SCRs than at any other time. The procedure was also carried out after mean-corrected SCR-triggered averages had been converted to absolute values, as this would allow evaluation based only on the absolute magnitude of deviation from baseline.
PERIEVENT TIME HISTOGRAMS
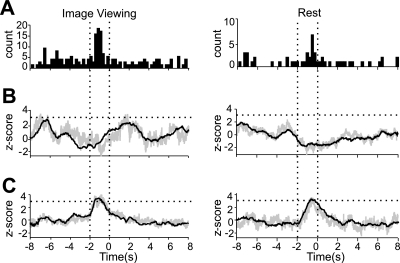
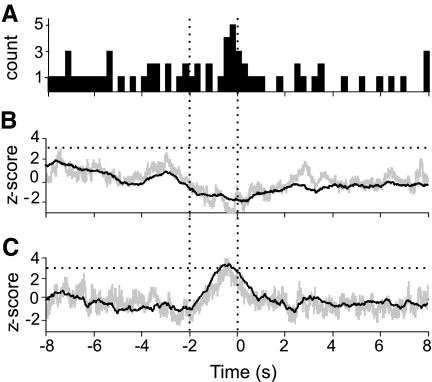
Finally, the raw spike train of each unit was used to create a peri-SCR time histogram with 250-ms bins spanning a 20-s window. Each bin was then evaluated for significant deviation from all other bins using a z-test at the P < 0.01 level. The locations of the significant bins were then recorded for each unit and combined into summary histograms (Fig. 3A) to indicate the number of units that showed a significant alteration of firing within each 250-ms bin surrounding SCR onset.
FIG. 3.
Neural activity centered on SCR onset in different experimental conditions. Left: panels show the outcome of 3 analyses conducted on the activity of 241 neurons during the image viewing task. Right: panels show the results of the same analyses carried out on 104 neurons recorded during rest. A: summary histograms showing the number of single units with significant (P < 0.01, z test) modulations in firing rate in any of the 250-ms time bins spanning a 20-s window centered on SCR onset (±8 s shown). B: net change in neural activity at the population level surrounding SCR onset. SCR-triggered firing rate averages were calculated for each unit and normalized to their baseline firing rates. At each time point, the population mean (black trace) and median (gray trace) were calculated. The resulting trace (±8 s shown) is expressed in units of SDs away from the mean of the entire 20-s trace (z-score). This convention is carried over into C. The horizontal dotted lines indicate a z-score value of 3. C: absolute change in neural activity at the population level surrounding SCR onset. The traces in C were calculated as in B except that each normalized SCR-triggered average was first converted to changes in the absolute value of the firing rate. The horizontal dotted lines indicate a z-score value of 3. When only response magnitude is considered (A and C), clear SCR-related activity is evident in both experimental conditions. The effects are cancelled out when direction is considered as well (B).
RESULTS
Behavioral correlates of skin conductance responses
On average, socially explicit stimuli such as facial expressions, tended to elicit smaller SCRs than nonsocial stimuli such as fractals or landscapes [1-way ANOVA, F(1,74) = 5.08, P = 0.027 for monkey H; F(1,58) = 3.86, P = 0.054 for monkey T]. No difference was found in the proportion of face and non-face images that evoked SCRs for either monkey (monkey T, P = 0.922; monkey H, P = 0.094, 2-tailed Fisher's exact test; see Supplementary Table S3).
Images of monkey faces with averted gaze elicited larger SCRs than faces of the same monkeys with gaze directed at the viewer, regardless of facial expression [2 × 3 ANOVA on gaze (direct, averted) and facial expression (appeasing, neutral, threatening), main effect of gaze F(1) = 8.23, P = 0.002].
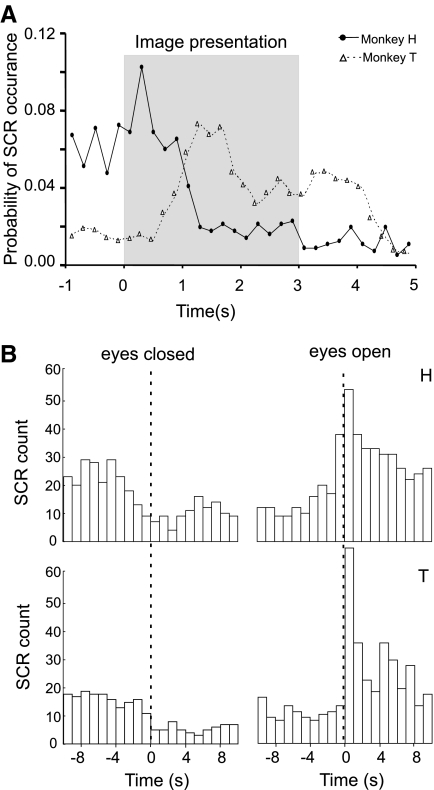
Monkey T viewed 14 image sets (3,431 image presentations), and monkey H viewed 9 image sets (1,840 image presentations). Overall, 72.6% of SCRs produced by monkey H occurred during the intertrial intervals, whereas 73.8% of the SCRs produced by monkey T occurred in response to the stimulus images. Figure 2A shows the probability of SCR occurrence in both monkeys as a function of trial progress. Because the minimum latency for an SCR is 1 s, the SCRs produced by monkey T can be attributed to the images or anticipation of reward, whereas in monkey H, the SCRs were triggered by anticipation of stimulus images or reward delivery from the previous trial.
FIG. 2.
Probability of SCR occurrence across all sessions as a function of trial progress during the image viewing task. A: in monkey T (▵), the largest number of SCRs occurred during the 3-s image viewing period. Bin size = 200 ms. In monkey H (•), the greatest probability of SCR production occurred just prior to and immediately after image onset. B: skin conductance responses mark the transition between epochs of closed and open eyes within the rest period. Histograms of SCR occurrence in monkeys H and T (top and bottom, respectively) centered on the closing and opening of the eyes. Bin size = 1 s. n = 213 and 225 transitions for monkeys T and H, respectively (all sessions).
There was no correlation between the proportion of images within an image block that evoked an SCR and the number of times the block had been repeated (monkey H, r = −0.39, P = 0.35; monkey T, r = 0.06, P = 0.88, Spearman's rank correlation). Likewise there was no correlation between the number of times a block had been repeated and SCR amplitude (monkey H, r = 0.006, P = 1.00; monkey T, r = −0.151, P = 0.68, Spearman's rank correlation).
The average time spent in each rest session with eyes open and closed were 22.71 ± 6.94 and 24.47 ± 11.67 min, respectively, for monkey H, and 13.67 ± 5.92 min and 26.18 ± 15.69 min for monkey T. For both monkeys, the frequency of SCRs was lower when the eyes were closed (Supplementary Table S1). The change in SCR frequency between the two states was time locked to the opening and closing of the eyes (Fig. 2B) The two monkeys differed in the relative frequency of SCRs elicited during image viewing as compared with the period of rest (Supplementary Table S1).
Neural correlates of the skin conductance response
During the period of rest, 104 single units were recorded from the amygdala (48 from monkey H, 56 from monkey T) and during image viewing, a different set of 241 single units were recorded (194 and 47 units from monkeys H and T, respectively). The number of single units recorded from each nucleus and their respective average firing rates are presented in Supplementary Table S2.
More units exhibited significant modulations in neural activity during the 2 s preceding SCR onset than any other time over the course of a 20-s time window (Fig. 3A). Each 250-ms time bin in Fig. 3A records the number of single units, the perievent time histograms of which showed significant modulation of activity within that time bin. For the image viewing condition, 18% (44 of 241) of units had at least one significant bin within the 2-s period prior to SCR onset as did 13% (14 of 104) of units recorded during rest.
At the population level, no clear net increase or decrease of firing rate was observed surrounding the onset of SCRs (Fig. 3B). This might reflect the cancellation of responses that occurred in positive and negative directions with regard to baseline activity (e.g., Fig. 1B). When only the magnitude of deviation from baseline activity is considered, a significant increase in the population's mean and median deviation from baseline emerges during the 2 s before SCR onset (Fig. 3C).
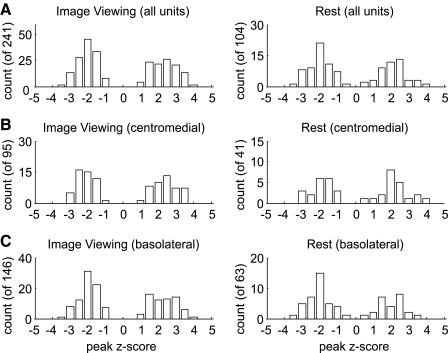
The response distribution across the population of single units was bimodal and approximately symmetric (Fig. 4), indicating two distinct response types characterized by the direction rather than magnitude of response. There was no difference in the response distribution across experimental conditions (P = 0.608, Kolmogorov-Smirnov test) or across monkeys (image viewing: P = 0.187; rest: P = 0.481, Kolmogorov-Smirnov test). For both image viewing and rest conditions, the response distribution was significantly different from a baseline period of 2 s beginning 5 s before SCR onset (P = 5.34e-4 for the image viewing condition, and P = 0.006 for the rest condition, Kolmogorov-Smirnov test). Recordings from the basolateral (lateral, basal, and accessory basal nuclei) and centromedial (central and medial nucleus, as well as the anterior amygdaloid area) nuclei had similar response distributions within both conditions (image viewing: P = 0.938; rest: P = 0.292, Kolmogorov-Smirnov test; Fig. 4, B and C). The average firing rates of the units did not correlate with their response size in either condition (r = −0.01, P = 0.872 for rest, and r = −0.19, P = 0.77 for image viewing, Spearman's rank correlation).
FIG. 4.
Distribution of SCR-related firing rate modulations across the population of single units for both experimental conditions. A: histograms showing the largest change from baseline firing (z-score) observed for each unit during a 2-s period preceding SCR onset. Single units are evenly split between those that show positive and negative changes in firing rate. The magnitudes of these responses are comparable, suggesting 2 distinct populations of units. B: the same histogram as in A but showing only single units recorded from the centromedial nuclei. C: same histogram as in A, but showing only single units recorded from the basolateral nuclei.
During the rest period, the probability of SCR occurrence was modulated by the opening and closing of the eyes (Fig. 2B). When SCRs that occurred within 10 s of the eyes opening or closing were removed from the analysis, SCR-related activity was still clearly present (Fig. 5). Therefore, the observed SCR-related neural modulation that occurred during the rest period cannot be accounted for by the change in visual input/alertness that occurred when the eyes opened or closed.
FIG. 5.
SCR-related neural activity is not dominated by the opening and closing of the eyes. A–C: depict the results of the same computations as in Fig. 3 with the exclusion of any SCRs occurring within 10 s of the eyes opening or closing during the rest condition. Although this technique had the effect of decreasing the number of highly modulated units (compare A with Fig. 3A), the level of population activity (C) shows the same significant deviation from baseline (z-score >3) as seen in Fig. 3C.
DISCUSSION
The results presented here indicate that neural activity in the amygdala marks the occurrence of an SCR regardless of its immediate trigger. In the context of a passive image viewing task, SCRs can occur spontaneously or be triggered by task-related factors. Given the variety of causative factors, the occurrence of an SCR cannot be used as an independent and reliable measure of stimulus image content, at least under these experimental conditions. Even so, the amplitudes of image-evoked SCRs do seem to be useful in determining which categories of images are on average more arousing. Within the rest condition, a fraction of the observed SCRs were related to the opening of the eyes, yet SCR-related activity was independent of this trigger, and the remaining SCRs could not be attributed to any tractable event.
Single units displayed SCR-related modulation in their firing rates at the typical latency for SCR production in response to supraliminary stimuli, potentially reflecting a functional link to the generation/modulation of SCRs. SCR-related changes in firing rate had a bimodal distribution regardless of the nucleus from which each unit was recorded. A similar bimodal distribution of response types was reported by Pascoe and Kapp (1985) in the central nucleus of the rabbit amygdala in conjunction with conditioned heart rate deceleration. The presence of neurons that either increase or decrease their firing rates in relation to the same autonomic output suggest that multiple pathways transmit signals from the amygdala to the autonomic centers of the brain stem.
The SCR-related activity observed in various nuclei of the amygdala may have different functional consequences. The centromedial nuclei are reciprocally connected to the autonomic centers of the brain stem and hypothalamus (Price and Amaral 1981) and could directly influence the generation of SCRs. The basolateral nuclei are not connected to autonomic effectors; rather, they send excitatory feedback connections to multiple cortical areas that process incoming sensory information (Amaral and Price 1984). The SCR-related activity observed in this nuclear group might reflect the recruitment of attentional resources, which may itself elicit autonomic arousal (Critchley 2002). Although we did not find differential patterns of activity between the basolateral and centromedial groups, it is possible that such a difference would emerge in relation to associative or instrumental learning. These effects are most likely reflected in increased BOLD signals in the amygdala (e.g., Knight et al. 2005); however, the single-unit responses reported here are either too weak overall to be reflected in the BOLD signal or the bidirectional modulation may complicate the relationship between multiunit activity and hemodynamic parameters. Importantly, our data show that SCR-related activity within the amygdala need not be elicited exclusively by strong emotion, fear conditioning, or sudden changes in the external environment.
Previous studies indicate that the monkey amygdala is differentially activated by images both at the single-unit and population level (Gothard et al. 2007). Images that elicited increased BOLD responses in the central nucleus of the monkey amygdala also elicit larger SCRs (Hoffman et al. 2007). In humans, functional imaging studies also show the amygdala to respond differentially to certain image types, often along emotional lines (Liberzon et al. 2000; Williams et al. 2001). Emotion, however, may not be the only factor involved. Images of monkeys with averted gaze elicited larger SCRs than the same monkeys with gaze directed at the viewer, regardless of facial expression. The social ambiguity of these indirect-gaze faces and/or the increased attention that may be paid to them could account for this observation. A similar case has been made to explain the increased BOLD signals in the amygdala of monkeys viewing indirect versus direct gaze faces (Hoffman et al. 2007). Regardless of the specific triggers of autonomic arousal, the overall SCR-related activity in the amygdala was found to be similar across different behavioral states. Our findings, therefore support the view that in addition to stimulus-specific responses, the amygdala may play a broader role in the modulation of sympathetic tone.
Finally, the amygdala is only one of many structures involved with emotion, attention, and autonomic regulation. The medial and orbital prefrontal cortices, the anterior insula, the anterior cingulate cortex, and periaquaductal gray have overlapping roles in the evaluation of emotional stimuli and in the initiation of autonomic responses, including SCRs (Critchley 2002). Further studies will be required to understand fully what unique role the amygdala plays in the generation and modulation of SCRs under various conditions. Our data indicate that the amygdala participates in the generation of sympathetic arousal in response to multiple triggers and even in the absence of explicit stimuli.
GRANTS
This work has been supported by National Institutes of Health Grants MH-070836, T32-GM-08400, and GM-072733.
Supplementary Material
Acknowledgments
P. Zimmerman was responsible for anesthesia, postoperative care, and behavioral training of monkeys involved in this project. We thank K. Brooks and P. Zimmerman for help with data collection. R. Gibboni III helped with data analysis. We are grateful to Dr. Andrew J. Fuglevand, who manufactured several generations of “belly plates” necessary for skin conductance recordings and edited several versions of the manuscript. We are grateful to Dr. Bruce McNaughton, who edited the final versions of the manuscript. The monkey face stimuli were collected at the California National Primate Research Center.
The costs of publication of this article were defrayed in part by the payment of page charges. The article must therefore be hereby marked “advertisement” in accordance with 18 U.S.C. Section 1734 solely to indicate this fact.
Footnotes
The online version of this article contains supplementary material.
REFERENCES
- Amaral and Price 1984.Amaral DG, Price JL. Amygdalo-cortical projections in the monkey (Macaca fascicularis). J Comp Neurol 230: 465–496, 1984. [DOI] [PubMed] [Google Scholar]
- Amiez et al. 2003.Amiez C, Procyk E, Honoré J, Sequeira H, Joseph JP. Reward anticipation, cognition, and electrodermal activity in the conditioned monkey. Exp Brain Res 149: 267–275, 2003. [DOI] [PubMed] [Google Scholar]
- Asahina et al. 2003.Asahina M, Suzuki A, Mori M, Kanesaka T, Hattori T. Emotional sweating response in a patient with bilateral amygdala damage. Int J Psychophysiol 47: 87–93, 2003. [DOI] [PubMed] [Google Scholar]
- Bagshaw and Benzies 1968.Bagshaw MH, Benzies S. Multiple measures of the orienting reaction and their dissociation after amygdalectomy in monkeys. Exp Neurol 20: 175–187, 1968. [DOI] [PubMed] [Google Scholar]
- Bagshaw and Coppock 1968.Bagshaw MH, Coppock HW. Galvanic skin response conditioning deficit in amygdalectomized monkeys. Exp Neurol 20: 188–196, 1968. [DOI] [PubMed] [Google Scholar]
- Bagshaw et al. 1965.Bagshaw MH, Kimble DP, Pribram KH. The GSR of monkeys during orienting and habituation and after ablation of the amygdala, hippocampus and inferotemoporal cortex. Neuropsychologia 3: 111–119, 1965. [Google Scholar]
- Bagshaw and Pribram 1968.Bagshaw MH, Pribram JD. Effect of amygdalectomy on stimulus threshold of the monkey. Exp Neurol 20: 197–202, 1968. [DOI] [PubMed] [Google Scholar]
- Bradley et al. 2001.Bradley MM, Codispoti M, Cuthbert BN, Lang PJ. Emotion and motivation. I. Defensive and appetitive reactions in picture processing. Emotion 1: 276–298, 2001. [PubMed] [Google Scholar]
- Critchley 2002.Critchley HD Electrodermal responses: what happens in the brain. Neuroscientist 8: 132–142, 2002. [DOI] [PubMed] [Google Scholar]
- Davis and Whalen 2001.Davis M, Whalen PJ. The amygdala: vigilance and emotion. Mol Psychiatry 6: 13–34, 2001. [DOI] [PubMed] [Google Scholar]
- Edelberg, 1967.Edelberg R Electrical properties of the skin. In: Methods in psychophysiology, edited by Brown CC. Baltimore, MD: Williams and Wilkins, 1967, p. 1–53.
- Gallagher and Holland 1994.Gallagher M, Holland PC. The amygdala complex: Multiple roles in associative learning and attention. Proc Natl Acad Sci USA 91: 11771–11776, 1994. [DOI] [PMC free article] [PubMed] [Google Scholar]
- Gothard et al. 2007.Gothard KM, Battaglia FP, Erickson CA, Spitler KM, Amaral DG. Neural responses to facial expression and face identity in the monkey amygdala. J Neurophysiol 97: 1671–1683, 2007. [DOI] [PubMed] [Google Scholar]
- Gothard et al. 2004.Gothard KM, Erickson CA, Amaral DG. How do rhesus monkeys (Macaca mulatta) scan faces in a visual paired comparison task? Anim Cogn 7: 25–36, 2004. [DOI] [PubMed] [Google Scholar]
- Hoffman et al. 2007.Hoffman KL, Gothard KM, Schmid MC, Logothetis NK. Facial-expression and gaze-selective responses in the monkey amygdala. Curr Biol 17: 766–772, 2007. [DOI] [PubMed] [Google Scholar]
- Knight et al. 2005.Knight DC, Nquyen HT, Bandettini PA. The role of the human amygdala in the prediction of conditioned fear responses. Neuroimage 26: 1193–1200, 2005. [DOI] [PubMed] [Google Scholar]
- Lang et al. 1964.Lang H, Tuovinen T, Valleala P. Amygdaloid afterdischarge and galvanic skin response. Electroencephalogr Clin Neurophysiol 16: 366–374, 1964. [DOI] [PubMed] [Google Scholar]
- Liberzon et al. 2000.Liberzon I, Taylor SF, Fig LM, Decker LR, Koeppe RA, Minoshima S. Limbic activation and psychophysiologic responses to aversive visual stimuli. interaction with cognitive task. Neuropsychopharmacology 23: 508–516, 2000. [DOI] [PubMed] [Google Scholar]
- Mangina and Beuzeron-Mangina 1996.Mangina CA, Beuzeron-Mangina JH. Direct electrical stimulation of specific brain structures and bilateral electrodermal activity. Int J Psychophysiol 22: 1–8, 1996. [DOI] [PubMed] [Google Scholar]
- Nikula 1991.Nikula R Psychological correlates of nonspecific skin conductance responses. Psychophysiology 28: 86–90, 1991. [DOI] [PubMed] [Google Scholar]
- Pascoe and Kapp 1985.Pascoe JP, Kapp BS. Electrophysiological characteristics of amygdaloid central nucleus neurons during pavlovian fear conditioning in the rabbit. Behav Brain Res 16: 117–133, 1985. [DOI] [PubMed] [Google Scholar]
- Price and Amaral 1981.Price JL, Amaral DG. An autoradiographic study of the projections of the central nucleus of the monkey amygdala. J Neurosci 1: 1242–1259, 1981. [DOI] [PMC free article] [PubMed] [Google Scholar]
- Spitler and Gothard 2008.Spitler KM, Gothard KM. A removable silicone elastomer seal reduces granulation tissue growth and maintains the sterility of recording chambers for primate neurophysiology. J Neurosci Methods 169: 23–26, 2008. [DOI] [PMC free article] [PubMed] [Google Scholar]
- Tranel and Damasio 1989.Tranel D, Damasio H. Intact electrodermal skin conductance responses after bilateral amygdala damage. Neuropsychologia 27: 381–390, 1989. [DOI] [PubMed] [Google Scholar]
- Williams et al. 2001.Williams LM, Phillips ML, Brammer MJ, Skerrett D, Lagopoulos J, Rennie C, Bahramali H, Olivieri G, David AS, Peduto A, Gordon E. Arousal dissociates amygdala and hippocampal fear responses: evidence from simultaneous fMRI and skin conductance recording. Neuromage 14: 1070–1079, 2001. [DOI] [PubMed] [Google Scholar]
- Yamazaki et al. 1972.Yamazaki K, Tajimi T, Okuda K, Nimi Y. Psychophysiological significance of skin potential activity in monkeys. Psychophysiology 9: 620–623, 1972. [DOI] [PubMed] [Google Scholar]
Associated Data
This section collects any data citations, data availability statements, or supplementary materials included in this article.


