

Abstract
The ability to trigger neuronal spiking activity is one of the most important functional characteristics of synaptic inputs and can be quantified as a measure of synaptic efficacy (SE). Using model neurons with both highly simplified and real morphological structures (from a single cylindrical dendrite to a hippocampal granule cell, CA1 pyramidal cell, spinal motoneuron, and retinal ganglion neurons) we found that SE of excitatory inputs decreases with the distance from the soma and active nonlinear properties of the dendrites can counterbalance this global effect of attenuation. This phenomenon is frequency dependent, with a more prominent gain in SE observed at lower levels of background input–output neuronal activity. In contrast, there are no significant differences in SE between passive and active dendrites under higher frequencies of background activity. The influence of the nonuniform distribution of active properties on SE is also more prominent at lower background frequencies. In models with real morphologies, the effect of active dendritic conductances becomes more dramatic and inverts the SE relationship between distal and proximal locations. In active dendrites, distal synapses have higher efficacy than that of proximal ones because of arising dendritic spiking in thin branches with high-input resistance. Lower levels of dendritic excitability can make SE independent of the distance from the soma. Although increasing dendritic excitability may boost SE of distal synapses in real neurons, it may actually reduce overall SE. The results are robust with respect to morphological variation and biophysical properties of the model neurons. The model of CA1 pyramidal cell with realistic distributions of dendritic conductances demonstrated important roles of hyperpolarization-activated (h-) current and A-type K+ current in controlling the efficacy of single synaptic inputs and overall SE differently in basal and apical dendrites.
INTRODUCTION
Dendrites play a central role in neuronal information processing. Electrical signals from other neurons are transmitted onto dendrites via synaptic inputs, which are located throughout the dendritic tree. The most important functional characteristic of synaptic inputs is their ability to influence neuronal spiking activity. At a strong excitatory synapse, a single action potential (AP) in the presynaptic cell might trigger an AP in the postsynaptic neuron, whereas at a weak excitatory synapse only a subthreshold excitatory postsynaptic potential (EPSP) would be initiated under the same stimulating conditions. In real neuronal networks an individual neuron receives many synaptic inputs from numerous other neurons. Under the appropriate circumstance of background activity, even an individual weak synaptic input can be the determining factor for AP initiation.
In neurons with passive dendrites, the effect of transient current injection at a given location on somatic voltage response decreases with distance due to attenuation (Rall and Agmon-Snir 1999; Rinzel and Rall 1974), imposing certain restrictions on synaptic positions relative to the soma. However, it is now recognized that dendrites of nerve cells express voltage-gated ion channels (Migliore and Shepherd 2002), which actively participate in the integration and generation of neuronal electrical activity (Häusser et al. 2000).
The ability of an individual synaptic input to evoke somatic postsynaptic potentials sufficient to trigger or alter spiking activity is often quantified as synaptic efficacy (London et al. 2002; Mouchet and Yelnik 2004a,b; Rumsey and Abbott 2004, 2006). Synaptic efficacy (SE) depends on numerous intrinsic and extrinsic factors, including e.g., the electrotonic characteristics of dendrites and the soma; the properties, expression, and space distribution of voltage-gated channels; the activity of the neuron itself; activation of other synapses; their weight, kinetic, and location distance of the input from the spike triggering zone; and morphological features of the dendritic tree. Regulation of SE is fundamental for the function of individual neurons and their networks, but the relative and interacting contributions of membrane excitability, background input–output activity, and dendritic morphology are not yet fully understood.
In the present study, we computationally investigated the influence of several factors on the efficacy of individual synapses as well as of the overall synaptic efficacy of the dendritic arborization. The investigated factors included the distance of synaptic input from the soma, frequency of the background network activity, neuronal morphology, and expression of voltage-gated channels. With respect to the latter, we focused in particular on sodium and delayed rectifier potassium conductances, plus, in one cell type, A-type potassium channels and hyperpolarization-activated cation channels (Ih). The aim of these studies was to reveal general principles that can determine synaptic efficacy across different types of cells. A preliminary report of these findings previously appeared in abstract form (Komendantov and Ascoli 2006).
METHODS
We used multicompartmental models of neurons with different morphologies and variable densities of voltage-gated ionic channels. Both simplified cylindrical dendrites (Fig. 1A) and three-dimensional reconstructions of real neuronal morphologies (Figs. 4A1, 5A1, 6A1, and 12A) were used in numerical simulations under the NEURON computational environment (Hines and Carnevale 1997).
FIG. 1.

Computation of synaptic efficacy (SE). A: model with single cylindrical dendrite, cylindrical soma, and Hodgkin–Huxley spike mechanism; excitatory and inhibitory synapses distributed uniformly along the dendrite. The excitatory synaptic probe was placed at different distances from the soma. B: single excitatory postsynaptic potential (EPSP) and corresponding time window used for determining the impact of the probe above and beyond background synaptic activity. Only spikes within the window (t2 − t1), when VEPSP > Vmax/2 were counted in the formulation of SE. C: effect of single dendritic synaptic input on background spiking activity. C1: spiking evoked by a background synaptic activity of 400 excitatory and 100 inhibitory synapses. C2: spiking evoked by the same background activity, plus an additional excitatory synapse (probe) placed at a given distance from the soma. Asterisks indicate additional spikes triggered by the probe activity. C3: activity of the excitatory probe in the absence of synaptic background. In this example, Nsp = 3, NEPSP = 50, SE = 0.06.
FIG. 4.
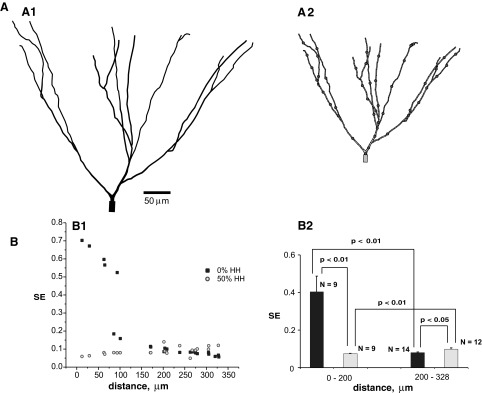
SE in the modeled granule cell of rat hippocampal dentate gyrus. A: graphical representation of morphological structure in the program NEURON. A1: dendritic tree. A2: distribution of inputs (each dot represents several synapses). B: synaptic efficacy measured at different distances of input from the soma under 2 different levels of expression of dendritic active channels with a frequency of background activity of 5 Hz. B1: variation of SE with distance. B2: statistical summary (mean ± standard error) of SE for proximal and distal synapses located at the denoted distance ranges from the soma.
FIG. 5.

SE in the modeled spinal motoneuron of mouse. See legend of Fig. 4.
FIG. 6.

SE in the modeled retinal ganglion (RG) cell of tiger salamander. See legend of Fig. 4.
FIG. 12.

SE in the CA1 pyramidal neuron model. Morphology, biophysical properties, and channel distributions were taken from our previous work (Migliore et al. 2005, neuron 5038804). A: graphical representation of the dendritic morphology. B: gA and gh in basal and apical dendrites as functions of the distance from the soma. C: dendritic input resistance as a function of the distance from the soma. Black line: exponential fit of calculated data points for basal dendrites, y= 0.1259 × e−0.0125x; gray line: exponential fit of calculated data points for apical dendrites, y= 0.2285 × e0.0027x, where y is Rin (MΩ) and −x and x are path distances from the soma (μm) in basal and apical dendrites, respectively. D: variation of SE with distance from the soma under different expression of ion channels; 400 excitatory and 100 inhibitory synapses provided 5-Hz background activity. Black lines: exponential fits of calculated data points for basal dendrites; gray lines: exponential fits of calculated data points for apical dendrites; in the equations y is SE and x is path distance from the soma (μm). D1: SE in the original control model. D2: SE under simulated blockage of h-current. D3: SE under simulated blockage of A-type K+ and hyperpolarization-activated (h-) current. E: statistical summary (mean ± standard error) of SE for basal and apical synapses located at the denoted distance ranges from the soma under different expression of ion channels.
Files with morphological structures of real neurons were retrieved from a database of digital reconstructions (http://neuromorpho.org; Ascoli 2006) and were converted into a format compatible with NEURON using CVAPP software for editing and visualizing morphology files (http://www.compneuro.org). In particular, the five files corresponded to rat hippocampal dentate gyrus granule cell 418882 from the Claiborne set (Rihn and Claiborne 1990), spinal mouse motoneuron ok_m88mod from the Ascoli set (Li et al. 2005), and tiger salamander retinal ganglion cells MART, LAR2, and mp_tv_01193_gc from the Miller set (Toris et al. 1995). In each of these models we implemented the same Hodgkin–Huxley (HH)–type spike-generating mechanism. Kinetics of voltage-gated sodium and potassium currents were adopted from a model of hippocampal pyramidal cells (Traub and Miles 1991). Model parameters are listed in Table 1.
TABLE 1.
Parameters of the model
| Parameter | Value | Parameter | Value |
|---|---|---|---|
| A. Geometrical parameters for the model with single cylindrical dendrite | |||
| Somatic diameter, dsoma | 30 μm | Somatic length, Lsoma | 30 μm |
| Dendritic diameter, ddend | 1 μm | Dendritic length, Ldend | 600 μm |
| B. Electrotonic parameters | |||
| Axial resistance, Ra | 150 Ω·cm | Specific membrane capacitance, Cm | 1 μF/cm2 |
| Somatic leak conductance, gl,soma | 0.3 μS/cm2 | Dendritic leak conductance, gl,dend | 0.0833 μS/cm2 |
| Leak reversal potential, El | −65 mV | Sodium reversal potential, ENa | 50 mV |
| Potassium reversal potential, EK | −90 mV | ||
| C. Active somatic conductances* | |||
| Somatic sodium conductance, gNa,soma, μS/cm2 | 10,000 | Somatic potassium conductance, gK,soma, μS/cm2 | 80,000 |
|
D. Synaptic current parameters | |||
| Excitatory Synapses |
Inhibitory Synapses | ||
|---|---|---|---|
| Parameter | Value | Parameter | Value |
| Vsyn,e | 0 mV | Vsyn,i | −75 mV |
| τ1,e | 0.2 ms | τ1,i | 0.75 ms |
| τ2,e | 1.7 ms | τ2,ie | 10 ms |
Active somatic conductances were doubled in the model spinal motoneuron and in one model RG cell (MART). They were five- and fourfold increased in the other model RG cells (mp_tv_01193_gc and LAR2, respectively).
Furthermore, a model of CA1 pyramidal neuron with realistic morphology, biophysical properties, and channel distribution (Migliore et al. 2005; neuron 5038804) was also used for SE computation. The model was taken from ModelDB, a web-accessible database (Hines et al. 2004; http://senselab.med.yale.edu/modeldb). In the model, the basic set of active dendritic properties included sodium (Na), potassium delayed rectifier (KDR), and A-type conductances (gA) and the hyperpolarization-activated (h-) conductances (gh). All channel kinetics and distributions in this model were based on the available experimental data for CA1 neurons and have been validated against several experimental findings. Conductances for Na and KDR currents were uniformly distributed over the entire (basal and apical) dendritic arborization. Conductances for IA and Ih currents increased linearly with the distance d, from the soma as gA =0.3(1 + d/100) and gh =0.005(1 + 3d/100), as in previous models (Migliore et al. 2005), which are based on experimental data (Hoffman et al. 1997; Magee 1998).
The background activity in all models originated from 400 identical excitatory and 100 identical inhibitory synapses unless otherwise specified. Each synapse was implemented in NEURON as point process with synaptic current Isyn(t) =Gsyn(t)(V− Vsyn), where Gsyn(t) is the synaptic conductance and Vsyn is the equilibrium synaptic potential, which is different for excitatory and inhibitory synapses (0 and −75 mV, respectively). The synaptic conductance is described by a two-state kinetic scheme with rise time constant τ1 and decay time constant τ2
 |
where w is the synaptic weight and f is a factor defined so that the normalized peak conductance is unitary. Parameters of model synaptic currents are also included in Table 1.
Individual excitatory inputs from one “probe” synapse at varying locations were activated against a realistically massive background of stochastic excitatory and inhibitory bombardment. The resulting somatic output was compared with the recording obtained in exactly identical conditions of background activation, but without the probe input. In each model, spike frequency of somatic output was matched to the frequency of background excitatory inputs (2, 5, 10, and 20 Hz) by adjusting their synaptic weights. This is a physiologically plausible condition because neurons in neuronal ensembles can fire with much the same frequency (Bartos et al. 2007; Buzsáki and Chrobak 1995; Jones 2002). In all simulations, the frequency of inhibitory inputs was constant at 10 Hz.
Several definitions have been proposed for synaptic efficacy (see discussion). In our approach, the measure of synaptic efficacy was devised to describe the ability of a single synapse to be the determining factor for triggering an action potential in the postsynaptic neuron. Thus a synaptic event would “count” if and only if it resulted in a spike that would not occur in its absence. A synaptic event could not be considered determining if it did not yield a spike, but also in the case that an action potential could be elicited by background synaptic activity without the probe. Moreover, in calculating synaptic efficacy spikes were counted only within the time window corresponding to the half-height of the EPSP maximum amplitude measured for the individual synaptic probe (from t1 to t2 in the example of Fig. 1B). In summary, synaptic efficacy SE was calculated as a probability of spike triggering according to the formula
 |
where Nsp is the number of spikes triggered during the half-height temporal widths of the probe during background bombardment, minus those initiated by an identical background excitation but without the probe, and NEPSP is the total number of EPSPs induced by the probe alone (Fig. 1C). Thus for each condition simulations were repeated with identical temporal and spatial patterns of background activation with and without the probe. To get higher accuracy in SE computation without increasing the simulated time series, we stimulated the individual probe synaptic input at a frequency of 25 Hz, higher than the background input–output activity. Since a robust SE measure usually required ≥150 s of recording, models were tested for 200 s (with a time step of 0.025 ms).
In addition to the synaptic efficacy of individually identified synapses, we also defined an overall synaptic efficacy (OSE) for a given neuron, which meant capturing the average synaptic efficacy of the “typical” synapse for that cell. To weigh different dendritic positions appropriately, we assumed constant density of excitatory synapses over the membrane surface area. Thus the number of synapses on a given branch is proportional to the dendritic surface area of that branch. These parameters were calculated from digital morphological files using L-Measure (http://krasnow.gmu.edu/L-Neuron), a free software program for quantitative morphometric analysis of neuronal reconstructions (Scorcioni and Ascoli 2001; Scorcioni et al. 2008). In particular, the dendritic surface was divided into bins based on the path distance from the soma. Fractional synaptic efficacy of the ith bin (FSEi) was computed as a product of the mean efficacy of synapses located in the bin (MSEi) times the fractional surface area of the bin, and OSE was simply the sum of fractional synaptic efficacy over all dendritic bins, corresponding to the average synaptic efficacy weighted by membrane surface area
 |
where Ai is the surface area of bin i and n is the total number of bins.
Also a measure of weighted path distance (WPD) from the soma to the center of synaptic efficacy was calculated according to the following formula
 |
where PDi is the path distance from soma to the center of the bin i. This measure captures the distance of the “typical” synapse (typical in terms of synaptic efficacy). Thus whereas SE and PD describe local properties of individual neuronal inputs, OSE and WPD provide a global characterization of an entire dendritic arbor.
The biophysical parameters of modeled neurons with real morphologies were the same as those in the simplified model with a single cylindrical dendrite (see Table 1), except for the maximal somatic Na+ and K+ conductances, which were doubled (to 20,000 and 160,000 μS/cm2, respectively) only in the mouse spinal motoneuron (Fig. 5) and the tiger salamander retinal ganglion cell (Fig. 6) to provide appropriate excitability and spike generation. The somatic input resistances and a selection of morphometric features of the neurons are reported in Table 2. As in the simplified model with a single cylindrical dendrite, 400 excitatory and 100 inhibitory synapses were distributed randomly on each dendritic tree with real morphology (Figs. 4A2, 5A2, and 6A2).
TABLE 2.
Somatic input resistance (Rin) and selected morphometric measures of different neuronal morphologies
| Model Type | Rin, MΩ | Number of Branches | Surface Area, μm2 | Path Distance From Soma to Tips, μm ± SD |
|---|---|---|---|---|
| Single cylindrical dendrite | 105 | 1 | 1,884.96 | 600 |
| Granule cell of rat hippocampal dentate gyrus | 72 | 24 | 16,780.50 | 262.21 ± 71.21 |
| Spinal motoneuron of mouse | 27 | 107 | 16,909.40 | 399.56 ± 140.03 |
| Retinal ganglion cell of tiger salamander (MART) | 218 | 125 | 4,058.83 | 218.37 ± 76.68 |
The custom software for analysis of simulation results was coded in the C programming language and is available on request. Simulation and analysis of the model activity were conducted on a 3-GHz Dual-Core Xeon Dell Precision Workstation 670 and a computer cluster of four similar machines. SE differences among proximal and distal dendrites were analyzed with t-test for unequal variances (Microsoft Excel).
RESULTS
Synaptic efficacy in a model neuron with cylindrical dendrite
We studied synaptic efficacy in the model with simplified morphology as a function of input distance from the soma, dendritic density of Hodgkin–Huxley type Na+/K+ conductances, and background synaptic activity.
In all simulations with a single cylindrical dendrite, synaptic efficacy displayed a general tendency to decrease with the distance of the probe from the site of spike initiation in the center of the soma. The results presented in Fig. 2 for 5- and 20-Hz background activity are typical for low and high frequencies, respectively. Figure 2, A and C plots synaptic efficacy against the normalized distance (ND) of the excitatory input from the soma, i.e., the distance divided by the total length of the dendrite. Simulation results for different dendritic densities of voltage-gated channels (expressed as percentage of those present at the soma) were fitted by exponential functions: SE = Aexp(−b·ND). In the insets, the fitting parameters A and b are plotted against the relative density of active conductances in the dendrite (%HH), with the data points connected by smoothed lines. Both functions have similar trends for each frequency of background activity. Figure 2, B and D shows normalized SE as a function of expression of voltage-gated channels for different distances at background activities of 5 and 20 Hz. Relative SE was calculated by dividing the SE of each series by its value in the passive dendrite (0% HH). The most evident tendency from this representation is that with increasing dendritic expression of voltage-gated channels, SE decreases in proximal synaptic inputs and increases at distal locations (e.g., compare trends at ND <0.1 and ND >0.3). At synapses located approximately midway in the dendrites (ND = 0.51), SE is threefold higher in fully active (100% HH) than in passive dendrites (0% HH). At 5-Hz frequency of background activity (Fig. 2D), the opposite relation holds for synapses adjacent to the soma (ND =0.01). At intermediate values of normalized distance (e.g., ND = 0.21), synapses can demonstrate a nearly constant SE throughout the whole range of densities of the spike-generating mechanism (0 to 100% HH).
FIG. 2.

SE in the model neuron with a uniform cylindrical dendrite. The dendritic density of voltage-gated Na+ and K+ channels (based on the Hodgkin–Huxley formalism) is denoted as a percentage of the somatic values (0, 25, 50 and 100% HH). A and C: SE as a function of normalized distance (ND) from the soma (distance/Ldend) for different expression levels of voltage-gated channels in dendrite at 2 frequencies of background activity (20 and 5 Hz). Data points were approximated by exponential functions SE = Aexp(−b·ND) whose fitting parameters A and b are shown in the insets against the expression level of dendritic voltage-gated channels (% HH). B and D: relative SE as a function of the dendritic expression of voltage-gated channels for different NDs from the soma at 2 frequencies of background activity (20 and 5 Hz).
The effects on SE of changing the distributions of sodium and potassium voltage-gated current conductances while keeping the total membrane conductance constant are shown in Fig. 3. Three different distributions of voltage-gated channels were simulated: linearly increasing from 0 to 100% HH along the dendrite from the soma to the tip (from ND = 0 to ND = 1), linearly decreasing from 100% HH at ND = 0 to 0% HH at ND = 1, and homogenous at 50% HH along the whole dendrite, corresponding to the conditions used in the previous simulations. Under high frequency of background activity (20 Hz), SE significantly decreases with distance from the soma for all distributions of voltage-gated channels (Fig. 3A). With the distribution of increasing voltage-gated channels densities, this tendency is also observed for all other investigated background frequencies (10, 5, and 2 Hz). However, under these frequencies, the model with decreasing density of voltage-gated channels displays no significant decay in SE with respect to the distance from the soma (Fig. 3, B, C, and D). The influence of varying distributions of active channels on SE is most pronounced at a background activity of 5 Hz (Fig. 3C). In this condition, the dependence of SE on normalized distance in the models with increasing and decreasing channel densities appears similar to that observed in the simulations with fully passive and fully active dendrites, respectively (Figs. 2C and 3C).
FIG. 3.

SE as functions of ND from the soma in cylindrical dendrites with different gradients of active channel expression and under various frequencies of background activity (A: 20 Hz; B: 10 Hz, C: 5 Hz, D: 2 Hz).
Synaptic efficacy in model neurons with real morphologies
The dependency of SE on the path distance of the probe input from the soma was also studied for several cases of real neuronal morphologies (Figs. 4A1, 5A1, and 6A1): a rat hippocampal granule cell (Rihn and Claiborne 1990), a mouse spinal motoneuron (Li et al. 2005), and a tiger salamander retinal ganglion (RG) cell (Toris et al. 1995). These simulations were all run with a 5-Hz spiking activity and under two levels of dendritic excitability: passive (0% HH) and partially active (50% HH).
For all morphologies, SE decreased with distance in the passive case (Fig. 4B1, 5B1, and 6B1). In contrast, models with dendritic expression of 50% of the somatic levels of voltage-gated Na+ and K+ conductances demonstrated a tendency of increasing SE farther from the soma. These trends were all statistically significant (Figs. 4B2, 5B2, and 6B2).The increase in synaptic efficacy in the active distal dendrites, relative to both the proximal location in the active condition and the distal location in the passive condition, was most dramatic in cells with more complex dendritic arbors: spinal motoneuron (Fig. 5B2) and RG cell (Fig. 6B2).
Changes in synaptic efficacy with distance between the input and the soma under different levels of dendritic excitability in models with real morphologies correlate with characteristics of individual EPSPs such as amplitude and duration. Figure 7A exemplifies somatic EPSPs evoked by synaptic input at different distances from the soma in the models of RG cells with different dendritic properties. In both models, the weights of excitatory synapses were adjusted to provide 5-Hz output activities. In the passive model, a somatic EPSP evoked by a synaptic input at a distance of 11 μm is much larger than an EPSP evoked by the same input at a distance of 274 μm. With partially active dendrites (50% HH), in contrast, the opposite holds true. In passive dendrites, the amplitude of somatic EPSPs decreases exponentially with the distance of the inputs from the soma (attenuation). However, in dendrites with 50% expression of voltage-gated channels the somatic EPSP amplitude is significantly higher for distal inputs than for proximal ones (Fig. 7B). In particular, it first decreases from 1 to 0.5 mV between 10 and 100–150 μm and then increases ≤8 mV at longer distances from the soma.
FIG. 7.

Changes of EPSP characteristics with synaptic input location in the RG cell. A: somatic EPSPs evoked by proximal (dendrite #31) and distal (dendrite #76) synaptic inputs with 2 expression levels of dendritic active channels. B and C: EPSP amplitude and half-height width with 2 expression levels of dendritic active channels as functions of the distance between synaptic input and soma. D: somatic and dendritic EPSPs (dendrite #76) evoked by distal dendritic inputs in models with 2 levels of expression voltage-gated channels. Left: EPSPs with passive dendrites. Right: EPSPs with partially active dendrites.
The duration of EPSPs, measured by the half-height width (see Fig. 1A and methods for definition) increases with distance in passive dendrites, but remains almost constant in the 50% HH simulations (Fig. 7C). For both the partially active and passive conditions, the amplitude of dendritic EPSPs locally evoked by distal synaptic inputs is much higher than the amplitude of the corresponding somatic EPSPs (Fig. 7D). However, only in the model with excitable dendrites does the distal synaptic input evoke a dendritic spike, causing much greater somatic depolarization than the same input in the passive case.
Input resistance of model neurons with different morphologies
Nerve cells usually have an input resistance (Rin) ranging from several megohms to 1,000 MΩ. The values of somatic input resistance in the models with different morphologies and with the same biophysical properties are all in a physiologically acceptable range (Table 2). Expression of active conductances (sodium and potassium) did not affect the measurement of Rin, which is based on small hyperpolarizing pulses from the resting potential. Dendritic input resistance of the model neuron with a single cylindrical dendrite increased linearly with the distance from the soma (Fig. 8A). However, in the models with real morphologies, dendritic Rin grew much more prominently as a function of distance. Figure 8B shows the values of dendritic input resistance calculated for the RG cell, which were fitted by a power function of the path distance from the soma. Such a dramatic rise of dendritic input resistance correlates with generation of dendritic spikes and increasing synaptic efficacy of distal inputs compared with that of proximal locations.
FIG. 8.

Dendritic input resistance in model neurons with different morphologies as a function of the distance from the soma. A: dendritic input resistance in the model with single cylindrical dendrite. Dashed line: linear fit of calculated data points, y= 600.68x+ 119.98, where y is input resistance (Rin, MΩ) and x is the normalized distance from the soma (distance/Ldend). B: dendritic input resistance in the model RG cell. Solid line: power fit of calculated data points, y= 0.4009x1.7758, where y is Rin (MΩ) and x is path distance from the soma (μm).
Overall synaptic efficacy in neurons with different morphologies
In passive dendrites, SE is higher for proximal locations than that for distal ones, although the reverse tendency is observed in active dendrites. To investigate the general effects of membrane properties on the SE of a “typical” input representative of the dendrite at large, we calculate overall synaptic efficacy, or OSE (see methods). In the simplified model with a single cylindrical dendrite, OSE equals the mean synaptic efficacy of all synaptic probes at different dendritic locations. In this case OSE is essentially independent of both frequency of background activity and expression of active conductances (Fig. 9A), possibly except for a slight decrease in the fully active condition (100% HH) at lower spiking frequencies (2–10 Hz).
FIG. 9.

Overall synaptic efficacy (OSE) in model neurons with different morphology. A: OSE in the model with cylindrical dendrite at several background frequencies (2, 5, 10, and 20 Hz) and dendritic expression of voltage-gated channels (0, 25, 50, and 100% HH). Values of total SE ± standard errors were calculated for all probes located at normalized distances from the soma (distance/Ldend) between 0 and 0.585. B: fractional SE as a function of binned path distance from the soma in the model RG cell with 2 expression levels of dendritic active channels (0 and 50% HH) at 5-Hz background activity. The surface area for each of the 48-μm-distance bins refers to the secondary axis.
In real neuronal morphologies, the dependence of dendritic surface area on the distance along the tree has a pronounced maximum at intermediate paths from the soma. Figure 9B demonstrates such a bell-shaped curve for the RG cell, with a peak at a distance of around 124 μm. This distribution of membrane surface area implies that the number of synapses varies with path distances from the soma. The corresponding nonuniform weight of SE at different locations yields a clear dependence of the fractional synaptic efficacy (FSE) on distance, which also displays an initial rise and subsequent decay (Fig. 9B). This interaction between surface area distribution and synaptic efficacy results in two main consequences. On the one hand, and in contrast with cylindrical dendrites, the overall synaptic efficacy (the sum of FSE over all path distances) is smaller in models with partially active dendrites than in fully passive trees (Table 3). In particular, a 50% HH dendritic expression reduced the OSE by 40 to 50% with respect to the passive condition in the three morphological classes we examined at 5 Hz of background activity. On the other hand, the weighed path distance (WPD) from the soma of the “typical” synapse (the average path to the “center of synaptic efficacy” represented by OSE), approximately corresponding to the peaks of FSE in Fig. 9B, increases considerably in the presence of dendritic active conductances relative to the passive case (Table 3).
TABLE 3.
Overall synaptic efficacy (OSE) and weighted path distance (WPD) between the center of synaptic efficacy and the soma in neurons with real morphologies at 5 Hz of background activity
| Expression of Active Conductances | 0% HH |
50% HH | ||
|---|---|---|---|---|
| OSE | WPD, μm | OSE | WPD, μm | |
| Retinal ganglion cell salamander (MART) | 0.048 | 86.74 | 0.029 | 202.39 |
| Granule cell of rat hippocampal dentate gyrus | 0.174 | 142.03 | 0.091 | 271.53 |
| Spinal motoneuron of mouse | 0.065 | 220.54 | 0.038 | 324.71 |
These novel results can be summarized into the following two testable hypotheses: 1) dendritic expression of voltage-gated conductance in real morphologies reduces synaptic efficacy near the soma and enhances it farther in the dendrites, so that proximal inputs have higher SE than that of distal ones in the passive case, whereas the reverse holds true in active conditions; 2) as a combination of these effects, dendritic expression of voltage-gated conductance reduces overall synaptic efficacy, but at the same time moves the relative center of synaptic efficacy farther from the soma, thus expanding the spatial domain of synaptic integration at the expense of total signal.
Robustness of the results
All models were stimulated with a standard set of uniformly distributed 400 excitatory and 100 inhibitory synapses, yet many CNS neurons in vivo receive many more synaptic inputs. To investigate the sensitivity of our results to this parameter, we computed SE in the RG cell model (Torris et al. 1995) with a new morphology (Fig. 10A) under two different conditions, corresponding respectively to the standard set of active synapses and to twice those numbers (800 excitatory and 200 inhibitory synapses). In both conditions (Fig. 10B) SE decreases with distance from the soma in the passive dendrite case (0% HH) and increases in the partially active dendrite case (50% HH). With both the standard and doubled number of synapses, expression of active channels decreases SE proximally and increases it distally compared with the passive case. Doubling the number of synapses makes these tendencies more prominent in the passive case and distally and less prominent in the active case and proximally (Fig. 10C). Computing the OSE and WPD for both the standard and doubled number of synapses at 5 Hz of background activity demonstrated the same tendencies with expression of active channels (Fig. 10D) shown in other models with real morphologies (Table 3). In particular, 50% HH dendritic expression reduced OSE and increased WPD relative to the passive case.
FIG. 10.

SE in the model RG cell with different number of active synapses. A: graphical representation of the dendritic morphology (Toris et al. 1995; cell mp_tv_011193_gc). B: SE measured at varying distances from the soma and with 2 levels of dendritic excitability. Background activity (5 Hz) was provided by 2 different sets of synapses (400 excitatory, 100 inhibitory; 800 excitatory, 200 inhibitory). C: statistical summary (mean ± standard error) of SE for synapses located within the denoted distance ranges. D: OSE and weighted path distance (WPD) between the center of synaptic efficacy and the soma with different number of synaptic inputs under different frequencies of background activity.
In the model with standard number of synapses, however, raising the frequency of background activity to 20 Hz considerably reduced the effect of dendritic active conductances. Specifically, in dendrites with 50% HH expression, the OSE no longer decreased relative to the passive case (in fact displaying a nonsignificant 8% increase), whereas the WPD increase (26%) was more moderate than that observed at 5 Hz.
In our simulations we uniformly distributed inhibitory synaptic inputs through the dendritic tree. However, in many neurons inhibitory synapses are located more proximally than excitatory inputs (see discussion). Therefore we tested SE in another model RG cell (Torris et al. 1995; cell LAR2, Fig. 11C) with different distributions of 100 inhibitory synapses, using a 5% density of sodium and potassium channels and a 5-Hz frequency of background activity (Fig. 11A). The computation of SE with uniformly distributed inhibitory synapses was compared with results obtained when the density of these synapses (Dis) decreased exponentially according to the equation Dis ∝ e−δx, where δ is a decay constant and x is the distance from the soma (Fig. 11A1, inset). Larger δ values make the densities of synapses decline more steeply with increasing distance from the soma. To compensate for the stronger influence of proximal inhibitory synapses, the excitatory synaptic conductances in the models with δ = 0.01 and δ = 0.02 were increased by 20 and 30%, respectively, of their values in the model with uniform distributions of inhibitory synaptic inputs. All three models provide similar dependencies of SE as a function of the distance from the soma (Fig. 11A2).
FIG. 11.

SE in the modeled RG cell under different conditions. A: influence of distribution of dendritic inhibitory synapses on synaptic efficacy in the RG cell model. A1: numbers of inhibitory synapses at different distance from the soma (binned by 50 μm) corresponding to the distributions shown in the inset. A2: SE as a function of somatic distance with different distributions of inhibitory synapses. B: SE as a function of distance from the soma for different dendritic expression levels of voltage-gated channels at a background frequency of 5 Hz. The dendritic density of active Na+ and K+ channels (based on the Hodgkin–Huxley formalism) is denoted as a percentage of the somatic values (0, 5, 10, 20, and 50% HH). Inset: parameters of the equations for the trend lines shown in B (SE= A × eb×distance) plotted against the expression level of dendritic voltage-gated channels (% HH). C: graphical representation of the dendritic morphology (Toris et al. 1995; cell LAR2). D: SE in the model RG cell under different frequencies of background activity. The dendritic density of voltage-gated channels corresponds to 5% of their somatic values.
Next we tested how intermediate levels of dendritic excitability (between 0 and 50% HH) could alter synaptic efficacy at different locations along the tree in a neuron with real morphology. For this purpose we used the same RG cell (LAR2) model under 5-Hz stimulation and output frequency and the standard uniformly distributed set of 400 excitatory and 100 inhibitory synapses. As expected, the effect of voltage-gated channels is related to their expression level. Greater expression levels of active channels result in lower values of proximal SE. At and above 10% of dendritic excitability relative to the somatic level, the model displays increasing SE farther from the soma. With lower levels of dendritic excitability (5% HH), as well as in passive dendrites (0% HH), SE decreases with the distance of the probe from the soma. At these moderate levels of dendritic excitability (5 and 10% HH), SE is almost independent of the somatic distance. Consistent with these results, when all data sets were fitted by exponential functions (SE = A × eb×distance), the fitting parameters A and b decreased and increased, respectively, with the density of voltage-gated channels (%HH). Relative expression of active channels between 5 and 10% corresponds to zero value of the parameters b (Fig. 11B, inset), indicating that in this range of dendritic excitability SE is not affected by somatic distance. Similar to previous examples with real morphologies, this model RG cell demonstrated a substantial decrease of overall synaptic efficacy (to half of the original value) and increase of weighted path distance from the soma to the center of synaptic efficacy (to 181% of the original value) when changing the relative expression of active channels from 0 to 50%. However, although the WPD increase was continuous at intermediate channel expression levels (5–20%), the OSE remained essentially constant at these lower levels of dendritic active conductances (Table 4). This observation suggests the existence of an optimal membrane density of voltage-gated mechanisms to maximize the spatial extent of effective synaptic integration without reducing the overall somatic signal.
TABLE 4.
OSE and WPD between the center of synaptic efficacy and the soma in the model retinal ganglion cells (Toris et al. 1995, cell LAR2) at different levels of dendritic expression of sodium and potassium voltage-gated channels
| Expression of Active Conductances | 0% | 5% | 10% | 20% | 50% |
|---|---|---|---|---|---|
| OSE | 0.036 | 0.038 | 0.042 | 0.03 | 0.018 |
| WPD, μm | 194.450 | 244.960 | 283.500 | 321.63 | 351.170 |
To test these results at a different frequency of background activity, we also studied SE in the same model under 10-Hz stimulation and output rate, using a 5% dendritic density of voltage-gated channels relative to the somatic value (Fig. 11D). The similar results at 5 and 10 Hz suggest that synaptic efficacy in this weakly excitable model neuron is nearly independent of input location at both frequencies.
Our choice of different neuronal morphologies within the same cell class also indicates robustness of the main findings. The different RG cell models with standard set of uniformly distributed synaptic inputs (400 excitatory and 100 inhibitory) under 5-Hz background activity demonstrate similar dependencies of SE on distance from the soma for both passive (0% HH) and partially active (50% HH) dendrites (cf. Figs. 6B, 10B, and 11B).
These results can be summarized into a third testable hypothesis that further specifies the two hypotheses formulated earlier: 3) the effects of active conductances on the SE of individual inputs and the overall synaptic efficacy are robust with respect to neuronal morphology and the number and distribution of synapses, but decrease at higher frequencies of background activity. As a result, SE is nearly position independent at intermediate levels of dendritic channel expression and the reduction in overall synaptic efficacy at higher expression levels is most pronounced at low frequencies of background activity.
Synaptic efficacy in the model of hippocampal CA1 pyramidal neuron
Active properties of dendritic membranes are determined by numerous voltage-dependent ion channels, which greatly increase the computational complexity of single neurons (for review see Frick and Johnston 2004; Magee et al. 1998; Reyes 2001). In all the simulations presented earlier, every model had the same minimal pair of voltage-gated sodium and potassium delayed rectifier currents. To expand these results, we also computed SE in a more complex biophysical model of a realistic hippocampal CA1 pyramidal neuron with sodium channels, delayed rectifier and A-type potassium channels and hyperpolarization-activated (h-) cation channels, using the standard set of 400 excitatory and 100 inhibitory synapses and around 5-Hz background activity. Morphology, membrane properties, and channel distribution (Fig. 12, A and B) were adopted from our previous work (Migliore et al. 2005). This model demonstrates growth in dendritic input resistance (Rin) with the distance from the soma, with a more prominent gradient in basal than that in apical dendrites. The values of Rin fit better to an exponential function for the basal arborization than for the more complex apical morphology (Fig. 12C). Because of significant differences in morphological and electrical properties, synaptic efficacies were computed, plotted, and analyzed separately for basal and apical dendrites. In the original model, SE demonstrates a tendency to increase with the distance from the soma in basal dendrites, whereas it displays a more modest and opposite dependence on the input location in apical dendrites (Fig. 12D1). Overall SE of the basal arborization is 2.8-fold higher than that of the apical tree (Table 5).
TABLE 5.
OSE and WPD between the center of synaptic efficacy and the soma in model of hippocampal CA1 pyramidal neuron (Migliore et al. 2005, neuron 5038804) under different voltage-gated channel expressions
| Dendritic Tree |
||||
|---|---|---|---|---|
| Basal |
Apical | |||
| OSE | WPD, μm | OSE | WPD, μm | |
| Original model | 0.014 | 158.67 | 0.005 | 218.52 |
| h-channel blockage | 0.026 | 157.30 | 0.011 | 247.62 |
| h-channel and A-type channel blockage | 0.019 | 151.37 | 0.030 | 355.11 |
The additional voltage-dependent mechanisms present in this CA1 pyramidal cell model compared with the simpler models examined earlier allow the exploration of the specific effects of Ih and IA on synaptic efficacy by blocking one or both of these currents in the simulations. Under simulated h-current blockage, the same tendencies for changes of SE with the distance from the soma were observed for basal and apical dendrites, but the individual SE values and the overall synaptic efficacy were nearly doubled (Fig. 12D2 and Table 5). However, it should be noted that to attain the same nearly 5-Hz background activity under simulated blockage of Ih, the excitatory synaptic weight was increased by 98% relative to the original model.
The simultaneous blockage of both A-type current and Ih makes the dependencies of SE with the distance from the soma similar for basal and apical dendrites, reverting the apical tendency from decreasing to increasing (Fig. 12D3). Under these conditions, overall synaptic efficacy was further increased in the apical trees (to threefold the measure obtained just blocking Ih, and sixfold the value of the model without any blockage). In contrast, OSE in the basal arborization was in between the values measured with and without Ih and in the presence of IA. Interestingly, blocking IA in addition to Ih required a reduction of the excitatory synaptic weights to 58% of their value in the original model to obtain the same approximately 5-Hz firing frequency. The statistical summary for variation of SE under all examined cases of dendritic expression of A-type potassium and h-channels is presented in Fig. 12E. In the apical dendrites, the weighted path distance between the center of synaptic efficacy and the soma increased on blockage Ih (+13%) and even further when also blocking A-type channels (+63% compared with the original conditions). In striking contrast, the WPD in the basal arbor was insensitive to blockage of these channels (Table 5). Simulated blockage of Ih and A-type currents is also accompanied by an increase of input resistance in the model. In particular, relative to control conditions, h-channel blockage was accompanied by 35 and 79% increases of distal dendrite input resistance in basal and apical trees, respectively. Under simulated blockage of both A-type current and Ih the corresponding increase of distal dendrite input resistance was 93 and 195% in basal and apical trees, respectively (data not shown). Similar tendencies in changes of input resistance, which resulted from blockage or underexpression of these channels, were observed in real CA1 pyramidal hippocampal neurons (Kim et al. 2005; Surges et al. 2004; see discussion).
DISCUSSION
Synapses play the fundamental role of transferring electrical activity among nerve cells. To understand how this function can be affected and regulated, it is important to quantify a measure of synaptic efficacy. Toward this goal, London et al. (2002) introduced a definition of synaptic efficacy based on information theory, measuring the mutual information between the input and output spike trains in the presence of massive background synaptic activity. Rumsey and Abbott (2004, 2006) formulated synaptic efficacy as the excess pre-before-post spiking probability, which was computed by subtraction of the baseline probability from the integrated cross-correlation function of pre- and postsynaptic action potentials for each synapse. Mouchet and Yelnik (2004a,b) simply considered synaptic efficacy for any dendritic location as the peak amplitude of the postsynaptic potential elicited at the soma from that site.
We defined SE as the probability of determinant spike initiation by an individual excitatory input within the time window in which the corresponding isolated EPSP would exceed half of its maximum amplitude. This measure takes into account changing peak and duration of somatic EPSPs with input location. In our simulations, all modeled neurons with passive dendrites exhibited a sharp and rapid decrease of SE with the path distance from the input to the soma. These findings are consistent with previous reports based on other definitions of synaptic efficacy (London et al. 2002; Mouchet and Yelnik 2004a,b; Rumsey and Abbott 2004, 2006). Our results also illustrate how nonlinear dendritic properties can counterbalance this global effect of attenuation. A simplified model with a single cylindrical dendrite and very low density of voltage-gated sodium channels (London et al. 2002) also showed increase in synaptic information efficacy for distal synapses relative to the passive case.
First, we studied the role of voltage-gated sodium and potassium delayed rectifier channels in counterbalancing the decrease of SE with distance from the soma in a simple model with a single dendrite. These simulations demonstrated that the phenomenon is frequency dependent, with a more prominent SE gain at lower levels of background activity and intermediate distances from the soma. For example, Fig. 2C shows that in the cylindrical model under 5-Hz spiking frequency, a midway level of dendritic excitability (50% HH) optimizes SE for intermediate locations (100–200 μm). In contrast, as displayed in Fig. 2A, SE does not significantly differ between passive and active dendrites at higher background frequencies (≥20 Hz). At lower frequencies, increasing expression of dendritic active conductance results in higher SE proximally and lower SE distally (Fig. 2, B and D). The effect of nonuniform distribution of active properties on SE is similarly most conspicuous at 5 Hz (Fig. 3). Thus SE appears to be determined by a nonlinear interplay among dendritic spike generating mechanisms, frequency of background activity, and input location.
Frequencies were chosen in a physiologically plausible range for all morphological classes of neurons investigated in the present study: retinal ganglion cells (Diamond and Copenhagen 1995), dentate gyrus granule cells (Muñoz et al. 1991), CA1 pyramidal neurons (Schwartzkroin 1975, 1977), and spinal motoneurons (Miles et al. 2005). The observed frequency dependence of SE in partially excitable dendrites suggests the possibility of propagation enhancement of certain input frequencies and reduction of others by active membrane properties. This mechanism might participate in the generation of theta oscillatory activity (4–10 Hz), which can be recorded from the hippocampus and is relevant to temporal coding and plasticity (for review see Buzsáki 2002, 2006). In particular in hippocampal granule cells in vivo, frequency potentiation of postsynaptic signals supports the notion that synaptic efficacy increases on stimulation in the theta frequency band (Muñoz et al. 1991).
In the single cylindrical dendrite, active channels can partially compensate for attenuation, but the SE of inputs farther than 300 μm from the soma is still very low. Since real neuronal dendrites are often longer than 300 μm, effective transmission of the most distal EPSPs requires additional amplifying mechanisms. For example, in CA1 pyramidal neurons, synaptic current progressively increases in distal apical dendrites (Magee and Cook 2000), due in part to a rising number of α-amino-3-hydroxy-5-methyl-4-isoxazolepropionic acid (AMPA) glutamate receptors (Andrasfalvy and Magee 2001). As a result, the amplitude of somatic EPSPs is on average independent of the site of generation, whereas the locally measured dendritic EPSP increases with distance from the soma (Magee and Cook 2000). A similar increase in dendritic EPSP amplitude is observed in neocortical layer 5 pyramidal neurons, even though in these cells the somatic EPSP amplitude decreases with the distance of synaptic input from the soma (Williams and Stuart 2002, 2003).
For each of the diverse realistic morphologies we studied (hippocampal granule cell, spinal motoneuron, and retinal ganglion cell), SE in passive dendrites decreased with distance from the soma, in agreement with other similar research (Mouchet and Yelnik 2004b; Rumsey and Abbott 2006). We found that real dendritic morphologies dramatically enhance the effect of active conductances, resulting in the inversion of the SE relationship between proximal and distal locations. Boosting of excitability in distal dendrites is predicted from neuronal structure because farther branches are electrically isolated from the somatic expanse, have smaller physical diameter, and higher input resistance (Fig. 8B). Similar gain in synaptic efficacy of some distal locations was observed in a high-dendritic spiking model of CA1 pyramidal neuron (Rumsey and Abbott 2006). The extremely high distal SE is based on dendritic action potentials as illustrated in Fig. 7D for the RG cell. These locally generated spikes propagate orthodromically to produce large somatic EPSPs, which have a considerable probability of making the determining contribution to the initiation of a new action potential in the soma. In the RG cell simulations, the width of somatic EPSPs induced by dendritic inputs was site independent (Fig. 7C). Furthermore, the effects on SE were extremely similar among different morphological reconstructions.
Additionally, our simulations suggest the possibility that SE could essentially become independent of the distance from the soma with low levels of dendritic excitability. In the model RG cell this condition was met between 5 and 10% of somatic expression of the voltage-gated channels (Fig. 11B). Although the reduction of overall synaptic efficacy at higher levels of dendritic excitability was observed in all real morphologies (Table 3), in this intermediate range of voltage-gated channel expression, OSE did not decrease (Table 4). Such SE equalization is fundamentally different from the mechanism suggested by Rumsey and Abbott (2006), which is due to a particular form of spike-timing–dependent plasticity (STDP), called anti-STDP.
The impact of other channels (particularly IA and Ih) on SE changes with the distance from the soma was studied in a realistic model of hippocampal CA1 pyramidal cell (Migliore et al. 2005). Whereas h-channels reduced SE in all dendrites, A-type channels most significantly reduced SE in distal branches of the apical tree (Fig. 12E). In these neurons, the A-type channels and h-channels are important contributors to passive dendritic properties, reduction of dendritic excitability, and voltage attenuation (Golding et al. 2005; Hoffman et al. 1997; Magee 1998; Surges et al. 2004). ZD7288, a specific h-channel blocker, increased the total input resistance of CA1 pyramidal neurons by about 45% in hippocampal slices measured in whole cell patch-clamp recordings (Surges et al. 2004). Dendritic expression of h-channels has a great impact on processing synaptic inputs. Blockage of Ih in Purkinje cells has little effect on spontaneous EPSP (sEPSP) rise time and peak, but slows the decay, blocks the undershoot, and increases the half-widths both for the somatic and propagated sEPSPs (Angelo et al. 2007). The same study also showed that total number of h-channels—not their distribution—governs the degree of temporal summation of EPSPs (Angelo et al. 2007). Consistent with those findings, our simulations of CA1 pyramidal neurons demonstrated an almost equal influence of h-channel blockage on SE at different locations (Fig. 12, D2 and E).
In CA1 pyramidal neurons, the activity-dependent regulation of intrinsic excitability mediated by increase or decrease in Ih can counterbalance the changes in synaptic strength during long-term potentiation (LTP) and long-term depression (LTD) to normalize neuronal firing (Brager and Johnston 2007; Fan et al. 2005). A-type potassium channels prevent initiation of dendritic action potentials (APs), limit spike back-propagation into the dendrites, and reduce excitatory synaptic events in CA1 pyramidal neurons (Hoffman et al. 1997). Moreover, blockage of these channels substantially lowered the voltage threshold for dendritic spikes (Gasparini et al. 2004). Experiments in organotypic slice cultures showed that expression of mutant A-type channel subunit Kv4.2 in CA1 pyramidal neurons led to increased input resistance, broader APs, and enhanced back-propagation. Conversely, Kv4.2 overexpression reduced input resistance, increased AP threshold, delayed AP onset, produced narrower APs, and inhibited dendritic AP propagation (Kim et al. 2005). These experimental findings are consistent with our model, which demonstrated increasing dendritic input resistance and SE under simulated h-channel and A-type channel blockage. Similarly, studies in dissociated hippocampal neurons and organotypic slice cultures showed regulated activity-dependent trafficking of ion channels (particularly in A-type channel subunit Kv4.2) in spines and dendrites (Kim et al. 2007). Such a mechanism might be used to control dendritic excitability and synaptic integration. These experiments are thus consistent with our computational studies, suggesting the possibility of SE regulation through changes in ion channel surface expression.
Although SE slowly decreased with the distance from the soma, in this model we used excitatory synaptic inputs with constant amplitude, whereas in real CA1 pyramidal neurons synaptic current progressively increases in distal apical dendrites (Magee and Cook 2000).
Dendritic morphology also exerts a critical influence on the overall SE of the neuron. Although with the simplified cylindrical dendrite OSE is not particularly affected by variations in dendritic excitability and background frequency, in real morphologies overall SE measured at a background frequency of 5 Hz is smaller in models with excitable dendrites (20–50% HH) than in models with the same morphology, but fully passive or weakly excitable dendrites (0–10% HH). In real morphologies, the overall synaptic efficacy is not affected by doubling the number of synapses with the same background frequencies (5 Hz), but OSE is frequency dependent in active dendrites (Fig. 10). In contrast to low frequency of background activity, OSE measured at 20 Hz is the same for both passive and excitable dendrites (50% HH). Thus expression of dendritic voltage-gated channels is a plausible mechanism for boosting the SE of distal locations in real neurons, but it may actually decrease synaptic efficacy overall at low frequencies.
Synaptic efficacy of excitatory inputs can be controlled by inhibitory synapses. Synaptic inhibition is effective in controlling somatic spike generation when it is located proximally, but much less so when located distally (Rall and Agmon-Snir 1999) and, indeed, synapses located on the cell body are mainly inhibitory (Kandel and Seigelbaum 2000). Compared with the uniformly distributed inhibitory synapses, proximal concentration of inhibitory inputs requires stronger excitatory drive to provide the same SE and output frequency of the neuron. Aside from this expected effect, variations in distribution of inhibitory synapses do not alter the dependence of excitatory SE on distance (Fig. 11A). In CA1 pyramidal cells, the number of inhibitory contacts decreases dramatically with distance from the soma and therefore excitation onto the distal dendrites is primarily controlled by proximal inhibition (Andrasfalvy and Mody 2006; Megias et al. 2001). However, neurons also have GABAergic synapses located distally and their effect is more specific than proximal inhibition because it counteracts synaptic excitation at the same dendritic locations (Rall 1964, 1967; Rall and Agmon-Snir 1999). Distal inhibition can control dendritic spikes and thus influence SE of excitatory inputs far from the soma.
Model limitations and conclusions
In this work, we used several models with different dendritic structures and membrane mechanisms to shed light on both the potential and limits of neuronal morphology and the expression of voltage-gated channels as determinants of synaptic efficacy. It is nonetheless important to recognize the limitations of our approach. We used a simplified biophysical model and did not try to accurately reproduce all ionic currents and synapses acting in these types of neurons. In most computations we included only voltage-gated Na+ and K+ channels that underlie spike generation and transmission because they are expressed in all nerve cells, whereas other channels and intracellular mechanisms are specific for each kind of neuron. However, in a subset of simulations, we also used a model of CA1 pyramidal neuron with different biophysical properties and a more complex set of realistic voltage-gated ionic channels: Na+ and K+ conductances underlying spike generation, as well as A-type potassium and Ih currents (Fig. 12). We also used a much-limited subset (AMPA and γ-aminobutyric acid type A) of the synaptic classes observed in real neurons and did not account for N-methyl-d-aspartate receptors and other calcium channels and intracellular Ca2+ dynamics.
Nevertheless, the main findings appeared to be robust with respect to several factors, including the number of independent (asynchronously active) synaptic inputs, the distribution of inhibitory synapses (discussed earlier), and the firing frequency of the neuronal output and background synaptic input. Moreover, the results were reproduced on a variety of cellular morphologies, spanning a broad range of neuronal phenotypes and morphometric characteristics (Table 2). In the case of retinal ganglion cells, no differences were found among three individual neurons, suggesting that our conclusions are unlikely to be undermined by the natural morphological variability of dendritic arbors.
The efficacy of synaptic inputs in real networks is likely malleable by the activity of the neurons rather than an immutable entity. In many neuronal types, spikes initiated in somata and axons actively back-propagate into dendritic trees, leading to calcium mediated LTP or LTD when coincident with excitatory synaptic inputs (Johnston et al. 1997, 2003). Activity-dependent postsynaptic elevation of intracellular Ca2+ concentration can evoke dendritic release of a retrograde messenger (cannabinoid), producing changes in presynaptic neurons that adjust synaptic weight and efficacy (Rancz and Häusser 2006).
Our studies suggest that SE may be controlled by expression or regulation of voltage-gated channels in a manner that is variable with the frequency of background activity. Specifically, the models predict that the influence of voltage-gated channel expressions on the SE of individual inputs as well as on the overall synaptic efficacy of dendritic trees is more prominent at a lower background activity. Our general results, which show increased SE in distal active dendrites compared with proximal and/or passive ones, are robust with respect to variations in morphological structure. Interestingly, however, the specific patterns of SE vary by morphological classes even when the same simple biophysical model is maintained unaltered. In neurons with simpler dendritic trees, such as hippocampal granule cells, the effect is less prominent than that in neurons with more complex arbors, such as spinal motoneurons and RG cells. These differences suggest possible variations in the rules of synaptic plasticity and integration for different parts of the dendritic arborization. In particular, the model of CA1 pyramidal cell with realistic distributions of dendritic conductances demonstrated important roles of h-current and A-type K+ current in controlling the SE of single inputs and overall synaptic efficacy in basal and apical dendrites.
GRANTS
This work was supported by National Institute on Aging Grant AG-25633 to G. A. Ascoli.
Acknowledgments
We thank Drs. Theodore C. Dumas and Duncan Donohue for useful feedback on an earlier manuscript version.
The costs of publication of this article were defrayed in part by the payment of page charges. The article must therefore be hereby marked “advertisement” in accordance with 18 U.S.C. Section 1734 solely to indicate this fact.
REFERENCES
- Andrasfalvy 2001.Andrasfalvy BK, Magee JC. Distance-dependent increase in AMPA receptor number in the dendrites of adult hippocampal CA1 pyramidal neurons. J Neurosci 21: 9151–9159, 2001. [DOI] [PMC free article] [PubMed] [Google Scholar]
- Andrasfalvy 2006.Andrasfalvy BK, Mody I. Differences between the scaling of miniature IPSCs and EPSCs recorded in the dendrites of CA1 mouse pyramidal neurons. J Physiol 576: 191–196, 2006. [DOI] [PMC free article] [PubMed] [Google Scholar]
- Angelo 2007.Angelo K, London M, Christensen SR, Häusser M. Local and global effects of I(h) distribution in dendrites of mammalian neurons. J Neurosci 27: 8643–8653, 2007. [DOI] [PMC free article] [PubMed] [Google Scholar]
- Ascoli 2006.Ascoli GA Mobilizing the base of neuroscience data: the case of neuronal morphologies. Nat Rev Neurosci 7: 318–324, 2006. [DOI] [PubMed] [Google Scholar]
- Bartos 2007.Bartos M, Vida I, Jonas P. Synaptic mechanisms of synchronized gamma oscillations in inhibitory interneuron networks. Nat Rev Neurosci 8: 45–56, 2007. [DOI] [PubMed] [Google Scholar]
- Brager 2007.Brager DH, Johnston D. Plasticity of intrinsic excitability during long-term depression is mediated through mGluR-dependent changes in I(h) in hippocampal CA1 pyramidal neurons. J Neurosci 27: 13926–13937, 2007. [DOI] [PMC free article] [PubMed] [Google Scholar]
- Buzsáki 2002.Buzsáki G Theta oscillations in the hippocampus. Neuron 33: 325–340, 2002. [DOI] [PubMed] [Google Scholar]
- Buzsáki 2006.Buzsáki G Rhythms of the Brain. Oxford, UK: Oxford Univ. Press, 2006, p. 112–117.
- Buzsáki 1995.Buzsáki G, Chrobak JJ. Temporal structure in spatially organized neuronal ensembles: a role for interneuronal networks. Curr Opin Neurobiol 5: 504–510, 1995. [DOI] [PubMed] [Google Scholar]
- Diamond 1995.Diamond JS, Copenhagen DR. The relationship between light-evoked synaptic excitation and spiking behaviour of salamander retinal ganglion cells. J Physiol 487: 711–725, 1995. [DOI] [PMC free article] [PubMed] [Google Scholar]
- Fan 2005.Fan Y, Fricker D, Brager DH, Chen X, Lu HC, Chitwood RA, Johnston D. Activity-dependent decrease of excitability in rat hippocampal neurons through increases in I(h). Nat Neurosci 27: 13926–13937, 2005. [DOI] [PubMed] [Google Scholar]
- Gasparini 2004.Gasparini S, Migliore M, Magee JC. On the initiation and propagation of dendritic spikes in CA1 pyramidal neurons. J Neurosci 24: 11046–11056, 2004. [DOI] [PMC free article] [PubMed] [Google Scholar]
- Golding 2005.Golding NL, Mickus TJ, Katz Y, Kath WL, Spruston N. Factors mediating powerful voltage attenuation along CA1 pyramidal neuron dendrites. J Physiol 568: 69–82, 2005. [DOI] [PMC free article] [PubMed] [Google Scholar]
- Häusser 2000.Häusser M, Spruston N, Stuart GJ. Diversity and dynamics of dendritic signaling. Science 290: 739–744, 2000. [DOI] [PubMed] [Google Scholar]
- Hines 1997.Hines ML, Carnevale NT. The NEURON simulation environment. Neural Comput 9: 1179–1209, 1997. [DOI] [PubMed] [Google Scholar]
- Hines 2004.Hines ML, Morse T, Migliore M, Carnevale NT, Shepherd GM. ModelDB: a database to support computational neuroscience. J Comput Neurosci 17: 7–11, 2004. [DOI] [PMC free article] [PubMed] [Google Scholar]
- Hoffman 1997.Hoffman DA, Magee JC, Colbert CM, Johnston D. K+ channel regulation of signal propagation in dendrites of hippocampal pyramidal neurons. Nature 387: 869–875, 1997. [DOI] [PubMed] [Google Scholar]
- Johnston 2003.Johnston D, Christie BR, Frick A, Gray R, Hoffman DA, Schexnayder LK, Watanabe S, Yuan LL. Active dendrites, potassium channels and synaptic plasticity. Philos Trans R Soc Lond B Biol Sci 358: 667–674, 2003. [DOI] [PMC free article] [PubMed] [Google Scholar]
- Johnston 1996.Johnston D, Magee JC, Colbert CM, Cristie BR. Active properties of neurponal dendrites. Annu Rev Neurosci 19: 165–186, 1996. [DOI] [PubMed] [Google Scholar]
- Jones 2002.Jones EG Thalamic circuitry and thalamocortical synchrony. Philos Trans R Soc Lond B Biol Sci 357: 1659–1673, 2002. [DOI] [PMC free article] [PubMed] [Google Scholar]
- Kandel 2000.Kandel ER, Siegelbaum SA. Synaptic integration. In: Principles of Neural Science (4th ed.). New York: McGraw-Hill/Appleton & Lange, 2000, p. 207–228.
- Kim 2007.Kim J, Jung SC, Clemens AM, Petralia RS, Hoffman DA. Regulation of dendritic excitability by activity-dependent trafficking of the A-type K+ channel subunit Kv4.2 in hippocampal neurons. Neuron 54: 933–947, 2007. [DOI] [PMC free article] [PubMed] [Google Scholar]
- Kim 2005.Kim J, Wei DS, Hoffman DA. Kv4 potassium channel subunits control action potential repolarization and frequency-dependent broadening in rat hippocampal CA1 pyramidal neurones. J Physiol 69: 41–57, 2005. [DOI] [PMC free article] [PubMed] [Google Scholar]
- Komendantov 2006.Komendantov AO, Ascoli GA. Activity-dependent regulation of synaptic efficacy. Prog. #730.9. 2006 Abstract Viewer and Meeting Planner. Atlanta, GA: Society for Neuroscience, 2006. CD-ROM.
- Li 2005.Li Y, Brewer D, Burke RE, Ascoli GA. Developmental changes in spinal motoneuron dendrites in neonatal mice. J Comp Neurol 483: 304–317, 2005. [DOI] [PubMed] [Google Scholar]
- London 2002.London M, Schreibman A, Häusser M, Larkum ME, Segev I. The information efficacy of a synapse. Nat Neurosci 5: 332–340, 2002. [DOI] [PubMed] [Google Scholar]
- Magee 1998.Magee J, Hoffman D, Colbert C, Johnston D. Electrical and calcium signaling in dendrites of hippocampal pyramidal neurons. Annu Rev Physiol 60: 327–346, 1998. [DOI] [PubMed] [Google Scholar]
- Magee 2000.Magee JC, Cook EP. Somatic EPSP amplitude is independent of synapse location in hippocampal pyramidal neurons. Nat Neurosci 3: 895–903, 2000. [DOI] [PubMed] [Google Scholar]
- Megias 2001.Megias M, Emri Z, Freund TF, Gulyas AI. Total number and distribution of inhibitory and excitatory synapses on hippocampal CA1 pyramidal cells. Neuroscience 102: 527–540, 2001. [DOI] [PubMed] [Google Scholar]
- Migliore 2005.Migliore M, Ferrante M, Ascoli GA. Signal propagation in oblique dendrites of CA1 pyramidal cells. J Neurophysiol 94: 4145–4155, 2005. [DOI] [PMC free article] [PubMed] [Google Scholar]
- Migliore 2002.Migliore M, Shepherd GM. Emerging rules for the distributions of active dendritic conductances. Nat Rev Neurosci 3: 776–781, 2002. [DOI] [PubMed] [Google Scholar]
- Miles 2005.Miles GB, Dai Y, Brownstone RM. Mechanisms underlying the early phase of spike frequency adaptation in mouse spinal motoneurones. J Physiol 566: 519–532, 2005. [DOI] [PMC free article] [PubMed] [Google Scholar]
- Mouchet 2004a.Mouchet P, Yelnik J. A biophysical model of neuronal dendrites' integrative properties: relations to morphological data. Acta Biotheor 52: 313–322, 2004a. [DOI] [PubMed] [Google Scholar]
- Mouchet 2004b.Mouchet P, Yelnik J. Basic electrotonic properties of primate pallidal neurons as inferred from a detailed analysis of their morphology: a modeling study. Synapse 54: 11–23, 2004b. [DOI] [PubMed] [Google Scholar]
- Muñoz 1991.Muñoz MD, Núñez A, García-Austt E. Frequency potentiation in granule cells in vivo at θ frequency perforant path stimulation. Exp Neurol 113: 74–78, 1991. [DOI] [PubMed] [Google Scholar]
- Rall 1964.Rall W Theoretical significance of dendritic trees for neuronal input–output relations. In: Neural Theory and Modeling, edited by Reiss RF. Stanford, CA: Stanford Univ. Press, 1964, p. 73–94.
- Rall 1967.Rall W Distinguishing theoretical synaptic potentials computed for different soma-dendritic distributions of synaptic inputs. J Neurophysiol 30: 1138–1168, 1967. [DOI] [PubMed] [Google Scholar]
- Rall 1999.Rall W, Agmon-Snir H. Cable theory for dendritic neuron. In: Methods in Neuronal Modeling. From Ions to Networks (2nd ed.). Cambridge, MA: Bradford/The MIT Press, 1999, p. 27–92.
- Rancz 2006.Rancz EA, Häusser M. Dendritic calcium spikes are tunable triggers of cannabinoid release and short-term synaptic plasticity in cerebellar Purkinje neurons. J Neurosci 26: 5428–5437, 2006. [DOI] [PMC free article] [PubMed] [Google Scholar]
- Reyes 2001.Reyes A Influence of dendritic conductances on the input-output properties of neurons. Annu Rev Neurosci 24: 653–675, 2001. [DOI] [PubMed] [Google Scholar]
- Rihn 1990.Rihn LL, Claiborne BJ. Dendritic growth and regression in rat dentate granule cells during late postnatal development. Brain Res Dev Brain Res 54: 115–124, 1990. [DOI] [PubMed] [Google Scholar]
- Rinzel 1974.Rinzel J, Rall W. Transient response in a dendritic neuronal model for current injected in one branch. Biophys J 14: 759–790, 1974. [DOI] [PMC free article] [PubMed] [Google Scholar]
- Rumsey 2004.Rumsey CC, Abbott LF. Equalization of synaptic efficacy by activity- and timing-dependent synaptic plasticity. J Neurophysiol 91: 2273–2280, 2004. [DOI] [PubMed] [Google Scholar]
- Rumsey 2006.Rumsey CC, Abbott LF. Synaptic democracy in active dendrites. J Neurophysiol 96: 2307–2318, 2006. [DOI] [PubMed] [Google Scholar]
- Scorcioni 2001.Scorcioni R, Ascoli GA. Algorithmic extraction of morphological statistics from electronic archives of neuroanatomy. Lect Notes Comp Sci 2084: 30–37, 2001. [Google Scholar]
- Scorcioni 2008.Scorcioni R, Polavaram S, Ascoli GA. L-Measure: a web-accessible tool for the analysis, comparison and search of digital reconstructions of neuronal morphologies. Nat Protoc 3: 866–876, 2008. [DOI] [PMC free article] [PubMed] [Google Scholar]
- Schwartzkroin 1975.Schwartzkroin PA Characteristics of CA1 neurons recorded intracellularly in the hippocampal in vitro slice preparation. Brain Res 85: 423–436, 1975. [DOI] [PubMed] [Google Scholar]
- Schwartzkroin 1977.Schwartzkroin PA Further characteristics of hippocampal CA1 cells in vitro. Brain Res 128: 53–68, 1977. [DOI] [PubMed] [Google Scholar]
- Surges 2004.Surges R, Freiman TM, Feuerstein TJ. Input resistance is voltage dependent due to activation of Ih channels in rat CA1 pyramidal cells. J Neurosci Res 76: 475–480, 2004. [DOI] [PubMed] [Google Scholar]
- Toris 1995.Toris CB, Eiesland JL, Miller RF. Morphology of ganglion cells in the neotenous tiger salamander retina. J Comp Neurol 352: 535–559, 1995. [DOI] [PubMed] [Google Scholar]
- Traub 1991.Traub RD, Miles R. Neuronal Network of the Hippocampus. Cambridge, UK: Cambridge Univ. Press, 1991.
- Williams 2002.Williams SR, Stuart GJ. Dependence of EPSP efficacy on synapse location in neocortical pyramidal neurons. Science 295: 1907–1910, 2002. [DOI] [PubMed] [Google Scholar]
- Williams 2003.Williams SR, Stuart GJ. Role of dendritic synapse location in the control of action potential output. Trends Neurosci 26: 147–154, 2003. [DOI] [PubMed] [Google Scholar]