

Abstract
Background
Use of induction for renal transplantation is controversial due to concerns about long-term safety and efficacy.
Methods
We compared the safety and efficacy at 10 years among patients randomized to Thymoglobulin or Atgam induction in a single center, randomized, double-blinded trial. Quality adjusted life years (QALYs) were calculated using utility weights.
Results
The primary composite endpoint of freedom from death, graft loss, or rejection, “event-free survival”, was higher with Thymoglobulin compared to Atgam (48% vs 29%; P=0.011). At 10 years, patient survival (75% vs 67%) and graft survival (48% vs 50%) were similar, while acute rejection remained lower (11% vs 42%, P=0.004) in the Thymoglobulin group. The incidence of all types of cancer was numerically lower with Thymoglobulin compared to Atgam (8% vs 21%, P=NS). There were no post-transplant lymphoproliferative disorder (PTLD) in the Thymoglobulin group and there were two cases in the Atgam group. There were no new cases of cytomegalovirus (CMV) disease in either group. Mean serum creatinine levels were higher (1.7±0.5 mg/dL vs 1.2±0.3 mg/dL; P=0.003) and estimated glomerular filtration rates (GFR) tended to be lower (49± 22 ml/min vs 65± 19 ml/min; P=0.065) in the Thymoglobulin group. There were 0.53 QALYs gained (3.68 Thymoglobulin vs 3.15 Atgam; 16.7% improvement) from Thymoglobulin compared to Atgam.
Conclusions
This long-term follow up showed that Thymoglobulin was associated with higher event-free survival and improved QALYs, without increased PTLD or CMV disease, compared to Atgam at 10 years.
Keywords: Thymoglobulin, Atgam, Clinical Trial, Kidney transplant
BACKROUND
Results of a randomized double-blinded trial of Thymoglobulin (n=48) vs Atgam (n=24) for induction therapy in renal transplant patients revealed that at 1 year, Thymoglobulin patients had better graft survival (98% vs 83%, P=0.020), less graft rejection (4% vs 25%, P=0.014), and less cytomegalovirus (CMV) disease (13% vs 33%, P=0.056) (1). Patient survival was not different, but the composite end point of freedom from death, graft loss, or rejection, the "event-free survival," was superior with Thymoglobulin (94%) compared with Atgam (63%; P = 0.0005).
At 5 years of follow-up, event-free survival (73% vs 33%; p<0.001); graft survival (77% vs 55%; P=0.047); and freedom from rejection (92% vs 66%; P=0.007) were improved with Thymoglobulin vs Atgam (2). No additional CMV disease occurred after the first year with Thymoglobulin or Atgam (13% vs 33%; P=0.056). There were two cases of post-transplant lymphoproliferative disorder (PTLD) in the Atgam group and none in the Thymoglobulin group.
In the current era of transplantation, controversy still remains regarding the use of induction therapy for renal transplant recipients, mainly due to concerns about long-term safety and efficacy. There are few studies that have long-term follow up. The purpose of this study was to examine the long-term patient survival, graft survival, rates of acute rejection, incidence of CMV infection and disease, PTLD, renal function, and quality adjusted life years (QALYs) at 10 years post-renal transplant in patients who received Thymoglobulin or Atgam induction in a single center randomized, double-blinded trial.
MATERIALS AND METHODS
This randomized, single-center, double-blinded trial of adult renal transplant recipients and the 10 year follow-up of the study were approved by the Washington University Human Research Protection Office. Study design and inclusion and exclusion criteria of the trial have been previously described (1).
Immunosuppressive protocol
All patients received quadruple sequential immunosuppression consisting of induction with Thymoglobulin (1.5 mg/kg) or Atgam (15 mg/kg) daily for up to 7 days, followed by triple immunosuppressive therapy including cyclosporine, azathioprine or mycophenolate mofetil and corticosteroids. The details of the immunosuppressive regimen have been previously described (1). Oral ganciclovir was given to recipients for three months when either the donor or recipient was CMV seropositive.
Outcomes and end points
The primary endpoint of this study was the composite endpoint of freedom from death, graft loss or acute rejection at 10 years. Secondary analysis included 10-year patient survival, graft survival, rates of rejection, incidence of CMV infection and disease, incidence of malignancy including PTLD, renal function as assessed by serum creatinine and estimated glomerular filtration rate (GFR), and QALYs.
Definitions
CMV infection and disease were defined as previously described (3, 4). Acute rejection episodes were determined by the presence of clinical signs, including but not limited to, fever, graft tenderness, and rise in serum creatinine and were confirmed in all cases by biopsy as defined by the Banff ‘97 criteria. Glomerular filtration rate (GFR) was estimated by the abbreviated modification of diet in renal disease (MDRD) formula (5).
Quality adjusted life years (QALYs) were calculated using utility weights obtained from published literature (6-8). Utility weights are a measure of patients’ perceived relative value of health. They range from 0 to 1, where 1 represents perfect health and 0 represents death. The utilities used were 0.70 for a functioning transplant, 0.57 for graft failure with return to dialysis, and 0 for death. The standard discount rate of 5% was applied (6). A multi-way sensitivity analysis was performed to analyze the robustness of the results. Utility ranges suggested by Whiting of 0.65 to 0.85 for a functioning graft and 0.45 to 0.60 for graft failure were used (7). The discount rate was varied from 0 to 10%. Percent improvement in QALYs was calculated for the main analysis and the sensitivity analyses.
Database and Patient Follow-up
Patients at our center are followed with a minimum of monthly labs and yearly clinic visits. Patients are tracked at least yearly and their clinical status is reported to UNOS. Our center uses an electronic medical record system, Organ Transplant Tracking Record (OTTR — HKS Medical Information Systems, Omaha, NE). In addition, a research nurse monitors and records all pertinent data from the medical records in a database for research purposes. Routine testing for polyoma virus in plasma was performed for evaluation of renal dysfunction beginning in 2001.
Statistics
Incidence of the combined endpoint, freedom from acute rejection, graft loss, and death, was calculated using survival analysis techniques. Differences in patient characteristics were tested with the Student’s t-test for continuous variables and the Fisher’s exact test for binary categorical variables. All statistical tests were two-tailed and a P value of <0.05 was considered significant.
RESULTS
Between May of 1996 and March of 1997, patients were enrolled and randomized 2:1 in a double-blinded fashion to receive Thymoglobulin at 1.5 mg/kg (n=48) vs Atgam at 15 mg/kg intravenously (n=24), intraoperatively and then daily for at least 6 days post-transplant (total of seven days). There were no differences in baseline recipient or donor characteristics (1). Overall, the mean recipient age was 47 years; 33% of patients were black, 62% were male; 25% were diabetic, and 75% received deceased donor renal allografts. Ten-year follow-up was available on all patients enrolled in the trial.
Survival
The demographics of patients surviving 10 years are shown in Table 1. Patient survival was similar between the groups. In the Thymoglobulin group, 12 patients expired (25%); reasons for death included cardiovascular complications (n=6), cancer (n=2; renal carcinoma, lung cancer), lung disease (n=2), infection (n=1) and an intracranial bleed (n=1) [Table 2]. In the Atgam group, 8 patients expired (33%); reasons for death included cancer (n=4; metastatic gastric adenocarcinoma, multiple myeloma, colon cancer and PTLD), infection (n=2; necrotic bowel and pneumonia), an intracranial hemorrhage (n=1) and a thrombotic cerebral vascular accident (n=1). Survivors were more likely to be free of malignancy and had younger donors [Table 1].
Table 1.
10 year Patient Survivor’s Donor and Recipient Characteristics and Outcomes
| Variable | Survivor (n=52) |
Died (n=20) |
|---|---|---|
| Thymoglobulin | 36 (75%) | 12 (25%) |
| Atgam | 16 (67%) | 8 (33%) |
| Outcomes | ||
| Graft Loss | 17 (33%) | 20 (100%) |
| Censored Graft Loss | 17 (33%) | 3 (15%) |
| Acute Rejection | 10 (19%) | 3 (15%) |
| Malignancy | 2 (4%) | 7 (35%)* |
| CMV Infection | 9 (17%) | 4 (20%) |
| CMV Disease | 8 (15%) | 6 (30%) |
| PTLD | 0 | 2 (10%) |
| Recipient Characteristics | ||
| Age, years | 44±14 | 53±11* |
| Black | 16 (31%) | 7 (35%) |
| Female | 21 (40%) | 7 (35%) |
| BMI | 26 6 | 26 4 |
| Live Donor | 15 (29%) | 2 (10%) |
| CKD caused by DM | 12 (23%) | 5 (25%) |
| Re-transplant | 4 (8%) | 1 (5%) |
| Donor Characteristics | ||
| Age, years | 34±16 | 30±20 |
| Black | 7 (13%) | 4 (20%) |
| Female | 23 (44%) | 7 (35%) |
| Cold Ischemia Time, hrs | 13± 5 | 14± 7 |
| Delayed Graft Function | 0 | 1 (5%) |
mean ± SD
P< 0.05
CMV — cytomegalovirus, PTLD — post transplant lymphoproliferative disorder, BMI — body mass index, CKD — chronic kidney disease, DM — diabetes mellitus
Table 2.
Ten-year Endpoints
| Atgam (n=24) |
Thymo (n=48) |
|
|---|---|---|
| Freedom from Composite Endpoint | 7 (29%) | 23 (48%)* |
| Patient Survival | 16 (67%) | 36 (75%) |
| Graft Survival | 12 (50%) | 23 (48%) |
| Censored Graft Survival | 19(76%) | 33 (69%) |
| Death | 8 | 12 |
| Cardiovascular | 1 | 6 |
| Cancer | 4 | 2 |
| Infection | 2 | 1 |
| Bleed | 1 | 1 |
| Lung disease | 0 | 2 |
| Graft Loss | 12 | 25 |
| DWFG | 7 | 10 |
| Thrombosis/early AR | 3 | 0 |
| Infection | 1 | 2 |
| Acute Rejection/CAN | 1 | 1 |
| CAN | 0 | 8 |
| Recurrent Disease | 0 | 4 |
| Acute Rejection | 8 (33%) | 6 (13%)^ |
| Malignancy (all) | 5 (21%) | 4 (8%) |
| Malignancy (non-skin) | 4 (17%) | 3 (6%) |
| CMV Infection | 4 (17%) | 9 (19%) |
| CMV Disease | 8 (33%) | 6 (13%) |
| PTLD | 2 (8%) | 0 |
| Serum creatinine, mg/dL | 1.2 ± 0.3 | 1.7 ±0.5^ |
| GFR, ml/min | 65 ±19 | 49 ± 22 |
| WBC, cells/mm3 | 6.7 ±1.3 | 7.1 ± 2. |
| Absolute lymphocyte count, cells/mm3 | 1.3 ±0.5 | 1.5 ± 0.7 |
Mean ± SD
P<0.05
P<0.01
DWFG — death with a functioning graft, AR — acute rejection, CAN — chronic allograft nephropathy, CMV — cytomegalovirus, PTLD — post transplant lymphoproliferative disorder, GFR — glomerular filtration rate, WBC — white blood cell
At 10 years after transplantation, the composite endpoint of freedom from death, graft loss, and rejection, “event-free survival”, was higher with Thymoglobulin (48%) compared to Atgam (29%; P=0.011) [Figure 1]. Actual 10 year graft survival was 48% in the Thymoglobulin group and 50% in the Atgam group, P=NS [Figure 2]. Twenty-five patients suffered graft loss in the Thymoglobulin group for reasons including death with a functioning graft (DWFG), (n=10), chronic allograft nephropathy (n=8), acute rejection and chronic allograft nephropathy (n=1), infection (n=2) and recurrent native kidney disease (n=4). Twelve patients suffered graft loss in the Atgam group for reasons including DWFG (n=7), chronic allograft nephropathy (n=1), early acute rejection/graft thrombosis (n=3), acute rejection/chronic allograft nephropathy (n=1) and urinary tract infection (n=1). Death-censored graft loss was 31% in the Thymoglobulin group and 24% in the Atgam group, P=NS.
Figure 1.
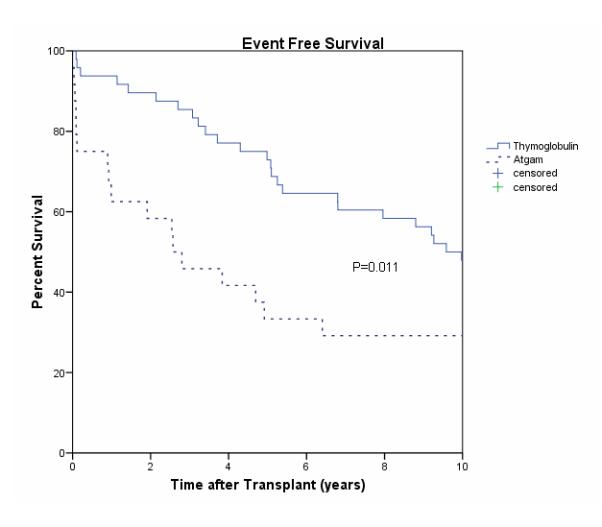
Event Free Survival
Figure 2.

Graft Survival
Rejection and Graft Function
At 1 year after transplantation, Thymoglobulin patients had less acute rejection (4% vs 25%). At 10 years after transplantation there were a total of six episodes of acute rejection in the Thymoglobulin group and eight episodes in the Atgam group (11% vs 42% respectively, P=0.004), [Figure 3]. There were two late (>4 years after transplant) rejections in each group. The mean 10-year serum creatinine of those patients with functioning allografts was higher in the Thymoglobulin group (1.7±0.5 mg/dL, n=23) than in the Atgam group (1.2±0.3 mg/dL, n=12; P=0.003). The estimated GFR tended to be lower in the Thymoglobulin group compared to the Atgam group (49±22 ml/min vs 65 ±19 ml/min, P=0.065).
Figure 3.

Acute Rejection
Safety
The incidence of CMV disease remained less with Thymoglobulin than Atgam at 10 years, with no additional cases after the first year (13% vs 33%; P=0.056). No polyoma nephropathy occurred in either group. Ten-year absolute lymphocyte counts were similar between the groups (1.5 ±0.7 cells/mm3 Thymoglobulin vs 1.3 ±0.5 cell/mm3 Atgam, P=NS ).
Malignancy
Overall there was a lower incidence of non-cutaneous malignancy in the Thymoglobulin group compared to the Atgam group at 10-years of follow-up (6% vs 17%, P=NS). There were no cases of PTLD in the Thymoglobulin group and two in the Atgam group.
Quality Adjusted Life Years
Overall there were 0.53 QALYs (3.68 Thymoglobulin vs 3.15 Atgam) gained from use of Thymoglobulin over Atgam, a 16.7% improvement in QALYs. Table 3 presents the results of the sensitivity analysis which shows Thymoglobulin as superior to Atgam under all variations in assumptions, with percent improvement ranging from 9.1% to 19.6%. The utility weight for graft failure with return to dialysis has the largest impact on percent improvement, changing the utility from 0.45 to 0.60 decreased the percent improvement by as much as 9.3 percentage points. The discount rate has the smallest impact on the percent improvement. Altering it changed the percent improvement by only a fraction of a percent.
Table 3.
Sensitivity analysis for QALY’s gained from T hymo use in 10 year follow-up.
| Utility of Function* |
Utility of GF* |
Discount rate |
Thymo QALYs |
Atgam QALYs |
QALYs gained from Thymo Use |
Percent improvement |
|---|---|---|---|---|---|---|
| 0.7 | 0.57 | 0.05 | 3.68 | 3.15 | 0.53 | 16.74 |
| 0.7 | 0.57 | none | 6.00 | 5.14 | 0.86 | 16.82 |
| 0.7 | 0.57 | 0.02 | 4.92 | 4.21 | 0.71 | 16.74 |
| 0.7 | 0.57 | 0.03 | 4.46 | 3.82 | 0.64 | 16.74 |
| 0.7 | 0.57 | 0.1 | 2.31 | 1.98 | 0.33 | 16.74 |
| 0.7 | 0.45 | 0.05 | 3.61 | 3.05 | 0.56 | 18.44 |
| 0.7 | 0.45 | 0.1 | 2.27 | 1.91 | 0.35 | 18.44 |
| 0.7 | 0.6 | 0.05 | 2.46 | 2.25 | 0.20 | 9.09 |
| 0.7 | 0.6 | 0.1 | 1.54 | 1.41 | 0.13 | 9.09 |
| 0.85 | 0.57 | 0.05 | 4.39 | 3.72 | 0.68 | 18.16 |
| 0.85 | 0.57 | 0.1 | 2.76 | 2.34 | 0.42 | 18.16 |
| 0.85 | 0.45 | 0.05 | 4.32 | 3.61 | 0.71 | 19.63 |
| 0.85 | 0.45 | 0.1 | 2.71 | 2.27 | 0.45 | 19.63 |
| 0.85 | 0.6 | 0.05 | 4.41 | 3.75 | 0.67 | 17.80 |
| 0.85 | 0.6 | 0.1 | 2.77 | 2.35 | 0.42 | 17.80 |
| 0.65 | 0.57 | 0.05 | 3.44 | 2.96 | 0.48 | 16.15 |
| 0.65 | 0.57 | 0.1 | 2.16 | 1.86 | 0.30 | 16.15 |
| 0.65 | 0.45 | 0.05 | 3.37 | 2.86 | 0.51 | 17.94 |
| 0.65 | 0.45 | 0.1 | 2.12 | 1.79 | 0.32 | 17.94 |
| 0.65 | 0.6 | 0.05 | 3.46 | 2.99 | 0.47 | 15.72 |
| 0.65 | 0.6 | 0.1 | 2.17 | 1.88 | 0.30 | 15.72 |
Utility of Death = 0
GF = graft function
QALYs = quality adjusted life years
Immunosuppression
The mean cyclosporine concentrations were similar at 5 years (116± 55 Thymoglobulion vs 138± 52 mg/dL Atgam, P=NS) and 10 years after transplantation (115± 66 Thymoglobulin vs 139± 65 mg/dL Atgam, P=NS). Cyclosporine doses were similar throughout the study period. Five patients were converted to tacrolimus as rescue therapy, one in the Thymoglobulin and 4 in the Atgam group.
DISCUSSION
The long-term results of this double-blinded, randomized study of polyclonal induction demonstrate an advantage in the composite endpoint of freedom from death, graft loss and rejection for Thymoglobulin compared to Atgam. There was also a lower incidence of acute rejection and non-cutaneous malignancy. These benefits were achieved without an increase in the incidence of CMV or PTLD, but the mean serum creatinine level in survivors was higher in the Thymoglobulin compared to Atgam group. The reason for the higher serum creatinine in the Thymoglobulin group is unclear, as the cyclosporine dose and levels were similar.
Patient survival was not significantly different at 10 years. The reasons for late events were different between the groups. In the Thymoglobulin group, 5 patients died due to cardiac causes. In contrast, in the Atgam group one patient died from PTLD. Graft loss was most commonly due to chronic allograft nephropathy in the Thymoglobulin group (n=6) and recurrence of renal disease (n=3), while, all additional grafts losses in the Atgam group occurring between 5 and 10 years were due to DWFG. Two late rejections occurred in each group. The reasons for rejection in the Thymoglobulin group were both noncompliance, while in the Atgam group the reasons were immunologic (anti-donor specific antibodies and iatrogenically-induced inadequate immunosuppression).
Cytomegalovirus prophylaxis was used in all patients that had either a CMV seropositive donor or recipient. The intense prophylaxis may have lead to low rates of CMV infection/disease and a decreased incidence of PTLD (9-11).
The results of the QALY analysis indicate that the benefit provided by Thymoglobulin in this trial was superior to Atgam. While the gain in QALYs may appear to be low, previous studies have indicated that differences of less than one QALY are typical in comparing immunosuppressant therapies (12-16). Our result of 0.53 QALYs gained from using Thymoglobulin over Atgam is considered a clinically significant gain as it equates to over six additional months of perfect health over the 10-year span of the study.
We may have under or overestimated the gain in QALYs as we choose our utility weights from those in published literature that varied across studies. We addressed this limitation by conducting sensitivity analysis using ranges of the utility weights found in the literature. The superiority of Thymoglobulin over Atgam in QALYs was robust across wide variations in assumptions.
To the best of our knowledge, this is the only randomized, double-blinded trial of polyclonal induction therapy with 10 year follow-up. Although the sample size was small the randomized, double-blinded format of the trial and consistent management at a single-center makes the data meaningful. Thus, these long-term data provide information about the risks and benefits of polyclonal induction therapy. The data indicate that Thymoglobulin is superior to Atgam with regards to the triple composite endpoint and QALYs, and appears to be safer with no significant differences in PTLD and viral infection.
Supplementary Material
ACKNOWLEDGEMENTS
This research was supported by T35 DK074375 (SR), K24DK002886 (DCB), P30 DK079333 (DCB), and Genzyme.
References
- 1.Brennan DC, Flavin K, Lowell JA, et al. A randomized, double-blinded comparison of Thymoglobulin versus Atgam for induction immunosuppressive therapy in adult renal transplant recipients. Transplantation. 1999;67(7):1011. doi: 10.1097/00007890-199904150-00013. [DOI] [PubMed] [Google Scholar]
- 2.Hardinger KL, Schnitzler MA, Miller B, et al. Five-year follow up of thymoglobulin versus ATGAM induction in adult renal transplantation. Transplantation. 2004;78(1):136. doi: 10.1097/01.tp.0000132329.67611.3f. [DOI] [PubMed] [Google Scholar]
- 3.Brennan DC, Garlock KA, Singer GG, et al. Prophylactic oral ganciclovir compared with deferred therapy for control of cytomegalovirus in renal transplant recipients. Transplantation. 1997;64(12):1843. doi: 10.1097/00007890-199712270-00036. [DOI] [PubMed] [Google Scholar]
- 4.Brennan DC, Garlock KA, Lippmann BA, et al. Control of cytomegalovirus-associated morbidity in renal transplant patients using intensive monitoring and either preemptive or deferred therapy. J Am Soc Nephrol. 1997;8(1):118. doi: 10.1681/ASN.V81118. [DOI] [PubMed] [Google Scholar]
- 5.Levey AS, Bosch JP, Lewis JB, Greene T, Rogers N, Roth D. A more accurate method to estimate glomerular filtration rate from serum creatinine: a new prediction equation. Modification of Diet in Renal Disease Study Group. Ann Intern Med. 1999;130(6):461. doi: 10.7326/0003-4819-130-6-199903160-00002. [DOI] [PubMed] [Google Scholar]
- 6.Laupacis A, Keown P, Pus N, et al. A study of the quality of life and cost-utility of renal transplantation. Kidney Int. 1996;50(1):235. doi: 10.1038/ki.1996.307. [DOI] [PubMed] [Google Scholar]
- 7.Whiting JF. Standards for economic and quality of life studies in transplantation. Transplantation. 2000;70(7):1115. doi: 10.1097/00007890-200010150-00026. [DOI] [PubMed] [Google Scholar]
- 8.Yao G, Albon E, Adi Y, et al. A systematic review and economic model of the clinical and cost-effectiveness of immunosuppressive therapy for renal transplantation in children. Health Technol Assess. 2006;10(49):iii. doi: 10.3310/hta10490. [DOI] [PubMed] [Google Scholar]
- 9.Funch DP, Walker AM, Schneider G, Ziyadeh NJ, Pescovitz MD. Ganciclovir and acyclovir reduce the risk of post-transplant lymphoproliferative disorder in renal transplant recipients. Am J Transplant. 2005;5(12):2894. doi: 10.1111/j.1600-6143.2005.01115.x. [DOI] [PubMed] [Google Scholar]
- 10.Darenkov IA, Marcarelli MA, Basadonna GP, et al. Reduced incidence of Epstein-Barr virus-associated posttransplant lymphoproliferative disorder using preemptive antiviral therapy. Transplantation. 1997;64(6):848. doi: 10.1097/00007890-199709270-00010. [DOI] [PubMed] [Google Scholar]
- 11.Davis CL, Harrison KL, McVicar JP, Forg PJ, Bronner MP, Marsh CL. Antiviral prophylaxis and the Epstein Barr virus-related post-transplant lymphoproliferative disorder. Clin Transplant. 1995;9(1):53. [PubMed] [Google Scholar]
- 12.Bell C, Graham J, Earnshaw S, Oleen-Burkey M, Castelli-Haley J, Johnson K. Cost-effectiveness of four immunomodulatory therapies for relapsing-remitting multiple sclerosis: a Markov model based on long-term clinical data. J Manag Care Pharm. 2007;13(3):245. doi: 10.18553/jmcp.2007.13.3.245. [DOI] [PMC free article] [PubMed] [Google Scholar]
- 13.Gordois A, Nobes M, Toohey M, Russ G. Cost-effectiveness of sirolimus therapy with early cyclosporin withdrawal vs. long-term cyclosporin therapy in Australia. Clin Transplant. 2006;20(4):526. doi: 10.1111/j.1399-0012.2006.00518.x. [DOI] [PubMed] [Google Scholar]
- 14.Woodroffe R, Yao GL, Meads C, et al. Clinical and cost-effectiveness of newer immunosuppressive regimens in renal transplantation: a systematic review and modelling study. Health Technol Assess. 2005;9(21):1. doi: 10.3310/hta9210. [DOI] [PubMed] [Google Scholar]
- 15.McEwan P, Baboolal K, Conway P, Currie CJ. Evaluation of the cost-effectiveness of sirolimus versus cyclosporin for immunosuppression after renal transplantation in the United Kingdom. Clin Ther. 2005;27(11):1834. doi: 10.1016/j.clinthera.2005.11.002. [DOI] [PubMed] [Google Scholar]
- 16.Doan QV, Chiou CF, Dubois RW. Review of eight pharmacoeconomic studies of the value of biologic DMARDs (adalimumab, etanercept, and infliximab) in the management of rheumatoid arthritis. J Manag Care Pharm. 2006;12(7):555. doi: 10.18553/jmcp.2006.12.7.555. [DOI] [PMC free article] [PubMed] [Google Scholar]
Associated Data
This section collects any data citations, data availability statements, or supplementary materials included in this article.