

Abstract
Economic decision-making involves the weighting of magnitude and probability of potential gains/losses. While previous work has examined the neural systems involved in decision-making, there is a need to understand how the parameters associated with decision-making (e.g., magnitude of expected reward, probability of expected reward and risk) modulate activation within these neural systems. In the current fMRI study, we modified the monetary wheel of fortune (WOF) task (Ernst et al., 2004) to examine in 25 healthy young adults the neural responses to selections of different reward magnitudes, probabilities, or risks. Selection of high, relative to low, reward magnitude increased activity in insula, amygdala, middle and posterior cingulate cortex, and basal ganglia. Selection of low-probability, as opposed to high-probability reward, increased activity in anterior cingulate cortex, as did selection of risky, relative to safe reward. In summary, decision-making that did not involve conflict, as in the magnitude contrast, recruited structures known to support the coding of reward values, and those that integrate motivational and perceptual information for behavioral responses. In contrast, decision-making under conflict, as in the probability and risk contrasts, engaged the dorsal anterior cingulate cortex whose role in conflict monitoring is well established. However, decision-making under conflict failed to activate the structures that track reward values per se. Thus, the presence of conflict in decision-making seemed to significantly alter the pattern of neural responses to simple rewards. In addition, this paradigm further clarifies the functional specialization of the cingulate cortex in processes of decision-making.
The ability to choose between competing actions based on the expected value of possible outcomes is pivotal to goal-directed behavior (Balleine, Doya, O’Doherty, & Sakagami, 2007). In turn, effective, advantageous, decision-making depends on accurate attribution of value to potential outcomes. Three important factors influence the appraisal of values: the magnitude of the possible outcomes; the probability of achieving the outcomes; and the risk that is associated with each choice (see Ernst & Paulus, 2005).
Cognitive neuroscience studies implicate a distributed neural network in the processes involved in decision-making. Neural structures consistently reported in this network include the anterior cingulate cortex (ACC), orbitofrontal cortex (OFC), medial prefrontal cortex (mPFC), amygdala, striatum, insula, and posterior cingulate cortex (PCC) (Ernst & Paulus, 2005). Distinct functions that contribute to decision-making processes have been assigned to the components of this network. For example, the ACC plays a role in detection of conflict and response competition (Carter & van Veen, 2007). The OFC, on the other hand, harbors the representation of reinforcement values (Rolls, 2004), while the insula integrates visceral sensations as they relate to emotion and guide behavior (Craig, 2002).
How the regions in this distributed network collaborate to support representations of magnitude, probability and risk (which are integrated into expected values) and underlie the formation of preference is still under debate. Although a number of studies have separately examined the influence of outcome magnitude or probability on the neural response to anticipation or actual receipt of outcomes (Abler, Walter, Erk, Kammerer, & Spitzer, 2006; Breiter, Aharon, Kahneman, Dale, & Shizgal, 2001; Dreher, Kohn, & Berman, 2006; Elliott, Newman, Longe, & Deakin, 2003; Gottfried, O’Doherty, & Dolan, 2003; Knutson & Cooper, 2005; Tobler, O’Doherty, Dolan, & Schultz, 2007), few studies have actually focused on neural activation during the selection processes that lead to outcomes.
In these studies of decision-making per se, the ventral prefrontal cortex, including the OFC, is the structure most consistently reported to be involved in the influence of reward magnitude on the neural substrates of selection (Arana et al., 2003; Knutson & Bossaerts, 2007; Rogers et al., 2004; Yacubian et al., 2006). These studies have also implicated, although less consistently, amygdala, ACC, PCC, parietal cortex, ventral striatum, and insula. Likewise, the influence of expected values on choice-making has been found on OFC (Rolls, McCabe, & Redoute, 2008; Yacubian et al., 2006) as well as on pregenual ACC and insula (Rolls et al., 2008).
The influence of reward probability or uncertainty on the neural correlates of decision-making has been found to affect mostly the prefrontal cortex, including ACC, posterior frontal medial area (Brodmann Area, BA8) and the parietal cortex (Elliott, Rees, & Dolan, 1999; Koechlin, Corrado, Pietrini, & Grafman, 2000; Volz, Schubotz, & von Cramon, 2003, 2005). On the other hand, risky choices reportedly engage structures involved in: (1) reward magnitude, such as OFC and striatum (Cohen, Heller, & Ranganath, 2005; Ernst et al., 2004; Krain et al., 2007; Rogers et al., 1999); (2) reward probability, such as parietal cortex (Huettel, Stowe, Gordon, Warner, & Platt, 2006); and (3) those involved in both probability and magnitude, such as insula (Preuschoff, Quartz, & Bossaerts, 2008). None of these studies, however, have examined within the same paradigm the influence of each of these three factors, magnitude, probability and risk, on the neural correlates of choice-making.
The goal of the present study was to fill this gap. To this aim, the Wheel of Fortune task (WOF) (Ernst et al., 2005; Ernst et al., 2004; Eshel, Nelson, Blair, Pine, & Ernst, 2007) was modified to allow comparison of selections based on: (1) different reward magnitudes when the probability of winning was held constant; (2) different probabilities of winning when reward magnitude was held constant; and (3) different levels of risk when the expected value was held constant. The overall approach was first to test the general pattern of activation associated with each of these three factors, and then to more selectively examine whether activated regions also contributed to the processing of related factors of value, such as magnitude to expected value, probability to risk, and risk to probability.
Based on the previous literature, three main hypotheses were tested. First, manipulations of magnitude were expected to engage amygdala, medial OFC, anterior insula, PCC and ventral striatum, as these regions have previously been associated with reward magnitude during anticipation (Arana et al., 2003; Elliott et al., 2003; Hommer et al., 2003; Knutson, Fong, Bennett, Adams, & Hommer, 2003; Kosson et al., 2006; Paulus, Rogalsky, Simmons, Feinstein, & Stein, 2003). In addition, these regions were also hypothesized to be modulated by expected value.
Second, the manipulation of probability was predicted to engage ACC, middle frontal cortex (BA 8) and parietal cortex. These predictions were based on the proposed roles for the ACC in conflict detection (Botvinick, Cohen, & Carter, 2004; Carter et al., 1998; Ridderinkhof, van den Wildenberg, Segalowitz, & Carter, 2004), for the middle frontal (BA8) activity in coding less predictable choices (Koechlin et al., 2000; Volz et al., 2003, 2005) and for the parietal cortex in representations of probability (Ernst et al., 2004; Ernst & Paulus, 2005). These regions were also expected to respond at least partly to risk.
Third, the manipulation of risk was expected to recruit, in an integrated manner, regions associated with both the representation of reward magnitude and probability, as well as those implicated in conflict monitoring. These expected regions of involvement include OFC, parietal cortex, ventral striatum, and ACC (Cohen et al., 2005; Cohen & Ranganath, 2005; Ernst et al., 2002; Ernst et al., 2004; Rogers et al., 1999). We also predicted that these regions would be sensitive to low probability.
Methods
Subjects
Twenty-five healthy participants (12 women and 13 men; mean an age 29.1; SD = 5.5) completed the study, which was approved by the National Institute of Mental Health Institutional Review Board. All subjects were in good health with no past history of psychiatric or neurological disease. Subjects’ screening consisted of a physical examination, a medical review of systems, and a psychiatric interview. The Structured Clinical Interview for DSM IV (SCID) (First et al., 1997) was conducted to rule out current or past history of psychiatric illness, or drug/alcohol abuse or dependency. All subjects provided written informed consent.
Wheel of Fortune Task
The Wheel of Fortune task (WOF) is a computerized two-choice decision-making task involving probabilistic monetary outcomes (Ernst et al., 2004). Although participants performed two versions of the task: a winning version, in which they could either win or not win money, and a losing version, in which they could either lose or not lose money, only the winning version was analyzed because of the specific focus on reward processes.
The task comprised two winning blocks of 96 trials each. Participants were given the net cumulative dollar amount won after completing the task (M = $88.75, SD = $9.70). For each trial, participants were presented with a wheel divided into two slices (options), one blue colored and one magenta colored. They were instructed to select one of these two options. The blue slice represented 75% of the wheel, and the magenta slice 25% of the wheel. The side of the color (left vs. right) was counterbalanced and presented in a random order.
Two types of wheels were used (see Figure 1). In one type, wheels presented the following two options: a high-probability/low-magnitude reward option vs. a low-probability/high-magnitude reward option. In the other type, the two options were a high-probability/high-magnitude reward option vs. a low-probability/low-magnitude reward option.
Figure 1.

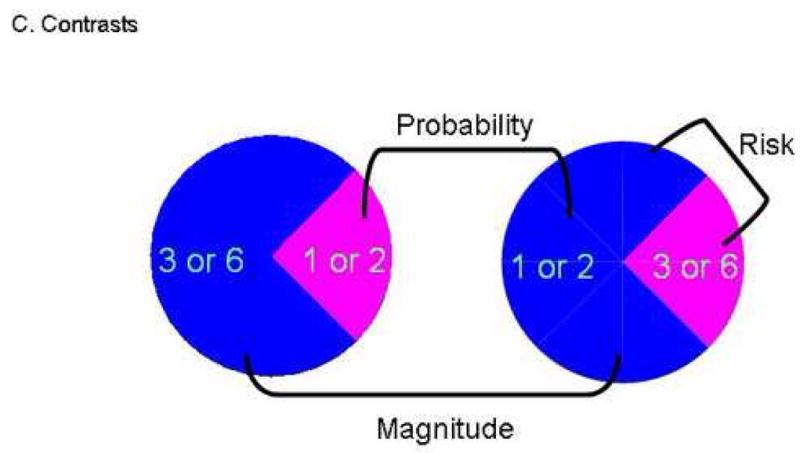
The wheel of fortune task.
A. The four task stimuli comprise two types of wheel. In one type, the wheels present the options of a high-probability/high-magnitude reward (high-prob./high-mag.) vs. a low-probability/low-magnitude reward (low-prob./low mag.). In the other type, the two options are a high-probability/low-magnitude (high-prob./low mag.) reward vs. a low-probability/high-magnitude reward (low-prob./high mag.).
B. Example of a single task trial. Analyses focused on brain activation during the 4 s of the selection period.
C. The three main contrasts are made explicit in this figure: The magnitude contrast compares the selection of the high-probability/high-magnitude option vs. the high-probability/low-magnitude option. The probability contrast compares the selection of the high-probability/high-magnitude option vs. the low-probability/high-magnitude option. The risk contrast compares the selection of the high-probability/low-magnitude option vs. the low-probability/high-magnitude option.
For each type of wheels, two different high amounts were used ($6 and $3) and two different low amounts were used ($2 and $1). These two $ amounts were used to introduce variability in the task, and were not analyzed separately. In other words, the “high-reward magnitude” condition pooled together the $3 and $6 options, and the “low-reward magnitude” condition pooled together the $1 and $2 options.
Procedures
The study involved two phases including training for the task before entering the MRI scanner and performing the task in the scanner. For the training phase, participants used a 3-dimensional wheel of fortune with wheels identical to those that were presented on the computer screen in the scanner. The participants selected one of the two slices and the wheel was spun. The wheel stopped under a pointer indicating the winning slice. The participant was told that the computer version of the task operated under the same principle, except that the spinning wheel was not visible on the computer screen.
After training, participants were placed in the MRI scanner. They performed two seven-minute runs, in which they were presented with 96 trials in random order. Each of the four wheels (Figure 1) was presented 16 times. A control wheel (directed choice without incentive, with the instruction “press the button corresponding to the wheel that contains the ‘X’), and fixation periods were also used to serve as baseline. The control wheels were presented 32 times and a fixation cross was presented 30 times for 4000 ms. All trial types and fixation intervals were fully randomized for each participant.
Each trial included a 4 s selection phase, during which one of the wheels was presented, and a 1 s feedback phase. Trials were separated by an interval of an average duration of 0.5 s (jittered between 0 and 1 s). During the feedback phase, a screen indicated whether the participant won the amount of money attached to the option that they selected. After each run, participants were shown the cumulative dollar amount won up to that point.
The study design yielded four event types based on the type of selection (see Figure 1): (1) the selection of a 75% chance of receiving a high-reward; (2) the selection of a 75% chance of receiving a low-reward; (3) the selection of a 25% chance of receiving a high-reward; and (4) the selection of a 25% chance of receiving a low-reward (a very rarely occurring selection). The analysis focused on the 4 s selection phase of each trial.
fMRI Data Acquisition
Participants were scanned during task performance using a 3 Tesla GE Signa scanner (Milwaukee, WI) equipped with a standard GE send/receive head coil. Gradient-echo, echo-planar volumes were acquired with TR of 2.5 s, TE of 23 ms (flip angle = 90°; FOV = 24 cm, acquisition matrix 64 × 64) synchronized with the stimulus presentation. Each volume contained 30 axial slices (thickness = 3.3 mm, in-plane resolution = 3.75 × 3.75 mm). A high resolution anatomical scan (three-dimensional Spoiled GRASS; repetition time = 8.1ms, echo time = 3.2 ms; field of view = 24cm; flip angle = 20°; 124 axial slices; thickness = 1.0 mm; 256 × 256 matrix) in register with the EPI dataset was also obtained covering the whole brain.
Data Analysis
The MRI data were analyzed within the framework of the general linear model using the Analysis of Functional Imaging (AFNI) software (Cox, 1996). Both individual- and group-level analyses were conducted. The first six volumes in each scan series, collected before equilibrium magnetization was reached, were discarded. Motion correction was performed by registering all volumes in the EPI dataset to a volume collected shortly before acquisition of the high resolution anatomical dataset.
The EPI datasets for each subject were spatially smoothed (using an isotropic 6mm Gaussian kernel) to reduce the influence of anatomical variability among the individual maps in generating group maps. Next, the time series data were normalized by dividing the signal intensity of a voxel at each time point by the mean signal intensity of that voxel for each run and multiplying the result by 100. Resultant regression coefficients represented a percent signal change from the mean. Following this, four regressors of interest (the selection of a 75% chance of receiving high-reward, a 75% chance of receiving low-reward, a 25% chance of receiving high-reward and a 25% chance of receiving low-reward) were created by convolving the train of stimulus events with a gamma-variate hemodynamic response function to account for the slow hemodynamic response (Cohen, 1997). Linear regression modeling was performed using the four regressors of interest plus regressors to model a first order baseline drift function. This produced a beta coefficient and associated t-statistic for each voxel and each regressor.
Two types of analysis were conducted. First, whole brain, voxel-wise group analyses identified the overall pattern of activation in each contrast of interest. Second, based on a priori hypotheses, functional regions of interest (ROIs) were identified from these whole brain analyses and submitted to further ROI analyses.
Voxel-wise group analyses
Voxel-wise group analyses involved transforming single subject beta coefficients into the standard coordinate space of Talairach and Tournoux (1988). This was followed by three two-sample random effects t-tests contrasting the beta coefficients for: (1) a magnitude contrast in which we compared 75% probability choices of high-reward to 75% probability choices of low-reward; (2) a probability contrast in which we compared 25% probability choices of high-reward to 75% probability choices of high-reward; and (3) a risk contrast in which we compared 25% probability choices of high-reward to 75% probability choices of low-reward. In the magnitude contrast, the magnitude of the potential reward varied while the probability of winning remained constant. In the probability contrast, the probability of winning varied while the magnitude of the potential reward remained constant. Finally, in the risk contrast, both the probability and reward varied proportionately so that the expected value (EV = probability * magnitude) remain constant (e.g., 25% chance of winning $3: EV = 3 * 0.25 = 0.75 and 75% chance of winning $1: EV = 1 * 0.75 = 0.75).
These analyses produced group maps of regional brain activations. In order to maintain similar variability among participants and statistical power, data from participants who made less than eight trials for any one of the three conditions of interest (75% chance of receiving low-reward; 25% chance of receiving high-reward; 75% chance of receiving high reward) were excluded. Thus, 25 participants were included in the magnitude contrast, 17 participants were included in the probability contrast (low-probability of high-reward vs. high-probability of high-reward), and 17 participants were included in the risk contrast (low-probability of high-reward vs. high-probability of low-reward). Because of the differences in sample size between the contrasts and to equalize statistical power across analyses, we set p <.001 for the magnitude contrast and p <.005 for the probability and risk contrasts. These uncorrected P values were used to create maps of activated clusters. The next step examined whether these clusters remained significant after correction for multiple tests. To do this, we used the Monte Carlo simulation method. We performed a spatial clustering operation using AlphaSim with 1,000 Monte Carlo simulations taking into account the entire EPI matrix. (p <0.05). This method identified clusters (> 400mm3) that remained statistically significant using a threshold of Pcorrected < 0.05.
Functional ROI analyses
We used functional regions of interest (ROIs) to further assess the roles of our a priori selected regions. Specifically, we examined how regions activated by magnitude were also modulated by expected values; how regions activated by probability were also modulated by risk; and how regions activated by risk were also modulated by probability. Functional ROIs consisted of the subsets of clusters showing significant differential activation within each contrast. The labeling of anatomical locations was determined by the Talairach-Tournoux Daemon and upon visual examination.
Correlations of BOLD signal changes with risk-taking performance score and sex
Finally, we extracted the mean values of BOLD signal changes from selected ROIs that showed significant activations in the magnitude, probability and risk contrasts, and entered these values into correlation analyses with an index of risk taking. This index was the individual percent of risky options selected by each participant. In addition, for completeness, we examined sex effect on these BOLD signal measures. Statistical threshold was set at P < 0.05 for significance.
Results
Behavioral Data
Participant selection frequencies and reaction times are presented as means ± SD in Table 1. Performance analyses were conducted using repeated measures ANOVAs. With regard to the magnitude contrast, the reaction times for the selection of high-reward options were significantly shorter than selections of low-reward options, F(1, 24) = 62.5; p<0.0001. In addition, the percent selection of high-reward was significantly higher than that of low-reward, F(1,24)=54.5, p<0.0001.
Table 1.
Frequencies (% selected ±SD), reaction times (ms; mean ±SD), and significances of each type of selections.
| OPTION | Percent selected (%) | Mean RT |
|---|---|---|
| high probability of high reward option | 94.75 ± 9.87 | 1175.71 ± 276.6 |
| high probability of low reward option | 63.37 ± 21.97 | 1492.83 ± 258.15 |
| low probability of high reward option | 49.08 ± 17.53 | 1644.71 ± 309.14 |
With regard to the probability contrast, reaction times for the selection of low-probability options were significantly longer than those of the high-probability options, F(1, 16) = 68.2; p < 0.0001. Similarly, the frequency of selection of high-probability was significantly higher than that of low-probability, F(1,16)=64.2, p<0.0001.
Finally, with respect to the risk contrast, the reaction times for the selection of risky options (low-probability of high-reward) were significantly longer than that of the safe options (high-probability of low-reward), F(1,16)=6.6, p=0.02. However, the percent selection did not differ significantly between these options, F(1,16)=0.16, p=0.69.
Overall, performance scores reflected significant modulation of responses by magnitude, probability and risk. The least preferred (low-reward options; low-probability) and most conflictual (risky options) options were chosen with a longer reaction time than their counterparts.
fMRI Data
Magnitude
In the magnitude contrast, we examined BOLD responses to high-reward (75% chance of winning [$3 or $6]) relative to low-reward selections (75% chance of winning [$1 or $2]). This contrast revealed significantly greater BOLD responses in high-magnitude as opposed to low-magnitude selections within bilateral insula, right globus pallidus and left substantia nigra (see Table 2). These latter two activations included bilateral activity in the amygdala. Although not activated at a corrected statistical threshold, the medial OFC was recruited at uncorrected threshold and a functional ROI could be examined in this region (see below). In addition, BOLD responses were detected in left middle temporal gyrus and two regions of the posterior cingulate cortex. Using the terminology suggested by Volz et al. (2005), these posterior cingulate regions can be referred to as a posterior region of the mid-cingulate cortex (Talairach coordinates, x,y,z: −1, −13, 44) and a dorsal region of posterior cingulate cortex (Talairach coordinates, x,y,z: −5, −52, 25). Finally, in contrast to predictions, no activation was detected in the ventral striatum.
Table 2.
Regions showing greater BOLD for high-magnitude rather than low-magnitude selections.
| Region | L/R | BA | x | y | z | Volume |
|---|---|---|---|---|---|---|
| Posterior Cingulate Gyrus | L | 23 | −5 | −52 | 25 | 700 |
| Cingulate Gyrus | L | 24 | −1 | −13 | 44 | 607 |
| Medial frontal cortex# | R | 10 | 7 | 54 | 16 | 378 |
| orbitofrontal cortex | ||||||
| Middle Temporal Gyrus | L | 22 | −57 | −52 | 4 | 1254 |
| Insula | L | −28 | −2 | 23 | 668 | |
| Insula | R | 38 | −7 | −5 | 460 | |
| Globus Pallidus# | R | 23 | −14 | −10 | 288 | |
| Amygdala+ | R | 22 | −5 | −15 | 547 | |
| Substantia Nigra# | L | −16 | −18 | −7 | 240 | |
| Amygdala+ | L | −23 | −6 | −13 | 349 | |
Note. p <.001 and corrected for multiple comparisons (p <0.05) unless otherwise stated;
did not survive correction for multiple comparisons.
Volume within anatomical ROI at p < 0.05.
To determine whether the regions implicated in processing magnitude were also involved in processing expected value (EV = magnitude × probability) information, we used functional ROIs from the magnitude condition to contrast high with low EV conditions. We computed the high EV (high-probability of high-reward) vs. low EV (low-probability of high-reward) contrast on the functional ROIs identified in medial OFC, amygdala and insula (see Figure 2). BOLD responses were significantly higher for high EV than for low EV in left medial OFC, right insula and left amygdala (p < 0.05), and at a trend level in left insula and right amygdala. Overall, these findings suggest that the regions sensitive to reward magnitude also track the EV of selected options.
Figure 2.
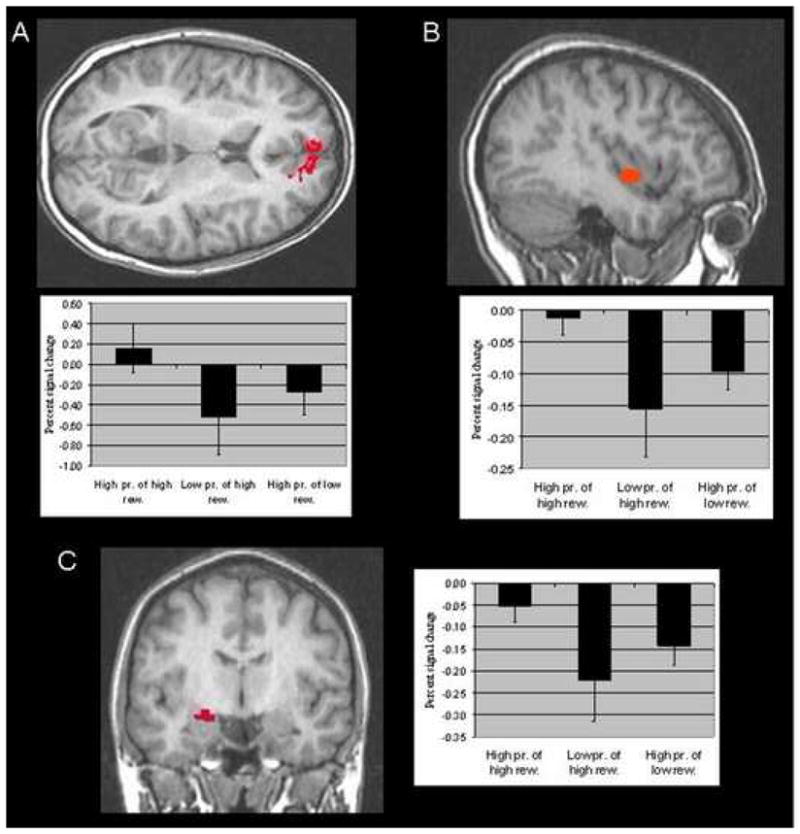
Areas activated by the magnitude contrast and percent signal changes from baseline within these regions: High-magnitude vs. low-magnitude reward selections with probability held constant. Activations are shown for: (A) medial OFC (7, 54, 16); (B) right insula (38, −7, −5); and (C) left amygdala (−23, −6, −13) (see Table 2). The associated percent signal changes from baseline for each of these regions are shown immediately beneath for A and B and on the right for C.
Probability
In the probability contrast, we examined BOLD responses to low-probability selections (25% chance of winning $3 or $6) relative to high-probability selections (75% chance of winning $3 or $6). This contrast revealed significantly greater activation in low-probability relative to high-probability selections within both middle frontal gyrus (BA 8/9) and ACC (Talairach coordinates, x,y,z: 1,21, 45; an anterior region of mid-cingulate cortex when using the terminology of (Vogt, 2005)); see Table 3. In contrast to predictions, the parietal cortex was not engaged in this contrast.
Table 3.
Regions showing greater BOLD for low vs. high-probability selections and “risky” vs. “safe” selections.
| Region | L/R | BA | x | y | z | Volume |
|---|---|---|---|---|---|---|
| Low vs. High-probability selections | ||||||
| Cingulate Gyrus | R | 32 | 1 | 21 | 45 | 3918 |
| Middle Frontal Gyrus | L | 8/9 | −34 | 29 | 42 | 569 |
| “Risky” vs. “Safe” selections | ||||||
| Cingulate Gyrus# | L | 32 | −4 | 22 | 44 | 278 |
| Intraparietal Lobule# | R | 40 | −55 | −46 | 40 | 177 |
Note. p <.005;
did not survive correction for multiple comparisons.
To determine whether the regions implicated in processing probability were also involved in processing risk information, we used the functional ROIs from the probability condition to contrast high-risk vs. low-risk conditions. We thus computed the risk contrast on the functional ROIs identified in ACC and middle frontal gyrus (BA 8) (see Figures 3 and 4). BOLD responses within these functional ROIs were significantly greater for risky selections (25% chance of winning high-reward) than for safe selections (75% chance of winning low-reward) in ACC and at a trend level in middle frontal gyrus (p < 0.05 and p < 0.06 respectively).
Figure 3.

Regions of significant activation within the cingulate gyrus and percent signal changes from baseline within these regions. Activations are shown for: (A) Magnitude contrast: regions of mid-cingulate gyrus and posterior cingulate which showed significantly greater BOLD responses when making selections associated with higher magnitude rather than lower magnitude rewards (−1, −13, 44 and −5, −52, 25 respectively) (Table 2); (B) Probability contrast: cingulate gyrus which showed significantly greater BOLD responses when making lower probability as opposed to higher probability selections (1, 21, 45) (Table 3); (C) Risk contrast: cingulate gyrus which showed significantly greater BOLD responses when making ‘risky’ as opposed to ‘safe’ selections (−4, 22, 44) (Table 3). The associated percent signal changes from baseline for each of these regions are shown immediately to the right or beneath the brain slices.
Figure 4.
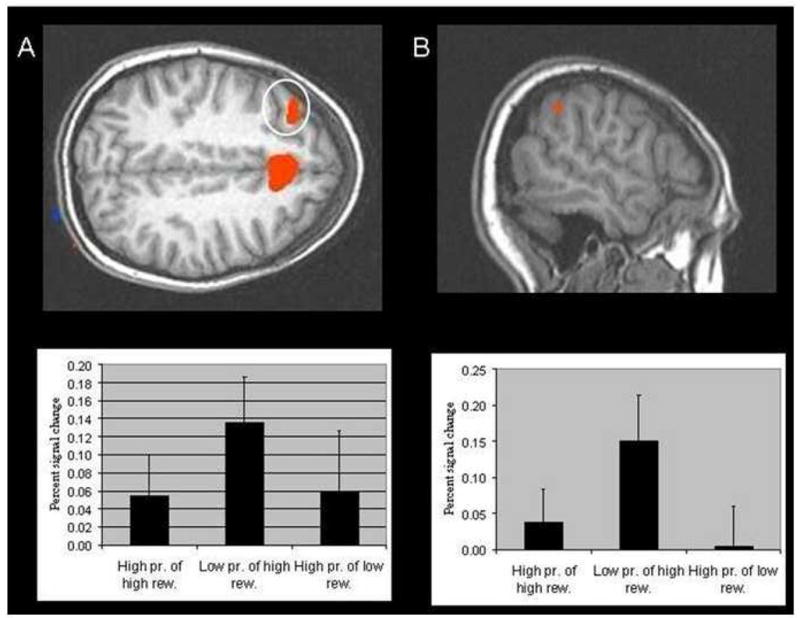
(A) Region of middle frontal gyrus activation (−34, 29, 42) showing greater BOLD responses for low-probability as opposed to high-probability selections (Table 3); (B) Region of intraparietal lobule (−55, −46, 40) that showed greater BOLD responses for ‘risky’ as opposed to ‘safe’ selections (Table 3). The associated percent signal changes from baseline for each of these regions are shown immediately beneath.
Risk
The risk contrast compared BOLD responses to the selection of risky options (low-probability/high-reward trials; 25% chance of winning $3 or $6) relative to safe options (high-probability/low-reward trials; 75% chance of winning $1 or $2). This contrast revealed significantly greater activation during risky than safe selections in the ACC (Talairach coordinates, x,y,z: −4,22,44; posterior mid-cingulate cortex; and intraparietal cortex) (see Table 3). However, these activations did not survive correction for multiple comparisons. In contrast to predictions, neither OFC nor ventral striatum were engaged in this contrast.
To determine whether the regions implicated in processing risk were also involved in processing probability (uncertainty) information, we used the functional ROIs from the risk condition to contrast low-probability vs. high-probability conditions. We hence carried a probability contrast (25%/high-reward vs. 75%/high-reward) on the functionally defined ROIs in the ACC and intraparietal cortex (see Figure 4). Both ROIs were significantly activated in this probability contrast (low-probability > high-probability).
fMRI data and individual differences
Risk taking
Extracted values of the BOLD signal changes in ROIs activated by the magnitude, probability or risk revealed no significant correlations with the individual rate of risky selections (percent of times a risky option was selected).
Sex
Similarly, sex was not correlated with any of the BOLD signal measures.
Discussion
The current study examined the neural correlates of three important aspects of decision-making within a single paradigm: (1) the magnitude of reward associated with a particular decision; (2) the probability that a reward will be forthcoming; and (3) the risk associated with a given selection.
In line with predictions, selections of larger relative to smaller rewards activated more strongly the medial PFC (including medial OFC), posterior cingulate cortex, bilateral amygdala, and bilateral insula. With regard to probability, low-probability decisions relative to high-probability decisions were associated with increased BOLD responses in the ACC. Both high-risk and low-probability selections elicited activity in similar regions of the ACC. The role of the cingulate cortex appears to be critical to the coding of the key elements of economic decision-making examined in this study. In contrast, activation of the ventral striatum was not detected, although regions of the dorsal striatum were recruited. This might reflect a lesser engagement of the more affective part of the striatum in the type of economic decision-making examined herein. We will first comment on the overall pattern of activation related to magnitude, probability and risk, and then we will focus the discussion on the role of the cingulate cortex in the various aspects of decision-making.
General patterns of activation
With respect to the role of reward magnitude, previous studies examining neural response to rewarded outcomes in the context of decision-making have frequently reported greater medial OFC, striatal and amygdala activation to larger relative to smaller rewards (Akitsuki et al., 2003; Bush et al., 2002; Elliott et al., 1999; Ernst et al., 2002; Ernst et al., 2005; Ernst et al., 2004; Rogers et al., 2004). Consistent with previous reports, in the current study the medial OFC, bilateral amygdala, and basal ganglia exhibited stronger activation when participants selected options with larger reward magnitudes in the context of invariant probability.
Additionally, insula showed bilateral activation during larger magnitude selections. The insula has been implicated in the assessment and action selection components of decision-making (Paulus, 2005). This structure has also been traditionally associated with the coding of negative rather than positive states in response to aversive stimuli such as facial expression of disgusts (Phillips et al., 2004; Phillips et al., 1998), pain (Craig, Chen, Bandy, & Reiman, 2000), or monetary losses (Paulus et al., 2003). In the present paradigm, the decision to select an option of potential high-reward was also carrying the possibility of missing the receipt of this high-reward. It is possible that the insula reflected this potential high negative outcome. Yet again, the insula, which is recognized as a key integrator of autonomic activity (Craig, 2004; Nagai, Goldstein, Critchley, & Fenwick, 2004) may have reflected greater autonomic response during the selection of high- compared to low-reward options.
With respect to the role of probability and risk, the current paradigm engaged regions involved in cognitive control (ACC). In addition, in contrast to our predictions, subcortical limbic structures (i.e., ventral striatum, amygdala) were not detected in the modulation of probability or risk. This pattern of activation suggested that our paradigm, particularly during the manipulation of risk and probability, specifically challenged cognitive processes rather than affective processes. This is consistent with the general task context which emphasized choice selection rather than choice outcome.
Cingulate cortex in decision-making
A major finding of this work is the significant contribution of the cingulate cortex to the various parameters of decision-making, but with a distinct functional somatotopy along an anterior-posterior axis (see Figure 3). Specifically, the dorsal regions of the ACC (dACC, BA 24/32) showed modulation related to reward probability and risk, whereas the mid-cingulate cortex (mACC, BA 24) and posterior cingulate cortex (PCC, BA 23) were modulated by reward magnitude. These cingulate cortex findings contribute to an ongoing debate regarding the role of the dACC in conflict monitoring (Carter et al., 1998) rather than reward coding (Bush et al., 2002), and the PCC in motivated behavior rather than sensory promotion of action (Kable & Glimcher, 2007; McCoy & Platt, 2005).
The posterior regions of the cingulate cortex showed significant activation related to the magnitude, and not to the probability or risk of selected options. Previous work has shown that the posterior cingulate cortex is consistently recruited by emotional stimuli (Maddock, Garrett, & Buonocore, 2003; Nakic, Smith, Busis, Vythilingam, & Blair, 2006) and shows increased activity as a function of learning during performance of a passive avoidance task (Kosson et al., 2006). The two regions identified in the current study can be considered posterior mid-cingulate cortex (pMCC) and dorsal posterior cingulate cortex (dPCC) (Vogt, 2005). It has been argued that both pMCC and dPCC contribute to spatial body orientation in response to sensory stimuli (Vogt, 2005). The dPCC, in particular, has been suggested to link motivational outcomes with eye movements (McCoy & Platt, 2005). It is possible that the increased activation in pMCC and dPCC to choices of larger reward magnitude reflected a stronger link of selection to action (including eye and skeletomotor movements (Vogt, 2005), implying a role of this region in motivation for action.
In contrast, the cingulate activity related to the probability of a choice and the associated risk tended to fall in a dorsal region of ACC. The dACC has been implicated as a key region in the coding of various components contributing to the selection of an action (Bush et al., 2002; Ridderinkhof et al., 2004; Rogers et al., 2004; Walton, Devlin, & Rushworth, 2004; Williams, Bush, Rauch, Cosgrove, & Eskandar, 2004). Rogers and colleagues (2004) reported this area to be involved in deliberating over choices involving large compared to small gains. Other reports suggest a role of dACC in rule-governed behavior. For example, increased dACC activity has been reported when subjects freely choose a new rule (Walton et al., 2004), or when changes in reward suggest that the participants should modify their behavioral response (Bush et al., 2002; Williams et al., 2004). Not only did these latter studies supported a role of dACC in conflict, but they also showed that this function was present even without a reward component
In the current paradigm, the dACC showed a greater response when participants made choices associated with an unlikely rather than likely reward (25% rather than 75% chance of winning). Consistent with this finding, studies examining probability in the context of “guess”, “certainty”, or “predictability” have also found increased dACC/dorsomedial prefrontal cortical activity in the lower probability conditions (Elliott et al., 1999; Koechlin et al., 2000; Volz et al., 2003, 2005). These same studies also reported that choices in the context of greater uncertainty engaged the middle frontal cortex (BA 8) (Koechlin et al., 2000; Volz et al., 2003, 2005).
While there have been suggestions that dACC responds to reward information (Rogers et al., 2004), the current results are consistent with previous reports that suggest a role of dACC in conflict monitoring (e.g., Botvinick et al., 2004; Carter et al., 1998; Ridderinkhof et al., 2004). The peak activations seen here for ”low-probability” and ”risky” choices lay between the cingulate and paracingulate sulci, the region most commonly implicated in conflict monitoring (Botvinick et al., 2004). As such, these peaks lie close to activations reported in investigations of conflict monitoring during Stroop tasks (Kerns et al., 2004; van Veen & Carter, 2005). Moreover, they are proximal to activations reported in the context of other decision-making tasks that manipulated response/conflict competition (Blair et al., 2006; Marsh, Blair, Vythilingam, Busis, & Blair, 2007).
The greatest dACC activation occurred when participants were making a “risky” decision and chose a low-probability of high-reward, rather than the “safe” option of a high-probability of low-reward. In short, we suggest that the decision to select the risky option was associated with increased response conflict, which recruited the ACC (e.g., Blair et al., 2006). It is worth reconsidering Rogers and colleagues (2004) findings in this light. In the decision-making task used by Rogers and colleagues (2004), the gamble choices associated with larger rewards also carried with them the possibility of larger punishments (point loss); low-reward gamble options associated with high punishment were unlikely to be chosen. We suggest that the increased dACC engagement in the high-reward choices was related to the greater level of conflict. These choices were associated with a strongly activated approach tendency to the experimental gamble (due to the high-reward) as well as, a strongly activated avoidance tendency to the experimental gamble induced by the high potential punishment.
Limitations
A number of limitations need to be addressed. First, as anticipated, task performance revealed choice preferences, evidenced as shorter reaction times and higher rates of selection (high-probability/high-magnitude > high-probability/low-magnitude > low-probability/high-magnitude). This raises the issue of the possible confound related to performance. Findings could be an epiphenomenon of performance differences, such as discrepancies in effort to complete the task rather than in the recruited cognitive processes. The arguments against such interpretation of a non-specific effect (e.g., effort) include (1) the different patterns of activation among contrasts, particularly between the magnitude contrast and both probability and risk contrasts, and (2) the consistency of the findings with the a priori hypotheses based on previous work.
Parametric designs that vary the level of factors under study (e.g., magnitude, probability, or risk) represent an optimal approach to link activation to function. Unfortunately, this type of design requires a large number of trials to permit a reliable analysis of the different levels of each factor, and hence is difficult to implement when the goal is to assess three different factors. In fact, the number of repeated trials in the current task was relatively small (n=16 on average), limiting the power to detect significant findings. Despite this limitation, this study provided findings in line with the literature, and reveal new data to examine in the future with more powerful task designs.
Second, the activations seen in the magnitude and probability contrasts could reflect differences in expected value (EV = actual value × probability of occurrence) rather than modulation by magnitude or probability. On closer examination, the magnitude contrast compared options of high EV (e.g., 75% * $6) vs. low EV (e.g., 75% * $2), and the probability contrast compared options of low EV (e.g., 25% * $6) vs. high EV (e.g., 75% * $6). In short, while the conditions in the magnitude and probability contrasts differed in EV, these differences were the inverse of each other. If EV was playing a consistent role in the current data, we must predict that at least some of the magnitude contrast results would be the inverse of the probability contrast results. This, however, was not the case.
A third caveat relates to the temporal parameters of the task, which did not permit the clear distinction of BOLD responses associated with decision-making as opposed to reward expectancy or feedback. Indeed, the two sub-processes of selection phase and outcome phase were, by necessity, systematically temporally paired. It is thus difficult to rule out a potential bleeding effect of the BOLD signal associated with the outcome phase into that of the subsequent selection phase. However, previous work has suggested that at least some of these regions (medial OFC, amygdala) are implicated in reward expectations (Schoenbaum, Chiba, & Gallagher, 1999; Schoenbaum & Roesch, 2005) or reward-based visuospatial biases during orienting (McCoy & Platt, 2005). We suggest that these regions are involved in the coding of information that helps to refine future reinforcement expectancies, which are used for adjusting appropriate approach (or avoidance) responses to stimuli (Blair et al., 2006). Ultimately, to address this caveat, paradigms that permit the clear dissociation of hemodynamic cerebral responses to the different phases of decision-making will need to be implemented.
Conclusion
In conclusion, this study parses out the neural correlates of magnitude, probability and risk during economic decision-making. Selections associated with larger rather than smaller rewards (where probability was held constant) recruited regions that are responsive to reinforcement (e.g., insula, medial OFC, amygdala) and regions that are implicated in linking reinforcement to the subject’s responses (pMCC and dPCC). The dACC showed significantly greater activation to selections associated with smaller rather than larger probability of reward, as well as “risky” rather than “safe” selections. We suggest that low-probability of reward and “risky” choices are associated with considerable response conflict, which requires resolution by dACC before a response can be made. This study suggests a prominent role of the cingulate cortex, showing some regional functional specialization that could contribute to different aspects of impaired decision-making. Studies with a priori hypotheses need to be conducted to further characterize these functions in the context of decision-making.
Acknowledgments
This research was supported by the National Institute of Mental Health Intramural Research Program. We wish to thank Ellen Condon for her assistance with data collection.
This research was supported by the Intramural Research Program of the NIH, NIMH. We wish to thank Ellen Condon for her assistance with data collection.
Footnotes
Publisher's Disclaimer: This is a PDF file of an unedited manuscript that has been accepted for publication. As a service to our customers we are providing this early version of the manuscript. The manuscript will undergo copyediting, typesetting, and review of the resulting proof before it is published in its final citable form. Please note that during the production process errors may be discovered which could affect the content, and all legal disclaimers that apply to the journal pertain.
References
- Abler B, Walter H, Erk S, Kammerer H, Spitzer M. Prediction error as a linear function of reward probability is coded in human nucleus accumbens. Neuroimage. 2006;31(2):790–795. doi: 10.1016/j.neuroimage.2006.01.001. [DOI] [PubMed] [Google Scholar]
- Akitsuki Y, Sugiura M, Watanabe J, Yamashita K, Sassa Y, Awata S, et al. Context-dependent cortical activation in response to financial reward and penalty: an event-related fMRI study. Neuroimage. 2003;19(4):1674–1685. doi: 10.1016/s1053-8119(03)00250-7. [DOI] [PubMed] [Google Scholar]
- Arana FS, Parkinson JA, Hinton E, Holland AJ, Owen AM, Roberts AC. Dissociable contributions of the human amygdala and orbitofrontal cortex to incentive motivation and goal selection. J Neurosci. 2003;23(29):9632–9638. doi: 10.1523/JNEUROSCI.23-29-09632.2003. [DOI] [PMC free article] [PubMed] [Google Scholar]
- Balleine BW, Doya K, O’Doherty J, Sakagami M. Current trends in decision making. Ann N Y Acad Sci. 2007;1104:xi–xvs. doi: 10.1196/annals.1390.2226. [DOI] [PubMed] [Google Scholar]
- Blair K, Marsh AA, Morton J, Vythilingam M, Jones M, Mondillo K, et al. Choosing the lesser of two evils, the better of two goods: specifying the roles of ventromedial prefrontal cortex and dorsal anterior cingulate in object choice. J Neurosci. 2006;26(44):11379–11386. doi: 10.1523/JNEUROSCI.1640-06.2006. [DOI] [PMC free article] [PubMed] [Google Scholar]
- Botvinick MM, Cohen JD, Carter CS. Conflict monitoring and anterior cingulate cortex: an update. Trends Cogn Sci. 2004;8(12):539–546. doi: 10.1016/j.tics.2004.10.003. [DOI] [PubMed] [Google Scholar]
- Breiter HC, Aharon I, Kahneman D, Dale A, Shizgal P. Functional imaging of neural responses to expectancy and experience of monetary gains and losses. Neuron. 2001;30(2):619–639. doi: 10.1016/s0896-6273(01)00303-8. [DOI] [PubMed] [Google Scholar]
- Bush G, Vogt BA, Holmes J, Dale AM, Greve D, Jenike MA, et al. Dorsal anterior cingulate cortex: a role in reward-based decision making. Proc Natl Acad Sci U S A. 2002;99(1):523–528. doi: 10.1073/pnas.012470999. [DOI] [PMC free article] [PubMed] [Google Scholar]
- Carter CS, Braver TS, Barch DM, Botvinick MM, Noll D, Cohen JD. Anterior cingulate cortex, error detection, and the online monitoring of performance. Science. 1998;280(5364):747–749. doi: 10.1126/science.280.5364.747. [DOI] [PubMed] [Google Scholar]
- Carter CS, van Veen VS. Anterior cingulate cortex and conflict detection: an update of theory and data. Cogn Affect Behav Neurosci. 2007;7(4):367–379. doi: 10.3758/cabn.7.4.367. [DOI] [PubMed] [Google Scholar]
- Cohen MS. Parametric analysis of fMRI data using linear systems methods. Neuroimage. 1997;6(2):93–103. doi: 10.1006/nimg.1997.0278. [DOI] [PubMed] [Google Scholar]
- Cohen MX, Heller AS, Ranganath C. Functional connectivity with anterior cingulate and orbitofrontal cortices during decision-making. Brain Res Cogn Brain Res. 2005;23(1):61–70. doi: 10.1016/j.cogbrainres.2005.01.010. [DOI] [PubMed] [Google Scholar]
- Cohen MX, Ranganath C. Behavioral and neural predictors of upcoming decisions. Cogn Affect Behav Neurosci. 2005;5(2):117–126. doi: 10.3758/cabn.5.2.117. [DOI] [PubMed] [Google Scholar]
- Cox RW. AFNI: software for analysis and visualization of functional magnetic resonance neuroimages. Comput Biomed Res. 1996;29(3):162–173. doi: 10.1006/cbmr.1996.0014. [DOI] [PubMed] [Google Scholar]
- Craig AD. How do you feel? Interoception: the sense of the physiological condition of the body. Nat Rev Neurosci. 2002;3(8):655–666. doi: 10.1038/nrn894. [DOI] [PubMed] [Google Scholar]
- Craig AD. Human feelings: why are some more aware than others? Trends Cogn Sci. 2004;8(6):239–241. doi: 10.1016/j.tics.2004.04.004. [DOI] [PubMed] [Google Scholar]
- Craig AD, Chen K, Bandy D, Reiman EM. Thermosensory activation of insular cortex. Nat Neurosci. 2000;3(2):184–190. doi: 10.1038/72131. [DOI] [PubMed] [Google Scholar]
- Dreher JC, Kohn P, Berman KF. Neural coding of distinct statistical properties of reward information in humans. Cereb Cortex. 2006;16(4):561–573. doi: 10.1093/cercor/bhj004. [DOI] [PubMed] [Google Scholar]
- Elliott R, Newman JL, Longe OA, Deakin JF. Differential response patterns in the striatum and orbitofrontal cortex to financial reward in humans: a parametric functional magnetic resonance imaging study. J Neurosci. 2003;23(1):303–307. doi: 10.1523/JNEUROSCI.23-01-00303.2003. [DOI] [PMC free article] [PubMed] [Google Scholar]
- Elliott R, Rees G, Dolan RJ. Ventromedial prefrontal cortex mediates guessing. Neuropsychologia. 1999;37(4):403–411. doi: 10.1016/s0028-3932(98)00107-9. [DOI] [PubMed] [Google Scholar]
- Ernst M, Bolla K, Mouratidis M, Contoreggi C, Matochik JA, Kurian VS, et al. Decision-making in a risk-taking task: a PET study. Neuropsychopharmacology. 2002;26(5):682–691. doi: 10.1016/S0893-133X(01)00414-6. [DOI] [PubMed] [Google Scholar]
- Ernst M, Nelson EE, Jazbec S, McClure EB, Monk CS, Leibenluft E, et al. Amygdala and nucleus accumbens in responses to receipt and omission of gains in adults and adolescents. Neuroimage. 2005;25(4):1279–1291. doi: 10.1016/j.neuroimage.2004.12.038. [DOI] [PubMed] [Google Scholar]
- Ernst M, Nelson EE, McClure EB, Monk CS, Munson S, Eshel N, et al. Choice selection and reward anticipation: an fMRI study. Neuropsychologia. 2004;42(12):1585–1597. doi: 10.1016/j.neuropsychologia.2004.05.011. [DOI] [PubMed] [Google Scholar]
- Ernst M, Paulus MP. Neurobiology of decision making: a selective review from a neurocognitive and clinical perspective. Biol Psychiatry. 2005;58(8):597–604. doi: 10.1016/j.biopsych.2005.06.004. [DOI] [PubMed] [Google Scholar]
- Eshel N, Nelson EE, Blair RJ, Pine DS, Ernst M. Neural substrates of choice selection in adults and adolescents: development of the ventrolateral prefrontal and anterior cingulate cortices. Neuropsychologia. 2007;45(6):1270–1279. doi: 10.1016/j.neuropsychologia.2006.10.004. [DOI] [PMC free article] [PubMed] [Google Scholar]
- Gottfried JA, O’Doherty J, Dolan RJ. Encoding predictive reward value in human amygdala and orbitofrontal cortex. Science. 2003;301(5636):1104–1107. doi: 10.1126/science.1087919. [DOI] [PubMed] [Google Scholar]
- Hommer DW, Knutson B, Fong GW, Bennett S, Adams CM, Varnera JL. Amygdalar recruitment during anticipation of monetary rewards: an event-related fMRI study. Ann N Y Acad Sci. 2003;985:476–478. doi: 10.1111/j.1749-6632.2003.tb07103.x. [DOI] [PubMed] [Google Scholar]
- Huettel SA, Stowe CJ, Gordon EM, Warner BT, Platt ML. Neural signatures of economic preferences for risk and ambiguity. Neuron. 2006;49(5):765–775. doi: 10.1016/j.neuron.2006.01.024. [DOI] [PubMed] [Google Scholar]
- Kable JW, Glimcher PW. The neural correlates of subjective value during intertemporal choice. Nat Neurosci. 2007;10(12):1625–1633. doi: 10.1038/nn2007. [DOI] [PMC free article] [PubMed] [Google Scholar]
- Kerns JG, Cohen JD, MacDonald AW, 3rd, Cho RY, Stenger VSA, Carter CS. Anterior cingulate conflict monitoring and adjustments in control. Science. 2004;303(5660):1023–1026. doi: 10.1126/science.1089910. [DOI] [PubMed] [Google Scholar]
- Knutson B, Bossaerts P. Neural antecedents of financial decisions. J Neurosci. 2007;27(31):8174–8177. doi: 10.1523/JNEUROSCI.1564-07.2007. [DOI] [PMC free article] [PubMed] [Google Scholar]
- Knutson B, Cooper JC. Functional magnetic resonance imaging of reward prediction. Curr Opin Neurol. 2005;18(4):411–417. doi: 10.1097/01.wco.0000173463.24758.f6. [DOI] [PubMed] [Google Scholar]
- Knutson B, Fong GW, Bennett SM, Adams CM, Hommer D. A region of mesial prefrontal cortex tracks monetarily rewarding outcomes: characterization with rapid event-related fMRI. Neuroimage. 2003;18(2):263–272. doi: 10.1016/s1053-8119(02)00057-5. [DOI] [PubMed] [Google Scholar]
- Koechlin E, Corrado G, Pietrini P, Grafman J. Dissociating the role of the medial and lateral anterior prefrontal cortex in human planning. Proc Natl Acad Sci U S A. 2000;97(13):7651–7656. doi: 10.1073/pnas.130177397. [DOI] [PMC free article] [PubMed] [Google Scholar]
- Kosson DS, Budhani S, Nakic M, Chen G, Saad ZS, Vythilingam M, et al. The role of the amygdala and rostral anterior cingulate in encoding expected outcomes during learning. Neuroimage. 2006;29(4):1161–1172. doi: 10.1016/j.neuroimage.2005.07.060. [DOI] [PubMed] [Google Scholar]
- Krain AL, Gotimer K, Hefton S, Ernst M, Castellanos FX, Pine DS, et al. A Functional Magnetic Resonance Imaging Investigation of Uncertainty in Adolescents with Anxiety Disorders. Biol Psychiatry. 2007 doi: 10.1016/j.biopsych.2007.06.011. [DOI] [PubMed] [Google Scholar]
- Maddock RJ, Garrett AS, Buonocore MH. Posterior cingulate cortex activation by emotional words: fMRI evidence from a valence decision task. Hum Brain Mapp. 2003;18(1):30–41. doi: 10.1002/hbm.10075. [DOI] [PMC free article] [PubMed] [Google Scholar]
- Marsh AA, Blair KS, Vythilingam M, Busis S, Blair RJ. Response options and expectations of reward in decision-making: the differential roles of dorsal and rostral anterior cingulate cortex. Neuroimage. 2007;35(2):979–988. doi: 10.1016/j.neuroimage.2006.11.044. [DOI] [PMC free article] [PubMed] [Google Scholar]
- McCoy AN, Platt ML. Risk-sensitive neurons in macaque posterior cingulate cortex. Nat Neurosci. 2005;8(9):1220–1227. doi: 10.1038/nn1523. [DOI] [PubMed] [Google Scholar]
- Nagai Y, Goldstein LH, Critchley HD, Fenwick PB. Influence of sympathetic autonomic arousal on cortical arousal: implications for a therapeutic behavioural intervention in epilepsy. Epilepsy Res. 2004;58(2–3):185–193. doi: 10.1016/j.eplepsyres.2004.02.004. [DOI] [PubMed] [Google Scholar]
- Nakic M, Smith BW, Busis S, Vythilingam M, Blair RJ. The impact of affect and frequency on lexical decision: the role of the amygdala and inferior frontal cortex. Neuroimage. 2006;31(4):1752–1761. doi: 10.1016/j.neuroimage.2006.02.022. [DOI] [PubMed] [Google Scholar]
- Paulus MP. Neurobiology of decision-making: quo vadis? Brain Res Cogn Brain Res. 2005;23(1):2–10. doi: 10.1016/j.cogbrainres.2005.01.001. [DOI] [PubMed] [Google Scholar]
- Paulus MP, Hozack N, Zauscher B, McDowell JE, Frank L, Brown GG, et al. Prefrontal, parietal, and temporal cortex networks underlie decision-making in the presence of uncertainty. Neuroimage. 2001;13(1):91–100. doi: 10.1006/nimg.2000.0667. [DOI] [PubMed] [Google Scholar]
- Paulus MP, Rogalsky C, Simmons A, Feinstein JS, Stein MB. Increased activation in the right insula during risk-taking decision making is related to harm avoidance and neuroticism. Neuroimage. 2003;19(4):1439–1448. doi: 10.1016/s1053-8119(03)00251-9. [DOI] [PubMed] [Google Scholar]
- Phillips ML, Williams LM, Heining M, Herba CM, Russell T, Andrew C, et al. Differential neural responses to overt and covert presentations of facial expressions of fear and disgust. Neuroimage. 2004;21(4):1484–1496. doi: 10.1016/j.neuroimage.2003.12.013. [DOI] [PubMed] [Google Scholar]
- Phillips ML, Young AW, Scott SK, Calder AJ, Andrew C, Giampietro VS, et al. Neural responses to facial and vocal expressions of fear and disgust. Proc Biol Sci. 1998;265(1408):1809–1817. doi: 10.1098/rspb.1998.0506. [DOI] [PMC free article] [PubMed] [Google Scholar]
- Pinel P, Dehaene S, Riviere D, LeBihan D. Modulation of parietal activation by semantic distance in a number comparison task. Neuroimage. 2001;14(5):1013–1026. doi: 10.1006/nimg.2001.0913. [DOI] [PubMed] [Google Scholar]
- Preuschoff K, Quartz SR, Bossaerts P. Human insula activation reflects risk prediction errors as well as risk. J Neurosci. 2008;28(11):2745–2752. doi: 10.1523/JNEUROSCI.4286-07.2008. [DOI] [PMC free article] [PubMed] [Google Scholar]
- Ridderinkhof KR, van den Wildenberg WP, Segalowitz SJ, Carter CS. Neurocognitive mechanisms of cognitive control: the role of prefrontal cortex in action selection, response inhibition, performance monitoring, and reward-based learning. Brain Cogn. 2004;56(2):129–140. doi: 10.1016/j.bandc.2004.09.016. [DOI] [PubMed] [Google Scholar]
- Rogers RD, Owen AM, Middleton HC, Williams EJ, Pickard JD, Sahakian BJ, et al. Choosing between small, likely rewards and large, unlikely rewards activates inferior and orbital prefrontal cortex. J Neurosci. 1999;19(20):9029–9038. doi: 10.1523/JNEUROSCI.19-20-09029.1999. [DOI] [PMC free article] [PubMed] [Google Scholar]
- Rogers RD, Ramnani N, Mackay C, Wilson JL, Jezzard P, Carter CS, et al. Distinct portions of anterior cingulate cortex and medial prefrontal cortex are activated by reward processing in separable phases of decision-making cognition. Biol Psychiatry. 2004;55(6):594–602. doi: 10.1016/j.biopsych.2003.11.012. [DOI] [PubMed] [Google Scholar]
- Rolls ET. The functions of the orbitofrontal cortex. Brain Cogn. 2004;55(1):11–29. doi: 10.1016/S0278-2626(03)00277-X. [DOI] [PubMed] [Google Scholar]
- Rolls ET, McCabe C, Redoute J. Expected value, reward outcome, and temporal difference error representations in a probabilistic decision task. Cereb Cortex. 2008;18(3):652–663. doi: 10.1093/cercor/bhm097. [DOI] [PubMed] [Google Scholar]
- Schoenbaum G, Chiba AA, Gallagher M. Neural encoding in orbitofrontal cortex and basolateral amygdala during olfactory discrimination learning. J Neurosci. 1999;19(5):1876–1884. doi: 10.1523/JNEUROSCI.19-05-01876.1999. [DOI] [PMC free article] [PubMed] [Google Scholar]
- Schoenbaum G, Roesch M. Orbitofrontal cortex, associative learning, and expectancies. Neuron. 2005;47(5):633–636. doi: 10.1016/j.neuron.2005.07.018. [DOI] [PMC free article] [PubMed] [Google Scholar]
- Stanescu-Cosson R, Pinel P, van De Moortele PF, Le Bihan D, Cohen L, Dehaene S. Understanding dissociations in dyscalculia: a brain imaging study of the impact of number size on the cerebral networks for exact and approximate calculation. Brain. 2000;123(Pt 11):2240–2255. doi: 10.1093/brain/123.11.2240. [DOI] [PubMed] [Google Scholar]
- Talairach J, Tournoux P. Co-planar sterotaxic atlas of the human brain. New York: Thieme Medical Publishers Inc; 1988. [Google Scholar]
- Tobler PN, O’Doherty JP, Dolan RJ, Schultz W. Reward value coding distinct from risk attitude-related uncertainty coding in human reward systems. J Neurophysiol. 2007;97(2):1621–1632. doi: 10.1152/jn.00745.2006. [DOI] [PMC free article] [PubMed] [Google Scholar]
- van Veen VS, Carter CS. Separating semantic conflict and response conflict in the Stroop task: a functional MRI study. Neuroimage. 2005;27(3):497–504. doi: 10.1016/j.neuroimage.2005.04.042. [DOI] [PubMed] [Google Scholar]
- Vogt BA. Pain and emotion interactions in subregions of the cingulate gyrus. Nat Rev Neurosci. 2005;6(7):533–544. doi: 10.1038/nrn1704. [DOI] [PMC free article] [PubMed] [Google Scholar]
- Volz KG, Schubotz RI, von Cramon DY. Predicting events of varying probability: uncertainty investigated by fMRI. Neuroimage. 2003;19(2 Pt 1):271–280. doi: 10.1016/s1053-8119(03)00122-8. [DOI] [PubMed] [Google Scholar]
- Volz KG, Schubotz RI, von Cramon DY. Frontomedian activation depends on both feedback validity and valence: fMRI evidence for contextual feedback evaluation. Neuroimage. 2005;27(3):564–571. doi: 10.1016/j.neuroimage.2005.04.026. [DOI] [PubMed] [Google Scholar]
- Walton ME, Devlin JT, Rushworth MF. Interactions between decision making and performance monitoring within prefrontal cortex. Nat Neurosci. 2004;7(11):1259–1265. doi: 10.1038/nn1339. [DOI] [PubMed] [Google Scholar]
- Williams ZM, Bush G, Rauch SL, Cosgrove GR, Eskandar EN. Human anterior cingulate neurons and the integration of monetary reward with motor responses. Nat Neurosci. 2004;7(12):1370–1375. doi: 10.1038/nn1354. [DOI] [PubMed] [Google Scholar]
- Yacubian J, Glascher J, Schroeder K, Sommer T, Braus DF, Buchel C. Dissociable systems for gain- and loss-related value predictions and errors of prediction in the human brain. J Neurosci. 2006;26(37):9530–9537. doi: 10.1523/JNEUROSCI.2915-06.2006. [DOI] [PMC free article] [PubMed] [Google Scholar]