

Abstract
Administration of doxapram hydrochloride, a respiratory stimulant, is experienced by panic disorder patients to be similar to panic attacks but has reduced emotional effect in normal volunteers thus providing a laboratory model of panic for functional imaging. Six panic patients and seven normal control subjects underwent positron emission tomography with 18F-deoxyglucose imaging after a single-blinded administration of either doxapram or a placebo saline solution. Saline and doxapram were administered on separate days in counterbalanced order. Patients showed a greater heart rate increase on doxapram from saline than controls, indicating differential response. On the saline placebo day, patients had greater prefrontal relative activity than controls. In response to doxapram, patients tended to decrease prefrontal activity more than controls, and increased cingulate gyrus and amygdala activity more than controls. This suggests that panic disorder patients activate frontal inhibitory centers less than controls which may lower the threshold for panic.
Keywords: doxapram, PET, panic, prefrontal cortex, amygdala, neuroimaging
INTRODUCTION
Panic disorder (PD) is a psychiatric illness characterized by recurrent and unexpected panic attacks, a fear of having more attacks, and a resultant change in behaviors to avoid further attacks (American Psychiatric Association, 1994). A panic attack is a period, in most cases lasting about 10 to 15 minutes, of symptoms of autonomic stimulation (chest pain, palpitations, shortness of breath, sweating, chills, choking sensation, nausea, and, lightheadedness or dizziness) accompanied by fears of dying or losing control and of unreality. The biological basis of panic disorder is thought to be related to an abnormal conditioned fear response (Gorman et al., 2000). One prominent neuroanatomic pathway for panic attacks is thought to begin with sensory inputs from the thalamus, which then send stimuli to the amygdala and the medial prefrontal cortex. From the amygdala, projections to the parabrachial nucleus, locus coeruleus, periaqueductal gray region, and hypothalamus, are responsible for the physical symptoms associated with a panic attack. The frontal cortex is suggested to be involved in higher-level modulation of sensory information (Gorman et al., 2000). Other conceptions have emphasized the serotonergic connections of the periaqueductal gray (Graeff, 2004). The model of Grove et al. (1997) places less emphasis on the periaqueductal gray but included the caudate and putamen.
Preclinical research has shown that the amygdala is the crucial brain structure for acquisition and expression of conditioned fear (Rauch et al., 2003; Anand and Shekhar, 2003). Although the amygdala has been repeatedly linked to fear behavior, it does not act in isolation but rather functions within a network of brain regions that together modulate the complex manifestations of fear and anxiety (Cahill and McGaugh, 1998; Davis, 1992; Fredrikson and Furmark, 2003; Furmark et al., 2002; Gorman et al., 2000; LeDoux, 1995). Multiple neuroimaging studies have shown amygdala activation in normal subjects during presentation of fear inducing stimuli, such as fearful faces or fear-laden words (Morris et al., 1996; Lane et al., 1997; Whalen et al., 1998; Tabert et al., 2001; Schaefer et al., 2002). There is also evidence that patients with anxiety disorders, including posttraumatic stress disorder (PTSD), social anxiety disorder (SAD), and panic disorder, have a threshold for amygdala activation during the presentation of fearful stimuli that is significantly lower than that for normal volunteers (Furmark et al., 2002; Liberzon et al., 1999; Fredrikson and Furmark, 2003). In humans, the orbitofrontal cortex (OFC) has most frequently been linked to decision-making, emotional memory, and the evaluation of reward (Armony and Dolan, 2002; Bechara et al., 2000). Several preclinical and human imaging studies have now shown that activation of the prefrontal cortex (PFC) inhibits activation of the amygdala (Hariri et al., 2000; Rosenkranz and Grace, 1999).
In the clinical laboratory, many agents have been used to induce panic attacks in patients with PD. Doxapram, a respiratory stimulant primarily used in anesthesiology, is thought to stimulate the carotid body chemoreceptors, thereby increasing respiratory rate (Folgering et al., 1981). It requires only minimal injection volumes, has a rapid onset of action, has minimal side effects (Winnie, 1973), and does not appreciably cross the blood-brain barrier or affect vascular flow (Folgering et al., 1981; Burki, 1984; Calverley et al., 1983). Doxapram has been shown to increase anxiety behaviors in a rodent model of panic (Sullivan et al., 2003; Choi et al., 2005). In human studies of doxapram, Abelson and colleagues (Lee et al., 1993; Abelson et al., 1996a, b; Abelson et al., 2007) have shown a panic rate of up to 80% in subjects with PD, compared to 20% in normal volunteers. In a prior study by our group, doxapram (0.5 mg/kg in 10 ml saline) was administered over 15 seconds to six patients with PD and four normal controls (Gutman et al., 2005). A trained rater kept blind to whether the subject was a patient or control judged if a panic attack occurred. All six of the patients with PD but none of the four controls panicked according to the blinded rater. The patients with PD also developed higher scores on the Acute Panic Inventory (API) than controls. In a second series of doxapram infusions, again a panic rate of 6/6 in patients and 1/6 in normal volunteers was found (Kent et al., 2005). We decided to consider together as a panic attack group both patients with panic disorder and normal controls who panicked during doxapram administration. This is because previous work with CO2-induced panic we showed that the panic attacks experienced by these two groups were identical physiologically as well as emotionally; the only difference between the groups was the rate at which panic occurred in each group (Gorman et al., 2001). Given these data, doxapram is a potent and reliable agent for inducing panic attacks, ideal for use in imaging studies.
In a pilot study using 15O-H20 PET imaging to assess changes before and during doxapram administration in five subjects with PD and five normal volunteers, results showed that anticipating a panic attack is associated with marked decrease in blood flow within the orbital frontal cortex between pre- and post-doxapram administration (Kent et al., 2005). All subjects demonstrated significant decreases in cerebral blood flow (CBF) in all regions of interest (ROIs), including subcortical and cortical areas, in response to doxapram. There were no differences between the patient and control groups. However, among the five panicking subjects (four patients with useable data plus one control) compared to four non-panicking subjects (all controls), there was a statistically significant difference during the placebo-condition, pre-doxapram administration orbitofrontal CBF. In addition, for subjects with PD, orbitofrontal CBF during placebo-condition premedication was negatively correlated with post-doxapram scores on the API and on a 10-point Likert-type Anxiety Scale.
Although the data in the 15O-H20 PET imaging study are obviously preliminary given the pilot nature of the study and small sample size, an important point of interest for planning future studies emerged. In the past, using a measure of cerebral blood flow such as 15O-H2O PET, we were unable to discriminate regional changes between patients and controls during panic attacks (Kent et al., 2005). We have speculated that this may be because of marked hyperventilation produced by doxapram in all subjects, which results in vasoconstriction and therefore a likely “floor” effect beyond which any further changes produced by a panic attack cannot be measured (Kent et al, 2005). As all methods of panic induction tested to date produced hyperventilation (Bourin et al., 1995), this problem will not be limited to doxapram alone. Rather, we believe that measures of brain activity that are based on blood flow, such as 15O-H20 PET and fMRI, may not be ideal for studying the acute panic attack, leading us to switch to a measure of brain metabolism, FDG-PET, for the current study.
To date, there have been a limited number of studies of FDG-PET in panic disorder. Nordahl and colleagues (1990, 1998) investigated cerebral glucose metabolism in PD patients at rest, versus healthy control subjects, and found asymmetric left-right ratios of cerebral glucose metabolism in the hippocampus and posterior inferior prefrontal cortex (Nordahl et al., 1990), and decreased ratio in the posterior orbital frontal cortex in patients treated with imipramine (Nordahl et al., 1998). In a study of women with PD, Bisaga et al. (1998) found that in patients who experienced a lactate-induced panic attack, there was an increase in glucose metabolism in the left hippocampus and the left parahippocampal area, and a decrease in the right superior temporal and right inferior parietal areas. There was, however, no correlation between the score on anxiety scales or severity of panic attacks with the PET findings. Sakai, Kumano, and others (2005) studied 12 unmedicated subjects with PD at rest, versus 22 controls. They reported that PD subjects had higher FDG uptake in the bilateral amygdala, hippocampus, midbrain, thalamus, pons, medulla, and cerebellum, compared to healthy controls, with no evidence of asymmetry. The findings are attributed to anticipatory anxiety to the laboratory situation, or possibly to contextual fear of the imaging machine.
To date, there are only two known investigations of the effects of cognitive behavior therapy (CBT) using FDG-PET in panic disorder patients. Prasko and others (2005) studied 12 subjects with PD, half of whom were randomly assigned to receive three months of treatment with CBT while the other half received an antidepressant (citalopram, sertraline, or venlafaxine). After treatment, subjects receiving CBT showed increased resting state FDG uptake in the left inferior frontal gyrus [Brodmann area (BA) 9], left middle temporal gyrus (BA 21), left insula (BA 13), middle frontal gyrus (BA 46) and precentral gyrus (BA 6), and decreased uptake in right inferior temporal gyrus (BA 20), right superior and inferior temporal gyrus (BA 20), right superior and inferior frontal gyrus (BA 10, BA 45), and left medial frontal gyrus (BA 6). They concluded that changes in FDG uptake in cortical brain regions were similar for those subjects treated with antidepressants and CBT, with a right-left asymmetry. The study was limited by a small sample size, lack of control group, and the use of different antidepressant medications in the medicated patient group. Sakai et al. (2006), in an FDG-PET investigation of 11 subjects with PD, found that after CBT treatment, there was decreased metabolism in the right hippocampus, left ventral anterior cingulate cortex, and pons, and increased utilization in the medial prefrontal cortex. The study was limited by the lack of a control group. It is important to re-emphasize that neither of the above studies imaged the subjects during an acute panic state.
To our knowledge, there are no known FDG-PET studies of panic patients undergoing an induced panic attack. The goal of our investigation is to examine two main areas of the brain associated with panic, including the orbitofrontal and polar areas of the prefrontal cortex, and the limbic system including the anterior cingulate, hippocampus and amygdala. Prefrontal areas 8 and 9 were included as control areas of the PFC, not hypothesized to have an effect and to allow a test of the specificity of effects to the fronto-limbic system. We used FDG-PET imaging to avoid nonspecific effects of carbon dioxide on cerebral blood flow. PD patients were examined after saline placebo and doxapram on separate days to allow imaging of subjects experiencing panic attacks induced by doxapram. Our hypotheses were as follows: (1) Prior to treatment, following a saline (placebo) injection but anticipating that they will receive the panicogen doxapram, patients with PD will show altered metabolic activity in the prefrontal and orbitofrontal cortex as measured by FDG-PET compared to normal comparison subjects. (2) There will be significant statistical associations between OFC activity, increased anxiety, increased heart rate, and increased minute ventilation (the product of respiratory frequency and the tidal volume of breathing) following saline administration (i.e. in the anticipatory state) in PD patients. Panicking subjects will show altered, asymmetrical metabolic activity in the hippocampus, anterior cingulate, prefrontal cortex, OFC and amygdala compared to non-panicking subjects. (3) Increased metabolic activity measured by PET would correlate with increased heart rate, respiration, and anxiety during the panic attack itself. To test these hypotheses we used repeated measures ANOVA, incorporating both specific and nonspecific areas and focusing on the frontal/limbic system interaction to minimize exploratory analyses.
EXPERIMENTAL PROCEDURES
Subjects
Thirteen subjects, six patients with panic disorder and seven controls, were enrolled in the study. The panic disorder group (four women, two men, mean age = 31.3 years, SD = 10.7) met DSM-IV criteria for panic disorder with or without agoraphobia, had recurrent panic attacks in the four weeks prior to study entry, and were between 18 and 65 years of age. Only patients who had not taken any psychoactive medications in the past four weeks were included (six weeks in the case of fluoxetine). Exclusion criteria for this group included a DSM-IV diagnosis of schizophrenia, bipolar disorder, obsessive-compulsive disorder (OCD), eating disorder, or PTSD or substance abuse or dependence within the six months prior to study. Subjects who were pregnant or planning to become pregnant, had diabetes mellitus, or that had a Hamilton Depression Rating Scale Score >22, and patients already on effective treatment for PD, were also excluded. The normal control group (four women, three men, mean age = 36.3 years, SD = 6.5) consisted of individuals with no major Axis I diagnoses including major depressive disorder, PD, generalized anxiety disorder, PTSD, OCD, schizophrenia, bipolar disorder, or substance use disorders. Patients with nicotine and caffeine use were not excluded, although this is a point worth considering for future studies. Age and sex distribution were not significantly different in patients and controls. Other exclusion criteria included major medical illness or pregnancy. The study was approved by the Mount Sinai School of Medicine Institutional Review Board, and all subjects signed written, informed consent before participation.
Procedure
After thorough screening and obtaining informed consent, each subject reported to the Laboratory of Clinical Psychobiology on the morning of testing at 8:30 a.m. Subjects were fitted with the Life Shirt System, a noninvasive ambulatory recording device that continuously acquires and stores respiratory, heart rate, and pulse oximetry information onto a computer memory card for later analysis (VivoMetrics, Inc.). Subjects were told that they will have two PET sessions, one on each day. They were then told they will receive either an injection of 0.5 mg/kg of doxapram, a respiratory stimulant, on the first day and then saline on the second day, or vice versa. Subjects were told that doxapram has a high rate of producing panic attacks in patients with PD. Order was counterbalanced so that seven subjects (four PD and three NC) received saline on the first day and six subjects (two PD and four NC) received doxapram on first day.
A 24- gauge angiocath was inserted in the antecubital vein and a 0.9% saline drip started. Patients were then moved to a sound-attenuated room. Subjects rested in the room about ten minutes for a baseline period of psychophysiological recordings and then 5 microcuries (mCi) of 18F-fluorodeoxyglucose was injected into the port in the intravenous tubing followed by the administration of doxapram over 30 seconds. Patients rested quietly in the room for 35 minutes, were taken to the bathroom to urinate, and then positioned in the scanner. Typical subjects experienced some increased respiration and some described symptoms of panic, but all remained seated and cooperative. Respiratory and heart rate measures were collected continuously during the testing. API, Borg, and anxiety scales were collected 10 minutes before doxapram/placebo injection and at 30 minutes post injection. All subjects tolerated the injections and cooperated fully with the scans, which were of high quality without excessive motion artifact.
Measurements
Assessments made by rater during PET scans include the Acute Panic Inventory (API), 10-point Anxiety Scale, and Borg (breathlessness) Scale. The API is a 27-item questionnaire that measures anxiety and physiological sensations (Dillon et al., 1987). The 10-point Anxiety Scale is a 0-to-10 Likert-type scale that measures level of anxiety (Houtman and Bakker, 1999). The Borg (breathlessness) Scale is a 1-to-10 level scale that measures level of sensation of effort to breathe (Borg, 1982). Scales administered before PET scan sessions included the Clinical Global Impression of Severity (CGI-S) and Improvement (CGI-I) Scales, which are widely used 7-point clinician-rated instruments (Guy, 1976) to assess global severity and improvement, and the Panic Disorder Severity Scale (PDSS), a 7-item clinician-rated scale providing ratings of the core features of PD (panic frequency, distress during panic, anticipatory anxiety, panic-related avoidance of situations and sensations, and the degree of work and social impairment/interference due to PD (Shear et al., 1997).
PET and MRI Scanning
PET scans (20 slices, 6.5-mm thickness) were obtained with a head-dedicated GE scanner (model PC2048B) with measured resolution of 4.5 mm in plane (4.2–4.5 mm across 15 planes). Fifteen slices at 6.5-mm intervals were obtained in two sets to cover the entire brain. Slice counts of 1.5–3 M counts are typical. Scans were reconstructed with a blank and a transmission scan using the Hanning filter (width 3.15). PET images were obtained in nanocuries/pixel and standardized as relative glucose metabolic rate (rGMR) by dividing each pixel by the mean value for the entire brain (defined by brain edge from coregistered MRI). While this limits interpretations of single structure absolute activity, this method is widely used when evaluating hypotheses related to patterns of metabolic rate across brain areas and was used in earlier imaging studies of serotonin activation (Hazlett et al., 1999).
MRI scans (T1-weighted axial) were acquired with the GE Signa 5x system (TR = 24 ms, TE = 5 ms, flip angle = 40 degrees, slice thickness = 1.2 mm, pixel matrix = 256×256, field of view = 23 cm, total slices = 128). PET-MRI coregistration used the algorithm of Woods et al. (1993). Brain edges were visually traced on all MRI axial slices with inter-tracer reliability of 0.99.
Region of interest assessment
Cortical Brodmann’s area measurements were conducted based on the Perry coronal atlas of the brain (Perry, personal communication, 1993). This method is described in detail elsewhere. Briefly, we divided the distance between the front (first slice containing the cortical ribbon) and the back (last slice containing the cortical ribbon) of the coronal brain aspect into 33 evenly spaced sections. For each of the temporal lobes, the distance between the temporal pole and the most posterior extent of the Sylvian fissure was divided into 13 equally spaced sections. Each of the obtained coronal slices (33 nontemporal and 26 temporal) was further divided into 20 radial sectors in each hemisphere and 10 midline sectors, assigned to 39 Brodmann’s areas identified by Perry and assessed for gray and white pixels within each sector. Image segmentation into gray and white pixels was performed using cut-off values individually determined by visual examination of each subject’s axial within-brain-edge histogram. Relative glucose metabolic rate for gray matter pixels identified on MRI was measured from each subject’s co-registered PET. The resultant numbers were summed across successive slices to yield averages for each of the 39 Brodmann areas in each hemisphere (78 variables per subject). However, only key prefrontal and cingulate structures were entered into data analysis to minimize type II error.
Statistical analysis
All autonomic and scale rating data were analyzed for the baseline condition before doxapram, to examine pre-challenge activity. For the physiological measures, this was the pre-FDG, pre-drug injection period. For the FDG, we examined the saline placebo day data only as indicative of a baseline condition, recognizing that it was the placebo arm of a medication challenge. For the doxapram effect in psychophysiological data, we compared pre- and post challenge data on the saline and drug days in a three way ANOVA with independent groups (patients, controls) and repeated measures for medication (placebo, drug) and time (before, after). For the PET data there was no time factor.
The activity in cortical Brodmann areas were assessed using the techniques described above. For the Brodmann analysis, a 2×2×4×3×2 mixed-factorial ANOVA design was applied to rGMR data obtained from ROIs in the frontal cortex. This design was applied to rGMR values in a with an independent group dimension (patients, normals) and repeated measures dimensions for hemisphere (left, right), frontal lobe division (anterior, medial, orbital, and dorsolateral) and Brodmann area within each frontal lobe division (anterior BA 8, 9, 10; medial BA 32, 25, 24; orbital BA 11, 12, 47, and dorsolateral BA 44, 45, 46) and tissue type (gray, white). A second phase of the data was analyzed with an additional repeated measures factor to assess the effect of drug (placebo, doxapram). All significant interactions with group for baseline analysis and group × drug effect are reported. To minimize Type II error, interactions containing only anatomical dimensions (e.g., hemisphere by tissue type) or not containing group by drug are not reported. In addition, our hypotheses are tested only on the key structures and a limited number of prefrontal but control areas. When lobe divisions by BA interactions were found, post-hoc analyses on each lobe division were carried out to identify the strongest sources of effects, but not to confirm the interaction.
Exploratory significance probability mapping
To provide a pixel-by-pixel analysis of the entire brain slice, we carried out voxel-by-voxel t-tests on the same brain slices assessed by the stereotaxic ROI method. The significance probability mapping technique is similar to other approaches but uses MRI-edge based spatial normalization. Continuous edges were manually delineated around the brain. Nine midline points equally spaced in the z direction were identified. Slices were then adjusted by the number of rows and columns so that every slice contained an equal number of pixels with every edge pixel-aligned and midline pixels positioned in a vertical strip at edge center. PET images for placebo and drug were coregistered to the same MRI, similarly standardized, and between groups t-tests carried out for drug-placebo difference scores. To confirm our expectation of amygdala activation, we examined the region of the amygdala at p < 0.05.
RESULTS
Physiological measures
Baseline
We measured the baseline average heart rate of each subject 10 minutes prior to FDG injection. Baseline heart rate data averaged across the placebo and doxapram days did not differ significantly between the groups.
Doxapram effect
We measured the average heart rate of each subject 10 minutes before FDG injection, as well as the average heart rate during 10 minute intervals during the 30-minute FDG uptake period. We entered the heart rate data into a repeated-measures ANOVA: group by condition (placebo, doxapram) × time. The heart rate of the panic disorder subjects increased with the injection of the doxapram, most dramatically shown in the first 10 minutes. The heart rate of the control population increased only slightly during the first 10 minutes, but returned to baseline levels during the second and third measurements (see Figure 1, group × condition × time interaction (F(3,33) = 4.25, p = 0.012). The main effect of group was not significant (F = 4.12, df = 1,11, p = 0.067) consistent with the lack of pre-drug baseline heart rate differences in this small sample. In addition, we performed a similar ANOVA and controlled for injection order; there was no significant effect of order, but cell sizes were below the accepted standard of five persons per cell.
Figure 1.

Effect of Doxapram on Heart Rate. Patient increase in heart rate relative to normal volunteer change (patient’s heart rate minus normal volunteer heart rate. Note patient heart rate is faster than controls but the increment in heart rate with doxapram is significantly larger. Post-hoc t-tests show no significant difference in 10-minutes pre-injection but significant in minutes 0–9 (normal volunteers 70.9, sd = 9.6, patients 87.3, sd = 5.65, t = 3.68, p = 0.0036).
Behavioral ratings
Baseline
Panic disorder patients were significantly more symptomatic on the API, Borg, and on the ten-point anxiety scale before receiving either doxapram or placebo (Table 1), compared to healthy control subjects.
Table 1.
Group Statistics on Day one pre-injection
| grp | N | Mean | Std. Deviation | t | df | p | |
|---|---|---|---|---|---|---|---|
| api1 | PD | 6 | 13.1667 | 13.80459 | 2.07 | 5.1 | 0.09 |
| NC | 7 | 1.4286 | 1.81265 | ||||
|
| |||||||
| anx1 | PD | 6 | 3.1667 | 3.06050 | 1.24 | 5.57 | 0.26 |
| NC | 7 | 1.5714 | .78680 | ||||
|
| |||||||
| borg1 | PD | 6 | 1.0833 | 1.20069 | 2.21 | 5.00 | 0.08 |
| NC | 7 | .0000 | .00000 | ||||
|
| |||||||
| Respiratory rate mean | PD | 6 | 19.7833 | 1.83567 | 2.31 | 11 | 0.04 |
| NC | 7 | 16.9571 | 2.46093 | ||||
|
|
|||||||
| Respiratory rate SD | PD | 6 | 8.9000 | 2.69221 | 1.75 | 11 | 0.11 |
| NC | 7 | 5.4000 | 4.21782 | ||||
|
|
|||||||
| Heart Rate mean | PD | 6 | 75.6667 | 6.53197 | 2.92 | 11 | 0.01 |
| NC | 7 | 63.4286 | 8.28366 | ||||
|
|
|||||||
| Heart Rate SD | PD | 6 | 6.3333 | 1.96638 | 0.56 | 11 | 0.59 |
| NC | 7 | 5.5714 | 2.76026 | ||||
|
|
|||||||
| Tidal Volume mean | PD | 6 | 441.2667 | 103.67190 | 2.50 | 11 | 0.03 |
| NC | 7 | 302.6714 | 96.32365 | ||||
|
|
|||||||
| Tidal Volume SD | PD | 6 | 249.5050 | 58.18643 | 3.27 | 11 | 0.008 |
| NC | 7 | 115.3571 | 84.71861 | ||||
|
| |||||||
| Minute Ventilation mean | PD | 6 | 8.1200 | 1.77871 | 3.91 | 11 | 0.002 |
| NC | 7 | 4.9300 | 1.14158 | ||||
|
| |||||||
| Minute Ventilation SD | PD | 6 | 5.8550 | 2.98554 | 2.40 | 11 | 0.04 |
| NC | 7 | 2.5086 | 2.03266 | ||||
These are values on day 1, before saline injection. For the physiological measures these are 5 minute means before injection. For the scales these are the −10 minute measures.
API and Borg show a trend toward significance between the two groups. However the respiratory variables and heart rate are significantly higher in the PD groups prior to injection. With significantly greater variance (standard deviations) for tidal volume and minute ventilations in the PD group. You can argue that this difference is caused by the greater anticipatory anxiety in the patients, to receiving the injection (which the patients believe can be doxapram and cause a panic attack).
Doxapram effects
Doxapram increased API ratings more in patients than in normal controls. This was tested with a diagnostic group by condition (doxapram, placebo) by time (pre, 30 minutes post) interaction (F = 9.04, df = 1,10, p = 0.013; main effect of group F = 13.4, df = 1,10, p = 0.004). Ratings on the Borg and ten-point anxiety scale showed significant effects of doxapram but did not show a significantly greater response in panic patients.
Our criteria for panic were an increase in 4 or more DSM-IV panic items on the API questionnaire with a score of 2 or more. Using these criteria all (n = 6) of the panic disorder patients and two of the controls had a panic attack to the doxapram injection.
Prefrontal Cortex
Placebo condition
We entered the Brodmann areas of the prefrontal cortex into a group by hemisphere by frontal lobe division [anterior, medial, orbital, and dorsolateral (AMOD)], by selected sets of Brodmann areas within each region (anterior: BA 8, 9, 10; medial: BA 32, 25, 24; orbital: BA 11, 12, 47; and dorsolateral: BA 44, 45, 46), by matter type (gray, white). On placebo, the subjects with panic disorder had higher activity in the gray matter in all areas of the prefrontal cortex except for BA 8, and right BA 45, when compared to controls. In the white matter, controls had higher activity in all areas on the left hemisphere and most areas on the right hemisphere; PD subjects had higher activity in the white matter in right BA 10, 12 and 44, compared to controls (see figure 2) (diagnostic group by hemisphere by frontal lobe division by Brodmann area by matter type; F(6,66) = 2.59, p = 0.025; multivariate F p = 0.11).
Figure 2.

On saline, patients generally show greater activity in the gray matter throughout the PFC, but decreased activity in the white matter.
Doxapram effect
On receiving doxapram, both healthy controls and PD patients generally decreased in activity within the anterior and orbital prefrontal lobe. However, PD patients decreased in activity within the dorsolateral lobe, whereas controls increased in activity. Within the medial prefrontal cortex, the PD population increased in activity with doxapram, and the controls decreased in activity. This was observed in a group by drug condition by hemisphere by frontal lobe division by Brodmann area interaction; (F = 2.29, df = 6, 66, p = 0.045, see figure 3). For this reason, we carried out post-hoc ANOVA on each division of the frontal lobe. The orbital and anterior frontal divisions showed significant interactions, but the medial and dorsolateral divisions did not and therefore the analyses are not presented.
Figure 3.

Effect of doxapram on prefrontal cortex. Upon receiving doxapram, normals activate dorsolateral areas 44, 45, and 46, while patients show decreases in this area. In orbital and anterior cortex, both groups show decreases. In the medial frontal cortex, patients show a large inferior cingulate area 25 increase while both normals and patients show decreases in other areas.
Orbitofrontal cortex
Placebo condition
We entered the three Brodmann areas that compose the orbitofrontal cortex into a group by hemisphere by region by matter type repeated-measures ANOVA. On placebo, the subjects with PD had higher gray matter relative metabolism in all areas of the orbitofrontal cortex in comparison with normal volunteers. However, controls had higher white matter activation on all areas except for the right Brodmann area 12, (diagnostic group, hemisphere, Brodmann area, activity within matter type; F = 4.19, df = 2, 22, p = 0.29, see Figure 4).
Figure 4.

Saline condition activity in the orbitofrontal cortex. Patients show increased activity in the orbitofrontal cortex gray matter and decreased activity in the white matter.
Doxapram effect
Upon receiving doxapram, both the controls and the subjects with panic disorder showed decreased activity in the gray matter of the orbitofrontal cortex. In white matter, the controls had decreased activity with drug; PD subjects showed increased activity in BA areas 11 and 12, (diagnostic group by treatment by Brodmann area by tissue type; F = 6.61, df = 2, 22, p = 0.006, see Figure 5).
Figure 5.

Doxapram effect in the orbitofrontal cortex. Both patients and controls showed deactivation in the gray matter of the orbitofrontal cortex with doxapram. The patients increased in activity in the white matter.
Anterior Prefrontal Cortex
Placebo condition
On placebo, subjects with panic disorder had more activity in the gray matter of BA 9 and 10 than the control group. In addition, PD subjects had less activity throughout the white matter of the anterior prefrontal cortex than controls (diagnostic group by hemisphere by Brodmann area by matter type; F = 5.21, df = 2, 22, p = 0.14, see Figure 6).
Figure 6.
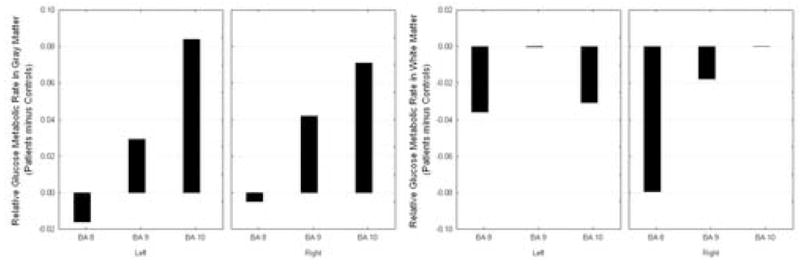
Saline condition activity in the anterior prefrontal cortex. In the anterior prefrontal cortex, the Panic Disorder patients show increased activity in the gray matter but decreased white matter activity.
Doxapram effect
Analysis with treatment revealed no main effects by diagnosis or significant interactions.
Cingulate Gyrus
Placebo condition
We entered the Brodmann areas that consist of the cingulate region (BA 25, 24, 31, 23, 29) into a similar analysis as above. Subjects with panic disorder had higher activity than the control group in the gray matter of the cingulate except for BA 23 (Wilks lambda = 0.327, F = 4.114, df = 4,8, p = 0.042, see Figure 7).
Figure 7.
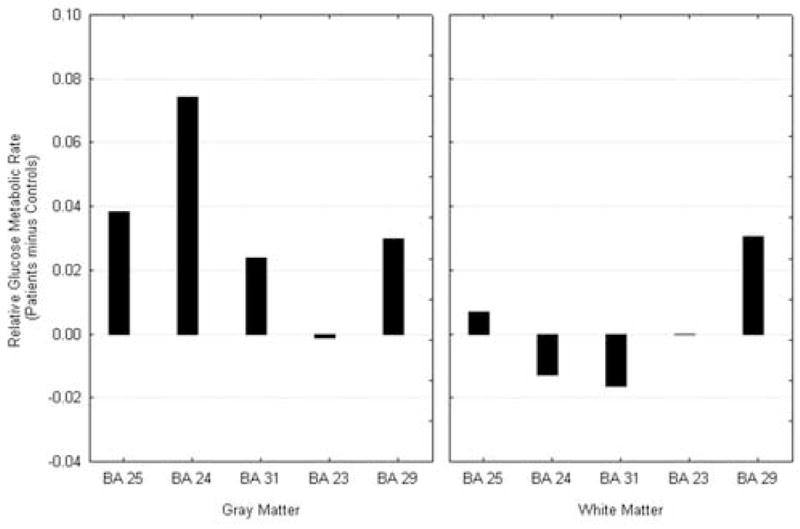
Cingulate Activity at Saline condition. Cingulate gyrus arch shows patients with relatively higher activity than normals in the anterior portion and lower in the midsection; white matter shows decreases throughout.
Doxapram effect
Panic disorder subjects showed increased activity in the left gray matter of BA 25, 23, and 29 with doxapram; in contrast, we observed a decrease in metabolism in these regions in the control population. On the right hemisphere, PD subjects increased in activity in BA 23, whereas activation decreased in controls with doxapram. In addition, panic disorder subjects decreased in relative metabolism in the gray matter of right BA 24 and 29, and control subjects increased in activation with doxapram in these areas (group by treatment by hemisphere by Brodmann area by matter type; F = 3.47, df = 4,44, p = 0.15; see Figure 8).
Figure 8.
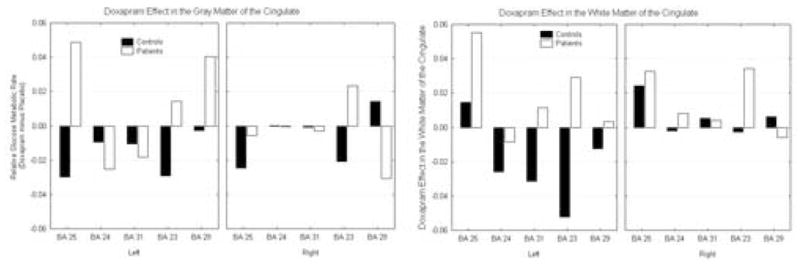
Doxapram effect on the cingulate. Patients show increases and controls decreases in anterior cingulate gyrus gray matter and larger increases than controls in anterior cingulate white matter.
We also observed activation in the white matter of the cingulate with doxapram. On the left hemisphere, the panic disorder subjects increased in activation in the white matter in BA 31, 23, and 29, whereas, the control population decreased in activation with doxapram. On the right hemisphere, the panic disorder subjects showed increased activation in BA 24, and 23, and the control sample decreased in activation in these areas. In the right white matter of BA 29, the panic disorder subjects decreased whereas the control population increased with doxapram (see Figure 9).
Figure 9.
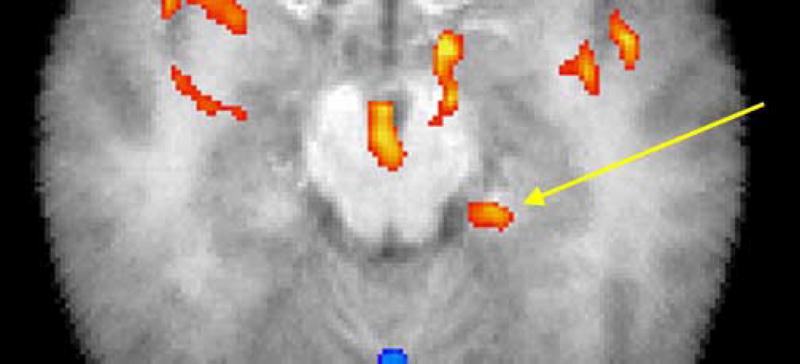
Statistical mapping for test of greater amygdala activation in patients with panic disorder than in normal controls. Confirmatory mapping of amygdala hypothesis: red indicates areas with greater doxapram-induced activation in panic disorder patients than in normal controls; t-test on doxapram minus placebo relative metabolic rate, p < 0.05, 1-tailed. Arrow marks 40 pixel patch in amygdala/hippocampus centered at −22, −13, −16; anterior edge at −22, −10, −16, which is on the edge of the gray matter of the parahippocampal gyrus 41%, amygdala 32%, 7×7×7 search box on Talairach daemon, using excel2td. http://ric.uthscsa.edu/projects/tdc/suggestedUses.html. The patch has a mean t of 2.36 and the highest t is 3.17, df = 11, p < 0.005.
Hippocampus
Hippocampal volume
We segmented the volume of the hippocampus into four equally spaced, anterior-to-posterior segments. PD subjects had a significantly higher volume of the hippocampus (4210 mm3, SD = 506) than that of the control sample (3730 mm3, SD = 207); (main effect of diagnosis; F = 5.13, df = 1,11, p = 0.045) and this was most marked in the first two anterior segments (diagnostic group by segmented section; Wilks lambda = 0.405, F= 4.41, df = 3,9, p = 0.036). Volume relative to whole brain size did not show significant differences although the effect was essentially the same (F = 3.63, df = 3, 9, Wilks lambda = 0.452, p = 0.057).
Hippocampal metabolic effects
There were no significant group differences on placebo for metabolic rates or effects of doxapram.
Amygdala
Placebo condition
Amygdala volume and glucose metabolic rate did not differ significantly by ANOVA between normal volunteers and patients. Exploratory t-tests revealed a larger right top of the amygdala in patients (1061 mm3, SD = 104) than in normal volunteers (934 mm3, SD = 100, t = 2.24, p = 0.046).
Doxapram effect
ANOVA did not confirm significant differences in amygdala activation between normal volunteers and patients.
Statistical probability mapping
Statistical probability mapping (drug minus placebo) confirms the elevated activity due to doxapram in the amygdala of patients (see Figure 9). We similarly calculated paired t-tests on four levels of the brain (Matsui-Harano levels 8–11; see Figure 10) and provide a table indicating the areas of the brain which were significantly activated (red) or blunted (blue) in patients due to doxapram (see Table 2).
Figure 10.

SPM Maps of MH levels 8–11. Confirmatory mapping of amygdala hypothesis: red indicates areas with greater doxapram-induced activation in panic disorder patients than in normal controls; t-test on doxapram minus placebo relative metabolic rate. Each numbered patch refers to the table above. The threshold is p<0.05, 1-tailed (dark red margin of each spot), but the reader can choose the preferred p value from the table. Thus the center of the amygdala (see table) is 3.17, p = 0.005.
Table 2.
Values of areas delineated in SPM analysis of MH levels 8–11.
| Area | x | y | z | Max Value | Primary Region (7×7 voxel analysis) | Secondary Region | |
|---|---|---|---|---|---|---|---|
| MH 8 | 1 | 21 | 35 | 12 | 3.83 | Right Frontal Lobe Sub-Gyral White Matter (70%) | Anterior Cingulate White Matter (18%) |
| 2 | −2 | 49 | 12 | −5.71 | BA 10 Gray Matter (35%) | Inter-Hemispheric (32%) | |
| 3 | 8 | 9 | 12 | −4.48 | Caudate Gray Matter (77%) | Lateral Ventricle (23%) | |
| 4 | −7 | 14 | 12 | −3.04 | Caudate Gray Matter (49%) | Lateral Ventricle (45%) | |
| 5 | 6 | −29 | 12 | −4.48 | Extra-Nuclear White Matter (56%) | Corpus Callosum (35%) | |
| 6 | 24 | −49 | 12 | −3.45 | Lateral Ventricle (42%) | Extra-Nuclear White Matter (38%) | |
| 7 | 39 | −50 | 12 | 5.61 | Sub-Gyral White Matter (54%) | Superior Temporal Gyrus White Matter (39%) | |
| 8 | 18 | −72 | 12 | −3.82 | Occipital Lobe Cuneus White Matter (52%) | BA 30 Gray Matter (22%) | |
| 9 | 1 | −68 | 12 | 3.67 | Occipital Lobe Cuneus (13%) | Posterior Cingulate (13%) | |
| 10 | −10 | −69 | 12 | 3.45 | Occipital Lobe Cuneus White Matter (22%) | BA 23 Gray Matter (15%) | |
| 11 | −40 | −55 | 12 | 3.00 | Temporal Lobe Sub-Gyral White Matter (35%) | Middle Temporal Gyrus White Matter (26%) | |
| 12 | −38 | −71 | 12 | −3.42 | Temporal Lobe Sub-Gyral White Matter (44%) | Middle Occipital Gyrus White Matter (31%) | |
| MH 9 | 1 | −3 | 57 | 4 | −3.81 | BA 10 Gray Matter (42%) | Medial Frontal Gyrus White Matter (23%) |
| 2 | 44 | 32 | 4 | −4.26 | Inferior Frontal Gyrus (100%) | N/A | |
| 3 | 40 | 14 | 4 | −3.52 | Insula White Matter (41%) | BA 13 Gray matter (37%) | |
| 4 | 46 | −8 | 4 | 3.01 | Sub-Lobar Insula (29%) | BA 13 Gray Matter (28%) | |
| 5 | 60 | −23 | 4 | −3.48 | Superior Temporal Gyrus White Matter (85%) | BA 22 Gray Matter (12%) | |
| 6 | 40 | −25 | 4 | 3.94 | Superior Temporal Gyrus White Matter (27%) | Extra-Nuclear White Matter (25%) | |
| 7 | 42 | −42 | 4 | 4.50 | Sub-Gyral White Matter (71%) | Middle Temporal Gyrus White Matter (20%) | |
| 8 | 13 | −14 | 4 | 3.32 | Thalamus: Ventral Lateral Nucleus (39%) | Thalamus Gray Matter (37%) | |
| 9 | −11 | −20 | 4 | 5.15 | Thalamus Gray Matter: Mammillary Body (40%) | Thalamus Gray Matter (33%) | |
| 10 | −29 | −26 | 4 | 4.43 | Sub-Lobar Extra Nuclear White Matter (98%) | Thalamus Gray Matter (2%) | |
| 11 | −40 | −34 | 4 | 2.49 | Temporal Lobe Sub-Gyral White Matter (71%) | Superior Temporal Gyrus White matter (21%) | |
| 12 | −35 | 0 | 4 | 4.03 | Sub-Lobar Extra Nuclear White Matter (43%) | Sub-Lobar Insula White Matter (35%) | |
| 13 | −47 | −21 | 4 | 4.07 | Superior Temporal Gyrus White Matter (64%) | BA 22 (18%) | |
| 14 | −49 | −52 | 4 | 5.63 | Middle Temporal Gyrus White Matter (100%) | N/A | |
| 15 | 14 | −60 | 4 | 6.33 | Occipital Lobe, Lingual Gyrus White Matter (55%) | Posterior Cingulate White matter (13%) | |
| 16 | −5 | −73 | 4 | 4.90 | BA 18 Gray Matter (30%) | Occipital Lobe, Lingula Gyrus White Matter (22%) | |
| 17 | 0 | −89 | 4 | 3.03 | BA 17 Gray Matter (10%) | Inter-Hemispheric Matter (10%) | |
| 18 | −26 | −90 | 4 | 2.76 | Middle Occipital Gyrus White Matter (55%) | Occipital Sub-Gyral White Matter (19%) | |
| MH 10 | 1 | −10 | 65 | −4 | 2.54 | Medial Frontal gyrus BA 10 Gray Matter (28%) | Superior Frontal Gyrus BA 10 Gray Matter (21%) |
| 2 | 1 | 33 | −4 | −3.47 | Right Anterior Cingulate (33%) | Left Anterior Cingulate (19%) | |
| 3 | 14 | 20 | −4 | 4.00 | Frontal Lobe Sub-Gyral White matter (31%) | Sub-Lobar Extra Nuclear White Matter (28%) | |
| 4 | 34 | −2 | −4 | 3.07 | Sub-Lobar Extra Nuclear White Matter (59%) | Sub-Lobar Claustrum Gray Matter (22%) | |
| 5 | 51 | −30 | −4 | 3.67 | Middle Temporal Gyrus White Matter (70%) | Temporal Lobe Sub-Gyral White Matter (19%) | |
| 6 | 29 | −37 | −4 | −5.12 | Parahippocampal Gyrus White Matter (61%) | Temporal Lobe Sub-Gyral White Matter (17%) | |
| 7 | 5 | −16 | −4 | 3.65 | Right Brainstem (65%) | Right Brainstem, Gray Matter Red Nucleus (28%) | |
| 8 | −11 | −29 | −4 | 3.01 | Left Brainstem (67%) | Midbrain (26%) | |
| 9 | −30 | −17 | −4 | 3.31 | Sub-Lobar Extra Nuclear White matter (42%) | Putamen Gray Matter (38%) | |
| 10 | 0 | −58 | −4 | −4.80 | Left Anterior Lobe, Culmen (55%) | Right Anterior Lobe, Culmen (41%) | |
| 11 | −42 | −60 | −4 | −3.37 | Occipital Lobe Sub-Gyral White Matter (67%) | Temporal Lobe Sub-Gyral White Matter (28%) | |
| 12 | 0 | −58 | −4 | −4.80 | Left Culmen (55%) | Right Culmen (41%) | |
| 13 | −1 | −83 | −4 | 6.49 | BA 18 Gray Matter (38%) | Right Occipital Lobe Lingual Gyrus (9%) | |
| 14 | 39 | −81 | −4 | 3.40 | Right Inferior Occipital Gyrus White Matter (35%) | BA 19 Gray Matter (22%) | |
| MH 11 | 1 | 43 | 18 | −16 | 3.09 | BA 38 Gray Matter (29%) | Inferior Frontal Gyrus (20%) |
| 2 | 43 | 3 | −16 | 2.38 | Superior Temporal Gyrus White Matter (56%) | Temporal Lobe Sub-Gyral White Matter (39%) | |
| 3 | 2 | −1 | −16 | 3.76 | Ventricle (62%) | White Matter (28%) | |
| 4 | −12 | 7 | −16 | 4.58 | Left Frontal Lobe (28%) | Subcallosal Gyrus White Matter (21%) | |
| 5 | −43 | 8 | −16 | 3.32 | Superior Temporal Gyrus White Matter (55%) | BA 38 Gray Matter36%) | |
| 6 | −54 | 11 | −16 | 3.82 | BA 38 Gray Matter (57%) | Superior Temporal Gyrus White Matter (20%) | |
| 7 | −1 | −38 | −16 | −4.00 | Left Brainstem (56%) | Right Brainstem (22%) | |
| 8 | −23 | −60 | −16 | 2.98 | Left Posterior Lobe, Declive (95%) | Left Anterior Lobe, Culmen (5%) | |
| 9 | −22 | −13 | −16 | 3.17 | Parahippocampal Gyrus White Matter (41%) | Amygdala Gray Matter (32%) |
Heart rate
Placebo condition correlations with heart rate
The healthy controls had significant negative correlation between the entire left amygdala and the average heart rate measured during the baseline saline scan (−0.80, p = 0.032). The panic subjects had a positive correlation (r = 0.33, p =0.330) and the group difference was at a trend level (p = 0.092). The panic subjects also had a significant negative correlation between right gray matter activity in the entire frontal lobe and heart rate during the doxapram scan (r = −0.94, p = 0.006), while the controls had a r = −0.22, p = 0.639 correlation. The group difference was not significant (p = 0.079).
There was a negative correlation between the baseline right orbital division of the frontal lobe and the average heart rate difference (doxapram minus placebo) in the patient population (r = −0.87*) indicating that the lower the frontal activation initially the greater the doxapram-related heart rate increase; the controls had a r = 0.41 correlation and the group difference was p = 0.046.
DISCUSSION
This pilot study was the first to actually image patients with panic disorder and control subjects during acute increase in panic symptoms. Despite the small sample size, the doxapram challenge was successful in creating a strongly different physiological response with much greater heart rate and respiratory increase to doxapram in patients versus controls. This large and nearly uniform difference between controls and patients supports the validity of the doxapram challenge (at least in the current population), consistent with earlier studies (Lee et al., 1993; Abelson et al., 1996a, b), including ours (Gutman et al., 2005; Kent et al., 2005). In addition, anxiety symptom severity increased significantly on doxapram more in panic patients than in normal controls.
The frontal cortex showed regionally different effects in its response to the doxapram challenge in the two groups. In the dorsolateral prefrontal cortex, normals increased their metabolic rate with doxapram, while panic patients decreased their metabolic rate. This is consistent with our hypothesis that prefrontal inhibition of panic response is a component of the normal reaction to stress. It is also consistent with the finding of Abelson et al. (2005) that a verbal cognitive intervention moderated the response of panic patients to an endocrine stress and our finding of the most marked patient differential in Brodmann area 45 in the left hemisphere speech region is intriguing. The finding that patients with PD had greater metabolic increases in the amygdala than controls suggests that while controls are using their frontal lobes in inhibiting doxapram-induced panic, patients are failing to do so and therefore having greater symptomatic response.
The gray matter of the orbitofrontal cortex shows a decrease with doxapram in both controls and patients, although greater in patients; white matter showed an increase in patients and decrease in controls. One might speculate that in the laboratory setting, dorsolateral, cognitive mechanisms are more likely to be activated than orbitofrontal affective mechanisms, or that an integrated whole prefrontal response to respiratory stress is necessary to suppress behavioral symptoms.
Patients showed greater increases with doxapram than controls in the posterior cingulate gyrus. This result is similar to that of Maddock et al. (2003) who found greater threat-related fMRI activation to word lists containing stress-related words in panic disorder patients than controls (terror, victim, injury, cancer, panic, dangerous, threatening, emergency, violence, destroyed) in the posterior cingulate. They also found greater left frontal activation in panic patients, unlike our finding of greater dorsolateral activation in normals. The threat words might well be expected to activate left frontal regions, so differences in results may be attributable to the use of abstract verbal concepts in their study and autonomic distress in ours. Importantly, our area of greatest patient/normal difference in FDG-PET activation was Brodmann area 25, an area related to visceral sensation, while area 25 did not show differential activation in the verbal threat word study of Maddock et al. (2003).
One major limitation of our study is the small sample size, which may be associated with failure to confirm some regional prefrontal effects or interactions, and contributed to poor statistical power for the investigation of individual differences in magnitude of response. However the sample size was adequate to produce robust and statistically significant group differences in autonomic effects as well as prefrontal FDG-PET effects. A second limitation was that the saline placebo condition was not a separate day without expectancy of doxapram, making the separation of anticipatory anxiety about doxapram administration and actual pharmacological effects of doxapram difficult. Another possibility is that patients had memories of earlier panic attacks triggered by the doxapram experience and therefore had altered prefrontal function just as EEG may be differentially altered in volunteers and patients during recall of panic attacks (e.g. Bob et al., 2006). However, if memory recall rather than actual panic were involved, one might have expected the greatest difference in FDG response in the hippocampus and amygdala rather than orbitofrontal cortex.
This is, to our knowledge, the first study to document greater amygdala activation during panic-related stress among panic disorder patients compared to controls. Our findings here support our hypothesis (Gorman et al., 2000) that panic attacks involve abnormal decrease in prefrontal function and increase in amygdala function. Specifically, we conclude from these data that during the panicogenic stress represented by doxapram injection, panic disorder patients did not activate the dorsolateral prefrontal cortex sufficiently to inhibit amygdala response. It will be of great interest to see if these findings can be replicated with a larger sample size and if effective anti-panic treatment normalizes brain metabolic responses to doxapram among patients with panic disorder.
Acknowledgments
The authors thank Dr. Erin Hazlett, Dr. Mehmet Haznedar, Jason Martinez, and Elizabeth LiCalzi for administrative, clinical, and technical assistance.
Footnotes
Publisher's Disclaimer: This is a PDF file of an unedited manuscript that has been accepted for publication. As a service to our customers we are providing this early version of the manuscript. The manuscript will undergo copyediting, typesetting, and review of the resulting proof before it is published in its final citable form. Please note that during the production process errors may be discovered which could affect the content, and all legal disclaimers that apply to the journal pertain.
References
- Abelson JL, Nesse RM, Weg JG, Curtis GC. Respiratory psychophysiology and anxiety: cognitive intervention in the doxapram model of panic. Psychosom Med. 1996a;58:302–313. doi: 10.1097/00006842-199607000-00002. [DOI] [PubMed] [Google Scholar]
- Abelson JL, Weg JG, Nesse RM, Curtis GC. Neuroendocrine responses to laboratory panic: cognitive intervention in the doxapram model. Psychoneuroendocrinology. 1996b;21:375–90. doi: 10.1016/0306-4530(96)00005-4. [DOI] [PubMed] [Google Scholar]
- Abelson JL, Liberzon I, Young EA, Khan S. Cognitive Modulation of the Endocrine Stress Response to a Pharmacological Challenge in Normal and Panic Disorder Subjects. Arch Gen Psychiatry. 2005;62:668–675. doi: 10.1001/archpsyc.62.6.668. [DOI] [PubMed] [Google Scholar]
- Abelson JL, Khan S, Liberzon I, Young EA. HPA axis activity in patients with panic disorder: review and synthesis of four studies. Depress Anxiety. 2007;24:66–76. doi: 10.1002/da.20220. [DOI] [PubMed] [Google Scholar]
- Anand A, Shekhar A. Brain imaging studies in mood and anxiety disorders: special emphasis on the amygdala. Ann NY Acad Sci. 2003;985:370–388. doi: 10.1111/j.1749-6632.2003.tb07095.x. [DOI] [PubMed] [Google Scholar]
- Armony JL, Dolan RJ. Modulation of spatial attention by fear-conditioned stimuli: An event-related fMRI study. Neuropsychologia. 2002;40:817–826. doi: 10.1016/s0028-3932(01)00178-6. [DOI] [PubMed] [Google Scholar]
- Bakker A, van Balkom A, Spinhoven P, Blaauw B, van Dyck R. Follow-up on the treatment of panic disorder with or without agoraphobia: A quantitative review. J Nerv Ment Dis. 1998;186:414–419. doi: 10.1097/00005053-199807000-00005. [DOI] [PubMed] [Google Scholar]
- Barlow DH, Craske MG. Mastery of your anxiety and panic (MAP-3) 3. Graywind Publications, Inc; New York: 2000. [Google Scholar]
- Barlow DH, Gorman JM, Shear MK, Woods SW. Cognitive-behavioral therapy, imipramine, or their combination for panic disorder: A randomized controlled trial. JAMA. 2000;283:2529–36. doi: 10.1001/jama.283.19.2529. [DOI] [PubMed] [Google Scholar]
- Bechara A, Damasio H, Damasio AR. Emotion, decision making, and the orbitofrontal cortex. Cereb Cortex. 2000;10:295–307. doi: 10.1093/cercor/10.3.295. [DOI] [PubMed] [Google Scholar]
- Bisaga A, Katz JL, Antonini A, Wright CE, Margouleff C, Gorman JM, Eidelberg D. Cerebral glucose metabolism in women with panic disorder. Am J Psychiatry. 1998;155:1178–83. doi: 10.1176/ajp.155.9.1178. [DOI] [PubMed] [Google Scholar]
- Bob P, Kukleta M, Riecansky I, Susta M, Kukumberg P, Jagla F. Chaotic EEG patterns during recall of stressful memory related to panic attack. Physiol Res. 2006;55 (Suppl 1):S113–9. doi: 10.33549/physiolres.930000.55.S1.113. [DOI] [PubMed] [Google Scholar]
- Borg GA. Psychophysical bases of perceived exertion. Med Sci Sports Exercise. 1982;14:377–381. [PubMed] [Google Scholar]
- Burki NK. Ventilatory effects of doxapram in conscious human subjects. Chest. 1984;85:600–604. doi: 10.1378/chest.85.5.600. [DOI] [PubMed] [Google Scholar]
- Bourin M, Malinge M, Guitton B. Provocative agents in panic disorder. Therapie. 1995;50:301–6. [PubMed] [Google Scholar]
- Cahill L, McGaugh JL. Mechanisms of emotional arousal and lasting declarative memory. Trends Neurosci. 1998;21:294–299. doi: 10.1016/s0166-2236(97)01214-9. [DOI] [PubMed] [Google Scholar]
- Calverley PM, Robson RH, Wraith PK, Prescott LF, Flenley DC. The ventilatory effects of doxapram in normal man. Clin Sci (Lond) 1983;65:65–69. doi: 10.1042/cs0650065. [DOI] [PubMed] [Google Scholar]
- Choi SH, Kim SJ, Park SH, Moon BH, Do E, Chun BG, Lee MS, Shin KH. Doxapram increases corticotropin-releasing factor immunoreactivity and mRNA expression in the rat central nucleus of the amygdala. Peptides. 2005;26:2246–51. doi: 10.1016/j.peptides.2005.03.036. [DOI] [PubMed] [Google Scholar]
- Davis M. The role of the amygdala in fear and anxiety. Annu Rev Neurosci. 1991;15:353–375. doi: 10.1146/annurev.ne.15.030192.002033. [DOI] [PubMed] [Google Scholar]
- Diagnostic and statistical manual of mental disorders. 4. American Psychiatric Association; Washington, DC: 2000. [Google Scholar]
- Dillon DJ, Gorman JM, Liebowitz MR, Fyer AJ, Klein DF. Measurement of lactate-induced panic and anxiety. Psychiatry Res. 1987;20:97–105. doi: 10.1016/0165-1781(87)90002-3. [DOI] [PubMed] [Google Scholar]
- Foa EB, Franklin ME, Moser J. Context in the clinic: How well do cognitive-behavioral therapies and medications work in combination? Biol Psychiatry. 2002;52:987–997. doi: 10.1016/s0006-3223(02)01552-4. [DOI] [PubMed] [Google Scholar]
- Folgering H, Vis A, Ponte J. Ventilatory and circulatory effects of doxapram, mediated by carotid body chemoreceptors. Bull Eur Physiopathol Respir. 1981;17:237–41. [PubMed] [Google Scholar]
- Fredrikson M, Furmark T. Amygdaloid regional cerebral blood flow and subjective fear during symptom provocation in anxiety disorders. Ann NY Acad Sci. 2003;985:341–7. doi: 10.1111/j.1749-6632.2003.tb07092.x. [DOI] [PubMed] [Google Scholar]
- Furmark T, Tillfors M, Marteinsdottir I, Fischer H, Pissiota A, Langstrom B, Fredrikson M. Common changes in cerebral blood flow in patients with social phobia treated with citalopram or cognitive-behavioral therapy. Arch Gen Psychiatry. 2002;59:425–33. doi: 10.1001/archpsyc.59.5.425. [DOI] [PubMed] [Google Scholar]
- Gorman JM, Browne ST, Papp LA, Martinez J, Welkowitz L, Coplan JD, Goetz RR, Kent J, Klein DF. Effect of antipanic treatment on response to carbon dioxide. Biol Psychiatry. 1997;42:982–991. doi: 10.1016/s0006-3223(97)00160-1. [DOI] [PubMed] [Google Scholar]
- Gorman JM, Kent JM, Sullivan GM, Sullivan GM, Coplan JD. Neuroanatomical hypothesis of panic disorder, revised. Am J Psychiatry. 2000;157:493–505. doi: 10.1176/appi.ajp.157.4.493. [DOI] [PubMed] [Google Scholar]
- Gorman JM, Kent J, Martinez J, Browne S, Coplan J, Papp LA. Physiological changes during carbon dioxide inhalation in patients with panic disorder, major depression, and premenstrual dysphoric disorder: evidence for a central fear mechanism. Arch Gen Psychiatry. 2001;58:125–31. doi: 10.1001/archpsyc.58.2.125. [DOI] [PubMed] [Google Scholar]
- Graeff FG. Serotonin, the periaqueductal gray and panic. Neurosci Biobehav Rev. 2004;28:239–59. doi: 10.1016/j.neubiorev.2003.12.004. [DOI] [PubMed] [Google Scholar]
- Grove G, Coplan JD, Hollander E. The neuroanatomy of 5-HT dysregulation and panic disorder. J Neuropsychiatry Clin Neurosci. 1997;9:198–207. doi: 10.1176/jnp.9.2.198. [DOI] [PubMed] [Google Scholar]
- Gutman DA, Coplan J, Papp L, Martinez J, Gorman J. Doxapram-induced panic attacks and cortisol elevation. Psychiatry Res. 2005;133:253–61. doi: 10.1016/j.psychres.2004.10.010. [DOI] [PubMed] [Google Scholar]
- Guy W. US Dept of Health, Education, and Welfare publication (ADM) 76–338. National Institute of Mental Health; Rockville, MD: 1976. ECDEU Assessment Manual for Psychopharmacology; pp. 218–222. [Google Scholar]
- Hariri AR, Bookheimer SY, Mazziotta JC. Modulating emotional responses: Effects of a neocortical network on the limbic system. Neuroreport. 2000;11:43–48. doi: 10.1097/00001756-200001170-00009. [DOI] [PubMed] [Google Scholar]
- Hazlett EA, Buchsbaum MS, Byne W, Wei TC, Spiegel-Cohen J, Geneve C, Kinderlehrer R, Haznedar MM, Shihabuddin L, Siever LJ. Three-dimensional analysis with MRI and PET of the size, shape, and function of the thalamus in the schizophrenia spectrum. Am J Psychiatry. 1999;156:1190–1199. doi: 10.1176/ajp.156.8.1190. [DOI] [PubMed] [Google Scholar]
- Houtman IL, Bakker FC. The anxiety thermometer: a validation study. J Pers Assess. 1989;53:575–82. doi: 10.1207/s15327752jpa5303_14. [DOI] [PubMed] [Google Scholar]
- Kent JM, Papp LA, Martinez JM, Browne ST, Coplan JD, Klein DF, LeDoux JE. Emotion: Clues from the brain. Annu Rev Psychol. 1995;46:209–235. doi: 10.1146/annurev.ps.46.020195.001233. [DOI] [PubMed] [Google Scholar]
- Kent JM, Coplan JD, Mawlawi O, Martinez JM, Browne ST, Slifstein M, Martinez D, Abi-Dargham A, Laruelle M, Gorman JM. Prediction of panic response to a respiratory stimulant by reduced orbitofrontal cerebral blood flow in panic disorder. Am J Psychiatry. 2005;162:1379–81. doi: 10.1176/appi.ajp.162.7.1379. [DOI] [PubMed] [Google Scholar]
- Lane RD, Reiman EM, Ahern GL, Schwartz GE, Davidson RJ. Neuroanatomical correlates of happiness, sadness and disgust. Am J Psychiatry. 1997;154:926–933. doi: 10.1176/ajp.154.7.926. [DOI] [PubMed] [Google Scholar]
- LeDoux JE. Emotion: Clues from the brain. Annu Rev Psychol. 1995;46:209–235. doi: 10.1146/annurev.ps.46.020195.001233. [DOI] [PubMed] [Google Scholar]
- Liberzon I, Taylor SF, Amdur R, Jung TD, Chamberlain KR, Minoshim S, Koeppe RA, Fig LM. Brain activation in PTSD in response to trauma-related stimuli. Biol Psychiatry. 1999;45:817–826. doi: 10.1016/s0006-3223(98)00246-7. [DOI] [PubMed] [Google Scholar]
- Lee YJ, Curtis GC, Weg JG, Abelson JL, Modell JG, Campbell KM. Panic attacks induced by doxapram. Biol Psychiatry. 1993;33:295–297. doi: 10.1016/0006-3223(93)90299-s. [DOI] [PubMed] [Google Scholar]
- Maddock RJ, Buonocore MH, Kile SJ, Garrett AS. Brain regions showing increased activation by threat-related words in panic disorder. Neuroreport. 2003;4:325–8. doi: 10.1097/00001756-200303030-00006. [DOI] [PubMed] [Google Scholar]
- Morris JS, Frith CD, Perrett DI, Rowland D, Young AW, Calder AJ, Dolan RJ. A differential neural response in the human amygdala to fearful and happy facial expressions. Nature. 1996;383:812–815. doi: 10.1038/383812a0. [DOI] [PubMed] [Google Scholar]
- Nordahl TE, Semple WE, Gross M, Mellman TA, Stein MB, Goyer P, King AC, Uhde TW, Cohen RM. Cerebral glucose metabolic differences in patients with panic disorder. Neuropsychopharmacology. 1990;3:261–72. [PubMed] [Google Scholar]
- Nordahl TE, Stein MB, Benkelfat C, Semple WE, Andreason P, Zametkin A, Uhde TW, Cohen RM. Regional cerebral metabolic asymmetries replicated in an independent group of patients with panic disorders. Biol Psychiatry. 1998;44:998–1006. doi: 10.1016/s0006-3223(98)00026-2. [DOI] [PubMed] [Google Scholar]
- Peterson RA, Reiss S. Test manual for the Anxiety Sensitivity Index. International Diagnostic Systems; Orland Park, IL: 1987. [Google Scholar]
- Prasko J, Horacek J, Zalesky R, Kopecek M, Novak T, Paskova B, Skrdlantova L, Belohlavek O, Hoschl C. The change of regional brain metabolism (18FDG PET) in panic disorder during the treatment with cognitive behavioral therapy or antidepressants. Neuro Endocrinol Lett. 2004;25:340–8. [PubMed] [Google Scholar]
- Rauch SL, Shin LM, Wright CI. Neuroimaging studies of amygdala function in anxiety disorders. Ann NY Acad Sci. 2003;985:389–410. doi: 10.1111/j.1749-6632.2003.tb07096.x. [DOI] [PubMed] [Google Scholar]
- Rosenkranz JA, Grace AA. Cellular mechanisms of infralimbic and prelimbic prefrontal cortical inhibition and dopaminergic modulation of basolateral amygdala neurons in vivo. J Neuroscience. 2002;22:324–337. doi: 10.1523/JNEUROSCI.22-01-00324.2002. [DOI] [PMC free article] [PubMed] [Google Scholar]
- Rosenkranz JA, Grace AA. Modulation of basolateral amygdala neuronal firing and afferent drive by dopamine receptor activation in vivo. J Neuroscience. 1999;19:11027–11039. doi: 10.1523/JNEUROSCI.19-24-11027.1999. [DOI] [PMC free article] [PubMed] [Google Scholar]
- Sakai Y, Kumano H, Nishikawa M, Sakano Y, Kaiya H, Imabayashi E, Ohnishi T, Matsuda H, Yasuda A, Sato A, Diksic M, Kuboki T. Cerebral glucose metabolism associated with a fear network in panic disorder. Neuroreport. 2005;16:927–31. doi: 10.1097/00001756-200506210-00010. [DOI] [PubMed] [Google Scholar]
- Schaefer SM, Jackson DC, Davidson RJ, Aguirre GK, Kimberg DY, Thompson-Schill SL. Modulation of amygdalar activity by the conscious regulation of negative emotion. J Cogn Neurosci. 2002;14:913–921. doi: 10.1162/089892902760191135. [DOI] [PubMed] [Google Scholar]
- Shear MK, Brown TA, Barlow DH, Money R, Sholomskas DE, Woods SW, Gorman JM, Papp LA. Multicenter collaborative panic disorder severity scale. Am J Psychiatry. 1997;154:1571–1575. doi: 10.1176/ajp.154.11.1571. [DOI] [PubMed] [Google Scholar]
- Sullivan GM, Apergis J, Gorman JM, LeDoux JE. Rodent doxapram model of panic: behavioral effects and c-Fos immunoreactivity in the amygdala. Biol Psychiatry. 2003;53:863–70. doi: 10.1016/s0006-3223(02)01733-x. [DOI] [PubMed] [Google Scholar]
- Tabert MH, Borod JC, Tang CY, Lange G, Wei TC, Johnson R, Nusbaum AO, Buchsbaum MS. Differential amygdala activation during emotional decision and recognition memory tasks using unpleasant words: an fMRI study. Neuropsychologia. 2001;39:556–573. doi: 10.1016/s0028-3932(00)00157-3. [DOI] [PubMed] [Google Scholar]
- Whalen PJ, Rauch SL, Etcoff NL, McInerney SC, Lee MB, Jenike MA. Masked presentations of emotional facial expression modulate amygdala activity without explicit knowledge. J Neurosci. 1998;18:411–418. doi: 10.1523/JNEUROSCI.18-01-00411.1998. [DOI] [PMC free article] [PubMed] [Google Scholar]
- Winnie AP. Chemical respirogenesis: a comparative study. Acta Anaesthesiol Scand. 1973;(Supp 51):1–32. [PubMed] [Google Scholar]
- Woods R, Mazziota J, Cherry S. MRI-PET registration with automated algorithm. J Comput Assist Tomogr. 1993;17:536–546. doi: 10.1097/00004728-199307000-00004. [DOI] [PubMed] [Google Scholar]