

Abstract
Purpose
To detect changes in the neurosensory retina from spectral domain optical coherence tomography (SDOCT) imaging over drusen in age-related macular degeneration (AMD). Quantitative imaging biomarkers may aid in defining risk of progression and lead to better treatment options for AMD.
Design
Cross-sectional, case-control study evaluating SDOCT testing in AMD.
Participants and Controls
Seventeen eyes of twelve subjects with non-neovascular AMD and drusen and seventeen eyes of ten age-matched control subjects.
Methods
SDOCT imaging across the fovea in the study eye with multiple 10 to 12 mm scans of 1000 A-scans each.
Main Outcome Measure
In summed SDOCT scans, the height of individual retinal layers either over drusen or at corresponding locations in the control eye. Secondary measure: Photoreceptor layer (PRL) area, inner retinal area and retinal pigment epithelium (RPE)/drusen area. Qualitative changes in retinal layers over drusen.
Results
The PRL was thinned over 97% of drusen, the average PRL thickness was reduced by 27.5% over drusen compared to over a similar location in controls, and the finding of a difference was valid and significant (P=0.004). Photoreceptor outer segments were absent over at least one druse in 47% of eyes.. Despite thinning of the PRL, inner retinal thickness remained unchanged. We observed two types of hyper-reflective abnormalities in the neurosensory retina over drusen. First, distinct hyper-reflective speckled patterns occurred over drusen in 41% of AMD eyes and never in control eyes. Second, a prominent hyper-reflective haze was present in the photoreceptor nuclear layer over drusen in 67% of AMD eyes and more subtly in the photoreceptor nuclear layer in 18% of control eyes (no drusen).
Conclusions
With SDOCT as used in this study, we can easily detect and measure changes in PRL over drusen. Decreased PRL thickness over drusen suggests a degenerative process with cell loss leading to decreased visual function. The hyper-reflective foci overlying drusen are likely to represent progression of disease with RPE cell migration into the retina and possible photoreceptor degeneration or glial scar formation. A longitudinal study using SDOCT to examine and measure the neurosensory retina over drusen will resolve the timeline of these degenerative changes relative to druse formation.
Introduction
We report results from our search for imaging biomarkers of neurosensory retinal injury from age-related macular degeneration (AMD), which is the leading cause of visual impairment in patients over the age of 65 in the developed world. 1, 2 An estimated 8 million persons over age 55 in the United States have monocular or binocular intermediate AMD or monocular advanced AMD. If neurosensory retinal injury is promptly detected and measured, then the recent advances in genetics, cell and molecular biology, and pharmacologic therapeutic approaches can be more effectively studied and applied to benefit AMD treatment. 3, 4
Drusen are extracellular deposits that accumulate between the retinal pigment epithelium (RPE) and the inner collagenous layer of Bruch’s membrane5 and are known as a risk factor for the initial pathologic stage of AMD.5,6 CFH gene haplotypes have been associated with both the presence of drusen and advanced AMD.7 It is hypothesized that patients have a progressive loss of vision due to accumulation of drusen.2 There have been several postmortem studies of the relationship between photoreceptors and underlying drusen. Curcio et al.8 reported a correlation between the presence of drusen and photoreceptor cell death in the retinas of eyes diagnosed with AMD. Johnson and colleagues identified both structural and functional photoreceptor changes in postmortem studies of retina over drusen.9, 10 They documented focal changes in photoreceptor cell density, gene expression, and synapses over drusen. Other studies show that lipid peroxidase in Bruch’s membrane11 or retinal pigment epithelium (RPE) lysosomes12 causes RPE cell death initiating the AMD pathologic process. It has also been proposed that the accumulation of abnormal material between the outer retina and the choriocapillaris interferes with the exchange of nutrients and waste products, inducing RPE and/or neural retinal damage.13, 14
Although appearance of a few drusen is normal with aging, greater accumulation of extracellular sub-RPE deposits is an indicative of AMD, which may later progress to more severe forms such as choroidal neovascularization (CNV) and non-neovascular geographic atrophy (GA). Large multicenter studies have been undertaken to prevent or delay the onset of visual loss due to AMD. The Age-Related Eye Disease Study (AREDS) reported that AMD patients with advanced cases of dry AMD or vision loss due to wet AMD in one eye or extensive intermediate size drusen, at least one large druse, or noncentral geographic atrophy in both eyes could delay the onset of severe AMD and its accompanying vision loss by taking a high-dose vitamin and mineral supplement.15 Earlier identification of the patients at higher risk for developing advanced AMD will allow even earlier protective intervention to reduce vision loss.16
Current measure of the level of early AMD is based on size and extent of drusen, and not on an objective measure of the neurosensory retina.17 Subjective testing of neurosensory retinal function such as with the preferential hyperacuity perimeter has been suggested as an indicator of the level of AMD, however, this testing requires patient interaction and feedback as an endpoint.18, 19 Unfortunately, once severe AMD develops (either neovascular AMD or geographic atrophy), most treatments have sub-optimal visual outcomes. Therefore, novel approaches to identify patients at high risk for developing severe AMD and to provide early protective intervention are critical for reducing vision loss from this disease.
In this work, we examine structural neurosensory retinal abnormalities in early AMD relative to sites of drusen. The purpose of this study is to investigate the effects of drusen on the overlying retina in vivo. The in vivo study of the PRL morphologic changes may relate closely to histopathologic studies done by Green et al., which demonstrate a relationship between the loss of RPE and photoreceptor layer (PRL).20, 21 Unlike previous reports, which studied photoreceptor degeneration through histopathology,9, 10 our study utilizes in vivo high-resolution optical imaging. Although such imaging modality may be limited by relying on the relatively weak reflectivity contrast of intraretinal structures, it gains from the simplicity of non-invasive clinical testing and from the absence of postmortem artifacts that confound histopathology studies.
Methods
Optical coherence tomography (OCT) is the only in vivo imaging modality capable of resolving cross-sectional retinal substructure (Figure 1A). The novel spectral domain optical coherence tomography (SDOCT) systems produce cross-sectional high-resolution images of tissue and achieve axial resolution of about five microns (Figure 1B). SDOCT (20,000 A-scans/sec) is 50 times faster than the conventional time-domain OCT (400 A-scans/sec as in Stratus-OCT, Carl Zeiss Meditec, Dublin, CA). Therefore, ophthalmic imaging via SDOCT significantly reduces artifact due to patient movement and ocular contractions.22 SDOCT is well-suited to image the changes seen in AMD, as RPE, the site of many pathologic changes in AMD, is well delineated with this imaging. Differences in reflectivity between different intraretinal tissue layers and other material such as drusen allow identification of pathologic structures (Figure 1B). Moreover, in a fraction of the time required to capture a single time-domain OCT image, tens of SDOCT B-scans (Figure 1B) can be recorded, registered, and averaged creating an image with much less noise than any individual frame23 (Figure 1C).
Figure 1.
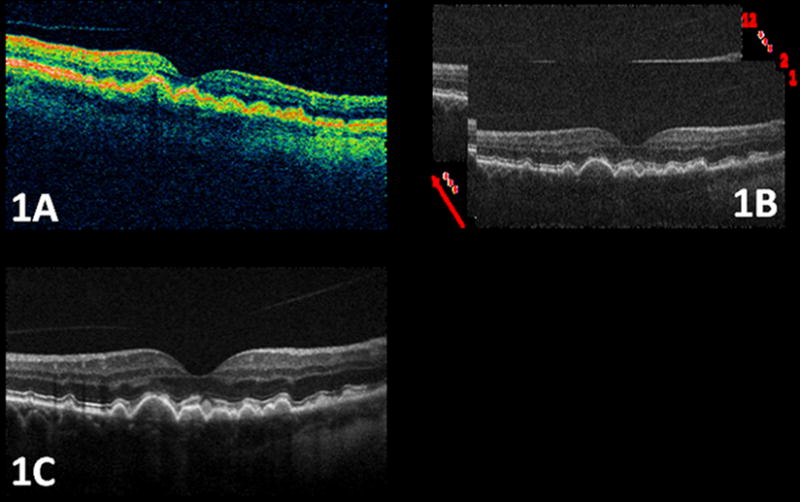
An example of the high quality Spectral Domain Optical Coherence Tomography (SDOCT) images of the macula in a patient with age-related macular degeneration used for this study compared to the conventional time-domain OCT systems. Figure 1A. is a time-domain OCT (Stratus, Carl Zeiss Meditec, Dublin, CA) image, in which drusen area appears fuzzy. As shown in Fig. 1B, each individual image (B-scan) of the SDOCT system has a significantly higher spatial resolution and better noise characteristics than images from the conventional time-domain OCT system. The image quality can be further enhanced by registering and fusing a sequence of captured B-scans. The image shown in Fig. 1C is created by registering and averaging 12 raw SDOCT B-scans, with significantly higher signal to noise power ratio. The arrow in Fig. 1B shows the direction of image fusion (averaging).
All subjects were enrolled in this Duke University Institutional Review Board-approved study between August 9, 2005 and January 26, 2007 and provided informed consent for SDOCT imaging and investigator access to ophthalmic records. Enrolled subjects were controls with no known ocular pathology, other than mild to moderate cataract, or had a clinical diagnosis of non-neovascular AMD on fundus examination in at least one eye, with at least one druse of greater than 125 microns diameter. Eyes with scans of poor resolution of retinal layers or with GA, CNV, or subretinal fluid were excluded.
The SDOCT system used in this study was an investigational device, developed in the laboratory of Dr. Joseph Izatt of the Duke University Department of Biomedical Engineering, and enhanced for macular imaging of AMD in collaboration with Cynthia Toth, M.D. The system light source is a superluminescent diode (SLD) developed by Superlum Diodes Ltd. (Moscow, Russia) with wavelength centered at 840nm and bandwidth of 49nm. The power incident on the retina during SDOCT scanning is 500±50μW over maximum 6 seconds, well below the accepted ANSI extended exposure limit of 700μW over 8 hours.24 The incident light wavelength was 840nm with 49nm bandwidth. The axial resolution of the SDOCT system was about 4.5μm, the transverse resolution was about 10μm, and the acquisition time was set at 20,000 A-scan/sec.
In each eye, regardless of the drusen density, fifteen B-scans per eye with 1000 A-scans/B-scan were acquired by scanning repeatedly across the center of the fovea (nasal to temporal) in about 0.75 seconds. Bioptigen SDOCT software (version 1.4; Bioptigen, Inc.; Research Triangle Park, NC) was used for SDOCT scanning and image acquisition. The lateral dimensions of the scans were 12 mm (39 degrees) in 3 AMD eyes, and 10 mm (33 degrees) in 14 AMD eyes and 17 control eyes. All scans were scaled for proper comparison and analysis.
Stacks of 15 SDOCT B-scans were imported to ImageJ (freeware; National Institutes of Health; Bethesda, MD) for analysis. In each stack, we visually inspected the shape of the retinal and subretinal structures, such as RPE and the vessel pattern. To reduce patient motion artifacts, we discarded the images with significantly different structures compared to the majority of the B-scans in each stack. Sequential alignment of the remaining 8 to 15 B-scans (registering frame #1 to frame #2, and then frame #2 to frame #3, and so on and so forth) was accomplished by using the StackReg plug-in (Biomedical Imaging Group; Swiss Federal Institute of Technology Lausanne) for ImageJ.25 These registered B-scans were then averaged to reduce random background noise and enhance visualization of retinal layers, creating a single high-quality B-scan per eye. Figure 1B–C compares a set of unprocessed (raw) SDOCT B-scans with a corresponding processed B-scan.
The processed B-scans were used for analysis in ImageJ. Qualitative scoring of AMD and control eyes included scoring for presence or absence of: cystoid macular edema, subretinal fluid, hyperreflective foci within the retina, and loss of any retinal layer, including photoreceptor inner or outer segments. The photoreceptor inner segments (located between the slightly reflective external limiting membrane and the more highly reflective band at the photoreceptor inner segment/outer segment junction) and outer segments (between the reflective band at the photoreceptor inner segment/outer segment junction and the RPE) represented a very thin layer. Therefore, these segments were scored as present or absent rather than with thickness measurements.
In each AMD eye, the width of each druse was measured. For each druse larger than 200μm across, the following measurements were made (Figure 2A):
Figure 2.

Measuring the thickness of the retinal layers in eyes with age-related macular degeneration (AMD) and normal eyes. On each druse of the AMD eye of Fig. 2A, the druse height (including retinal pigment epithelium (RPE)), the photoreceptor layer (PRL) height, and the inner retina layer heights are marked with blue, green, and red lines (and arrows with matching color), respectively. Similar coloring scheme is used for the normal eye shown in Fig. 2B. Due to the absence of druse the blue line only represents the height of RPE layer in the control eye. Note the thinning of the PRL in Fig. 2A compared to Fig. 2B.
Height of druse, including RPE. This was the height measured from the base of the druse through the top of the RPE.
Height of PRL, which was measured as the distance between the top of RPE and the outer plexiform layer (OPL).
Height of inner retina (IR), which was measured as the distance between the OPL and inner limiting membrane (ILM).
Retinal layers change in thickness across the macula. Therefore, in control eyes, height was measured (Figure 2B) at sites corresponding to the druse location, nasal or temporal to the fovea, in the AMD eyes. Due to the absence of drusen in these control eyes, for measurement #1, only the height of the RPE was considered. The extent of PRL thinning over each druse was compared to the PRL height at the corresponding location in control eyes.
For layer segmentation and analysis, the summed B-scans of both AMD and control eyes were imported into Amira software (Amira version 4.1; Mercury Computer Systems; Carlsbad, CA). The three layers, delineated by the three height measurements explained above, were segmented semi-automatically with manual post-correction (Figure 3). As explained in the next section, the areas of all layers were measured for comparison.
Figure 3.
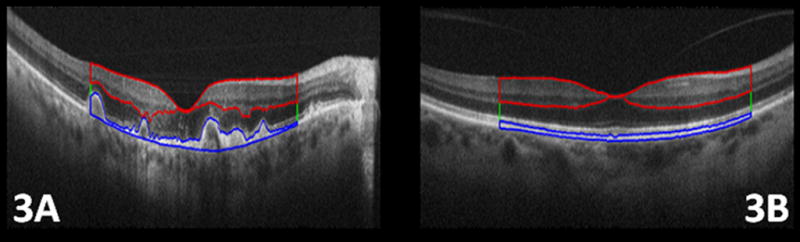
Following the layer definitions in Figure 2, three distinct layer areas were semi-automatically segmented using Amira software. Fig 3. A, and Fig 3. B show the segmented retinal pigment epithelium (RPE) and drusen (blue line), photoreceptor layer (green line), and inner retina (IR) layers (red line), in a subject with age-related macular degeneration and control eye, respectively. In this figure, we have only marked the outer borders of the photoreceptor layer, which is located between the RPE and IR layers.
Statistical Methods
Although observations from different subjects are independent, those from the same eye and those from two eyes of each subject may be correlated. This type of data is called clustered data. In spite of the possible dependency, the estimators obtained by ignoring dependency, called estimators based on a working independence model, are still unbiased or consistent for large number of independent subjects. We adjust the dependency when we calculate the variance estimator of an estimator using the generalized estimating equation method of Liang and Zeger26 and reported the two sided P-values when appropriate. Statistical methods are detailed further in Appendices A, B, C, and D.
Results
Seventeen eyes of twelve patients with non-neovascular AMD and seventeen eyes of ten control patients were scanned with SDOCT and underwent analysis. The age range of enrolled non-neovascular AMD subjects was 66 to 82 years, with a median age of 74 years; six patients and nine eyes were female. The age range of enrolled control subjects was 62 to 74 years, with a median age of 68 years; seven patients and twelve eyes were female. The mean visual acuity of the AMD eyes was logMAR 0.22 (approximately 20/32−, with standard deviation of 0.21) and of the control eyes was 0.06 (approximately 20/25+, with standard deviation of 0.14). Two control eyes had visual acuity of less than 20/40 due to cataract with normal fundus exam.
A qualitative difference in the PRL was visible focally over drusen. In most eyes, the drusen appeared to bulge into the PRL, without corresponding displacement of the overlying inner retinal layers. With SDOCT, evaluation of the PRL could be divided into photoreceptor nuclear layer, photoreceptor inner segments, and photoreceptor outer segments. In all control eyes both the external limiting membrane (a faint reflective band above the photoreceptor inner segment/outer segment junction) and the photoreceptor outer segments (including the prominent hyperreflective band at the photoreceptor inner segment/outer segment junction) appeared grossly normal and in many AMD eyes these also appeared normal without thinning over the drusen. However, in eight of 17 AMD eyes (47%), there was definite photoreceptor outer segment loss focally over at least one druse. In each case this was also associated with disruption or loss of the reflective band at the photoreceptor inner segment/outer segment junction. It was difficult to judge whether the external limiting membrane (ELM) was definitely abnormal at each of these sites. We found no cystoid macular edema, subretinal fluid, or loss of any inner retinal layer.
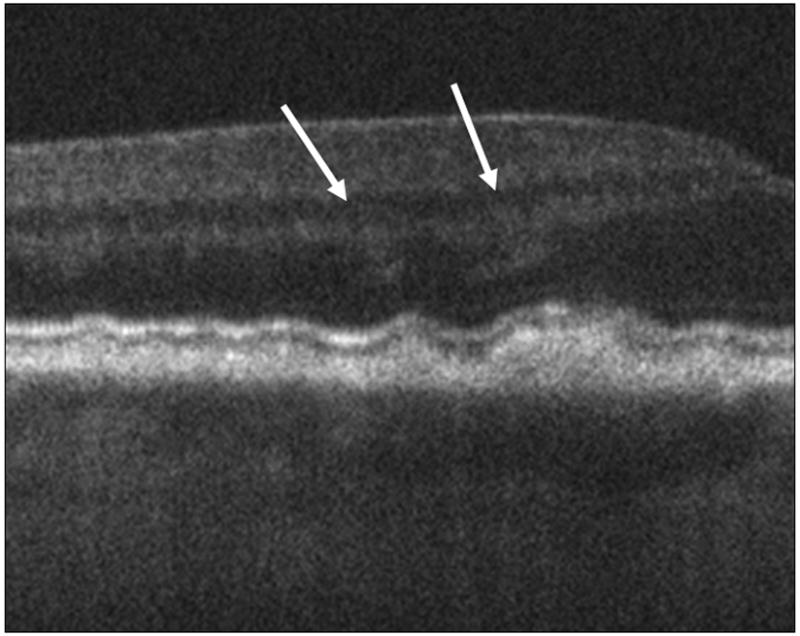
The photoreceptor nuclear layer showed faint hyper-reflective haze in three of 17 control eyes (18%) and prominent hyper-reflective haze associated with sites of drusen in 11 of 17 AMD eyes (67%). The reflective haze in the AMD eyes was a focal poorly demarcated increase in reflectivity of the photoreceptor nuclear layer over drusen or extending laterally on the non foveal side of the druse (Figure 4A and 4B). The haze was less common and less prominent over smaller drusen. It was not present over all large drusen and did not correlate with loss of the photoreceptor outer segments. Within the PRL, intense hyper-reflective foci were present in 7 of the 17 AMD eyes (41%) and in none of the control eyes. These foci were located over or laterally within 200 microns of drusen and not in areas without drusen (Figure 5). Although the outer borders of the OPL demonstrated some blurring over drusen, otherwise there was no qualitative change to the inner retinal layers except for a shift in position over drusen.
Figure 4.
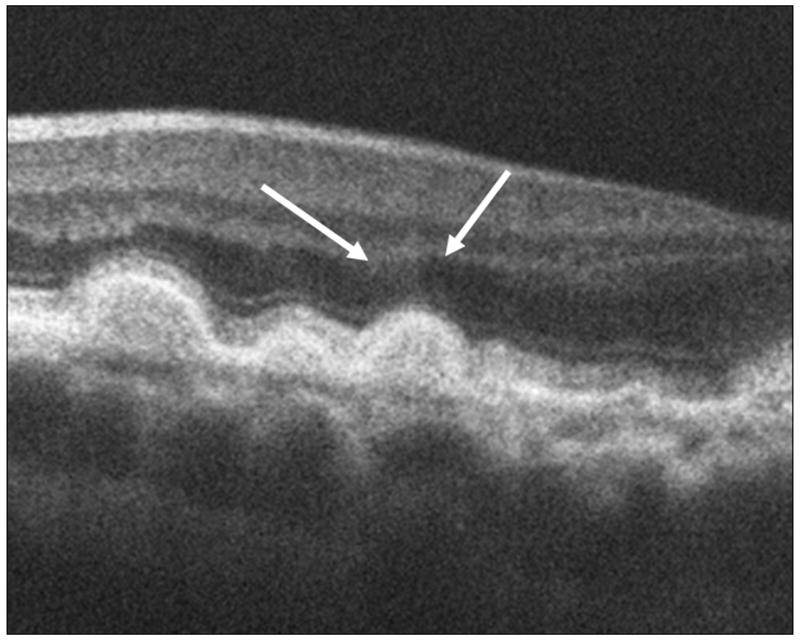
The arrows in these spectral domain optical coherence tomography (SDOCT) B-Scans point to the sites of prominent diffuse hyper-reflective haze located over drusen in two different eyes (4A, 4B). In these eyes the haze extends over the non-foveal margin of the drusen. This haze was present over drusen in 67% of eyes.
Figure 5.
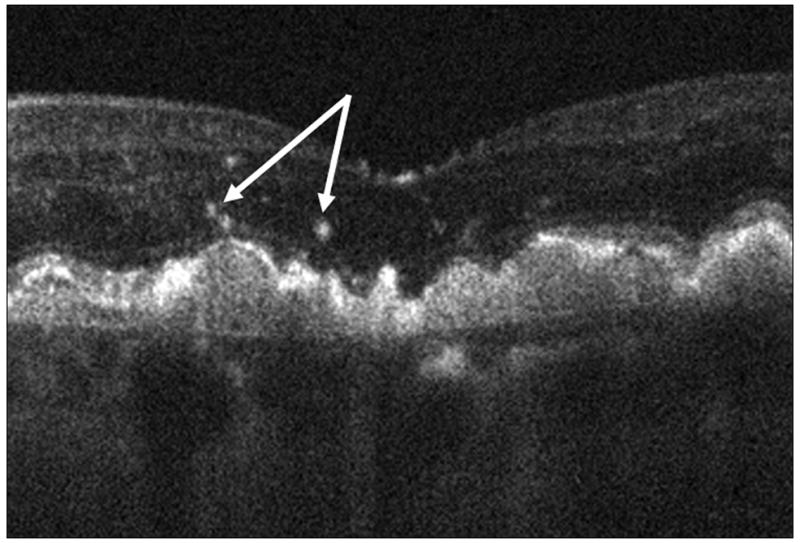
Focal hyper-reflective speckling (arrows) was visible over and immediately adjacent to 41% of drusen and in none of the control images.
Over almost every druse (97% of cases), the PRL height (thickness) was decreased in the AMD eyes compared to the PRL height at the corresponding location in control eyes (Figure 6). There were only two sites (3%) where the PRL height over drusen was greater than the corresponding PRL height in control eyes (the two points on the positive side of the “Change in the PRL Thickness (%)” axis in Figure 6). As demonstrated in Appendix 1 (available at http://aaojournal.org), the claim that the PRL height was decreased in the AMD eyes compared to the PRL height at the corresponding location in control eyes is valid (|T̂/σ̂|= 2.87 > 0.95) and statistically significant (P=0.004). The PRL was reduced an average of 27.5% over drusen in study AMD eyes compared to the corresponding retinal location in control eyes.
Figure 6.

The photoreceptor layer (PRL) height (thickness) at drusen locations in age-related macular degeneration (AMD) eyes are compared to the corresponding values at similar distances from the center of the fovea in the controlled eyes. In almost all cases (97%), the PRL thickness in the AMD eyes (circles) was thinner than the healthy controlled eyes (curved line with error bars representing the 95% confidence interval).
The decrease in photoreceptor thickness was more pronounced in areas over larger drusen, compared with smaller drusen. Drusen height had a much stronger correlation than drusen width with the extent of PRL thinning over drusen locations (Figure 7). As described in Appendix 2 (available at http://aaojournal.org), the slope of the linear regression line drusen height and width with percent PRL thinning were −0.32 (P=0.0355) and −0.018 (P=0.420), respectively (Figure 7A–B).
Figure 7.


Relation between drusen, height and width with respect to the change in photoreceptor layer (PRL) thickness is examined. The slope of the dashed-line, which represents the linear regression fit (described in Appendix B), is a measure of correlation between the change in PRL thickness and drusen height (or width). It is evident from these graphs that the effect of the drusen height in PRL thinning is more prominent than the effect of drusen width as illustrated in Fig. 7A and Fig. 7B, respectively.
Unlike PRL, the IR thickness remained almost unchanged over drusen. Figure 8, shows that in almost all distances from the fovea, the IR thickness in AMD eyes is very similar to a corresponding location relative to the fovea in the control eyes. As demonstrated in Appendix 1 (available at http://aaojournal.org), the claim that the IR height was decreased in the AMD eyes compared to the IR height at the corresponding location in control eyes is not valid |T̂/σ̂|= 0.6 < 0.95 and not statistically significant (P=0.547). Figure 9 compares the total area of the three retinal layers (PRL, inner retina, and RPE) measured in this report. Following Appendix 3 (available at http://aaojournal.org), the mean PRL area for AMD eyes was 1.06 mm2 (1.01,1.11), compared with 1.10 mm2 (1.06,1.13) in control eyes where the values inside the parentheses are the lower and higher 95% confidence bounds. This difference was not statistically significant (P=0.153). The mean IR area in AMD eyes was 1.13 mm2 (1.07,1.20), compared with 1.12 mm2 (1.06,1.13) in control eyes, this difference was not statistically significant (P=0.346). Finally, the mean RPE area in AMD eyes was 0.43 mm2 (0.38,0.49), compared with 0.31 mm2 (0.15,0.35) in control eyes, this difference was statistically significant (P=0.001). In 12 of 17 AMD eyes (71%) the RPE area was greater than the maximum area of any control eye. In the AMD eyes, the increase in the (total) RPE area (due to the presence of drusen) correlated with the decrease in the (total) PRL area (ρ̂ = −0.65, P=0.05), where following Appendix 4 (available at http://aaojournal.org), ρ̂ is the slope of the linear regression line. On the other hand, in the control eyes, such correlation was small and without statistical significance (ρ̂ = −0.02, P=0.46). In addition, the correlations between the PRL and IR areas in the AMD (ρ̂ = −0.09, P=0.42) and the control (ρ̂ = 0.09, P=0.41) eyes were not statistically significant. In the AMD eyes, the increase in the RPE area and the loss of the IR area showed a trend towards correlation (ρ̂ = −0.49, P=0.14); while in control eyes increase in the RPE area was associated with an increase of the IR area (ρ̂ = 0.52, P=0.008).
Figure 8.

The Inner Retinal height (thickness) measured at drusen locations in age-related macular degeneration (AMD) eyes are compared to the corresponding values at similar distances from the center of the fovea in the controlled eyes. The inner retinal (IR) thickness in AMD eyes (circles) is not significantly different than the healthy controlled eyes (curved line with error bars representing the 95% confidence interval).
Figure 9.

Averaged measured total areas of the inner retinal (IR), photoreceptor layer (PRL), retinal pigment epithelial (RPE) layer in eyes of subjects with age-related macular degeneration and control eyes. Error bars represent the 95% confidence interval. Aside from the evident change in the RPE area, no significant change is seen on the averaged area of IR and PRL. This further confirms the importance of the local thickness change study in Fig. 6. AMD = age-related macular degeneration
Discussion
Using high-speed high resolution SDOCT imaging, retinal layers can now be measured in living eyes with non-neovascular AMD, with a precision adequate to measure focal abnormalities over drusen. In the series of AMD eyes studied here, there was a significant and profound decrease in thickness of the PRL focally over drusen compared to age-matched control eyes, while the inner retinal layers were unaffected. The decrease in PRL correlated well with druse height and minimally with druse width. Although the difference in PRL area between AMD and control eyes was not significant (perhaps due to the very small area occupied by drusen relative to the total PRL area), the increase in RPE area (which included drusen) correlated with a decrease in PRL area in the AMD eyes. Despite the PRL changes over drusen, the mean area of the PRL layer did not differ between AMD and control eyes. This analysis supports an association between drusen and focal loss of the photoreceptor layer in eyes with AMD but suggests a lack of widespread photoreceptor loss (although there could be loss at a level not detectable in this small sample).
This finding of in vivo PRL thinning over drusen with preservation of the inner retinal layers correlates with previously published postmortem studies of photoreceptor loss in non-exudative AMD. Curcio et al identified moderate photoreceptor loss in the parafovea, with rod loss greater than cone loss at the same location.8, 27 Focal loss of photoreceptors was not recorded over specific drusen; however, the photoreceptor loss did appear more widespread than noted in our in vivo study. The postmortem finding of no difference in the ganglion cell layer between the non-exudative AMD eyes and controls agrees with our finding of comparable inner retinal layer thickness between AMD and control eyes. Our findings of decrease in PRL thickness by approximately 25% over drusen also compares favorably to the Johnson et al.9 postmortem observation that photoreceptor density was consistently decreased (mean of approximately 30%) over drusen. The authors divided drusen into four categories ranging from extremely small (31–50 μm) to the largest of 91 μm diameter and over. Although photoreceptor cell density progressively decreased as druse width increased in the postmortem study of smaller drusen, in this in vivo SDOCT study of eyes with drusen greater than 125 μm, the photoreceptor layer thickness correlated closely to druse height and not as closely with druse width.
Note that the width of some of the drusen in this study clearly exceeded the typical maximum size on color fundus photograph of up to 434 μm (based on the diameter of the I-2 ring and an optic nerve diameter of 1800 μm) after which it is more likely to be classified as drusenoid pigment epithelial detachment (there is no specific size endpoint between a druse, coalescent drusen, and drusenoid pigment epithelial detachment). In the AREDS grading system of AMD phenotypes,17 drusen are categorized by a hard or soft appearance based on “uniformity of density, sharpness of edges and thickness.”17 and maximum diameter is also recorded. Drusenoid pigment epithelial detachment is differentiated from drusen and scored as questionable, present or absent, but size is not recorded. The differentiation between confluent drusen (margins in contact) and drusenoid PED is not explicitly defined in phenotyping studies, but becomes more obvious in cross-sectional imaging with SDOCT with lateral measurement of drusen. In the SDOCT images, there are multiple occurrences of drusen with confluent margins, resulting in a large lateral dimension for the drusen although there is no single broad domed lesion (Figure 7B). Toth et al. reported a greater lateral extent of drusen identified on SDOCT compared to corresponding color photographs for level 3 AMD eyes (Toth C.A., Farsiu S., Chiu S.J., Khanifar A.A., Izatt J.A., Automatic Drusen Segmentation and Characterization in Spectral Domain Optical coherence Tomography (SDOCT) Images of AMD Eyes. Paper presented at: ARVO annual meeting, May 1, 2008; Fort Lauderdale, FL). In a separate publication, we are addressing a system of categorizing drusen by size, shape and composition so as to relate the SDOCT findings to conventional color fundus images.23
In addition to the quantitative changes in the retina over drusen, with high-speed high-resolution SDOCT imaging, we can also record and measure qualitative difference in retinal imaging over drusen compared to age-matched non-AMD control eyes. The notable qualitative changes on SDOCT were the absence of the photoreceptor outer segments with the associated loss or disruption of the highly reflective photoreceptor inner segment/outer segment junction, the hyper-reflective haze within the remaining photoreceptor nuclear layer over drusen and hyper-reflective speckles over and adjacent to drusen. The findings of a decrease in photoreceptor height, focal loss of the photoreceptor outer segments and abnormal reflectivity at the site of remaining photoreceptors over drusen, supports the argument that neurosensory retinal degeneration is present in eyes with high risk drusen and is present before the development of geographic atrophy or choroidal neovascularization.
The hyper-reflective changes over drusen may represent multiple stages of a single process or potentially two different processes over drusen. Possible causes include an abnormal deposit such as pigment, displaced or migrated RPE cells or macrophages with pigment inside, exudates, lipid, or even blood within the retina or a degenerative retinal process. Some very intensely reflective intraretinal foci have been associated with hyperpigmentation on color fundus photographs.23 Focal pigment abnormalities have been associated with higher risk of progression to severe AMD,28, 30 and hyper-reflective sites on SDOCT may represent a precursor to larger pigment clumps, which are visible on fundus photographs, and thus might be an earlier risk indicator for druse progression. This question is being addressed in a longitudinal study ancillary to the Age Related Eye Disease Study 2 (AREDS2).31 In the AREDS2 Ancillary SDOCT Study (online at http://clinicaltrials.gov/ct2/show/NCT00345176. Accessed October 6, 2008) larger SDOCT image datasets across the entire macula will be compared to conventional imaging in high risk drusen eyes with annual follow up for up to five years.
An inflammatory process or a degenerative retinal process such as in synaptic terminals could also cause focal PRL hyper-reflectivity if sub-cellular abnormalities increased the “normal” reflectivity of that site. We theorize that a degenerative cellular process may cause the less intense and more diffuse hyper-reflective haze visible within the photoreceptor nuclear layer. Because SDOCT reflectivity changes range from mild and diffuse to more focal and intense, these sites may represent a spectrum of abnormalities in photoreceptors overlying drusen. In postmortem studies, Johnson, et al. found that photoreceptors overlying and flanking drusen exhibited morphologic signs of degeneration including changes in localization of synaptic proteins within cells, the location and structure of the synaptic terminals, and in expression of stress response proteins.9, 10 Although abnormalities in the synaptic terminal of photoreceptor cells have also been shown in an experimental model of neovascular AMD, from which Caicedo et al. proposed that macrophages migrating into the neurosensory retina may initiate the neurosensory retinal dysfunction,32 a possible relationship between SDOCT hyper-reflectivity in the PRL and synaptic terminal dysfunction requires further study for validation.
In this SDOCT study, images of the PRL over drusen were captured at a single timepoint in the progression of AMD. Fortunately, with this non-contact method of imaging the living eye, we will be able to repeat these measurements over time to assess the relationships between drusen development and photoreceptor loss. To date, there are multiple theories regarding the relationship between drusen and the neurosensory retina in the early stages of AMD. These have ranged from photoreceptor degeneration (particularly rod loss) preceding further RPE loss and drusen progression8 to several theories of changes in Bruch’s membrane, drusen formation, or RPE degeneration causing photoreceptor degeneration.9,33 For example, drusen may affect photoreceptors by physical displacement damaging their structural integrity, or by compromising the function of RPE cells, a prerequisite for normal photoreceptor cell function and maintenance of the retinal microenvironment.9 Drusen may block the normal diffusion of metabolic materials between the photoreceptors and choroidal blood supply, leading to concentration of waste13,14 near the RPE and inhibition of the diffusion of oxygen, glucose, and nutritive serum-associated molecules required to maintain the health of the outer retina and RPE.13, 14 Although analysis of current SDOCT images will not aid in selecting between these theories, the use of these precise morphologic measurements over time, in conjunction with functional testing, should aid in the stratification of stages of disease progression. Moreover, since significant photoreceptor effects are already imaged with SDOCT in eyes with high-risk drusen, this imaging is also likely to be useful to investigate earlier events in drusen formation and photoreceptor change prior to high risk drusen. Detection and analysis of change in photoreceptors over smaller drusen in longitudinal studies might result in earlier predictors of AMD progression. Alternately, because with SDOCT we are now able to detect and measure changes in ultrastructural drusen components23 and the effect of drusen on the surrounding retina in vivo, it is appropriate to search for either a relationship between these events and progression to severe disease or earlier signs of CNV or of geographic atrophy development.
The focal qualitative and quantitative changes in the PRL over drusen suggest measurable photoreceptor loss and likely dysfunction. These may be useful biomarkers for visual impairment associated with drusen and may predict the subsequent course of disease progression. Because the anomalous findings varied notably from patient to patient, there is a possibility that they are associated with specific genotype, systemic biomarkers, or with environmental exposure.
For SDOCT to be effective in AMD studies, researchers will need to know the reproducibility of qualitative grading, variance of drusen volume, photoreceptor, and other retinal layer measurements across a three-dimensional (3D) region of interest in the macula. This is in contrast to the more limited sample across the macula in this study. Investigators in the aforementioned AREDS2 Ancillary SDOCT Study will address these ideas in addition to the predictive value of qualitative and quantitative data in the longitudinal SDOCT imaging across a 3D central section of the macula.
Acknowledgments
The authors wish to thank Aziz A. Khanifar, MD for providing essential information for the database upon which this study was built.
Cynthia A. Toth, MD: Genentech (research support, consultant), Sirion Theraputics (research support), Bioptigen, Inc. (research support), Alcon Laboratories, Inc. (research support and patent royalties), North Carolina Biotechnology Center (research support). This project was funded in part by Bioptigen, Duke University and The North Carolina Biotechnology Center in a Collaborative Funding Grant #2007-CFG-8005, and by NIH R21 EY017393. Sin-ho Jung’s work was supported by Grant 1 UL1 RR024128-01 from the NCRR of NIH.
Appendix 1. Comparison of the photoreceptor layer (or inner retina) thickness over drusen in control eyes versus age-related macular degeneration eyes
For the age-related macular degeneration (AMD) group, let xl(iljl) denote the photoreceptor layer (PRL) thickness at location l for eye jl of patient il with a measurement at location (distance from fovea) l. Patient i(=1,…,n) contributes m1i (=1 or 2) eyes, and n = 12 patients with AMD contributed a total of eyes. Each eye of an AMD patient has 1 to 12 drusen locations, which summs to a total of L1 = 65 drusen locations from 17 eyes.
Each control eye contributes L2 = 57 observations, one for each of the 57 locations which are chosen exactly or very close to the L1 = 65 drusen locations of the AMD group. For the control group, let y denote the PRL thickness at location l(=1,…,L) for eye j(=1,…,m2i) of patient i(=1,…,n2). In the control group, n2 = 9 healthy subjects contributed a total of eyes.
Testing
For location l, we have one observation, xl(iljl), from the AMD group and L2 =17 observations, {yli′j′,1 ≤ j′ m2i′,1 ≤ i′ ≤ n2} from the control group. Let denote the proportion of the control eyes, whose PRL thickness is larger than that from a diseased eye at the same location l. We will have F̂l (xl(iljl)) ≈ 1/2 if the average PRL thickness is not changed by drusen, and F̂l (xl(iljl)) will tend to be larger than 1/2 if the average PRL thickness decreases by drusen. Let D denote the range of distance. We consider following hypotheses
against
Let Fl (·) denote the expected value of F̂l (·). Under H0, the expected value of Fl (xl(iljl)) is 1/2 and F̂l (·) is a consistent estimator of Fl (·) for large n2. So, we propose to reject H0 if the absolute value of
is large.
We derive the distribution of T using the large sample theory (with respect to n1 and n2) for clustered data26. By the large sample approximation, we have
where Fl (xl(iljl)) − 1/2 are mean 0 random variables under H0. Let , where (j,l) ∈ (i) denotes the collection of all eyes j and locations l belonging to patient i. Then, by the central-limit-theorem (CLT) under H0, T is approximately normally distributed with mean 0 and variance σ2 that can be consistently estimated by26
where . Hence, we can reject H0 if |T̂/σ̂|> z1−α/2, where z1−α/2 is the 100(1− α/2) percentile of the standard normal distribution.
Conficence Intervals
For location l, let μl =E(yijl) denote the mean PRL thickness for healthy eyes, which is estimated as . Then, μ̂l is approximately normal with mean μl and variance that can be estimated by26
Hence, a 100(1−α) confidence interval for μl is given as .
Appendix 2. Correlation between change in photoreceptor layer thickness and drusen height (or width)
For the age-related macular degeneration (AMD) group, let xijl denote the drusen height (or width) and ỹijl denote the photoreceptor layer (PRL) thickness at location l(= 1,…, s) for eye j(=1,…,m1i) of patient i(=1, …,n1). Let μ̂l denote the average PRL thickness at location l from the 17 healthy (control) eyes. For location l, the percentage change in the PRL thickness due to drusen is measured by yijl = 100(ỹijl − μ̂l)/μ̂l. We consider a linear regression model
The hypotheses on the association between the drusen height and percentage change in the PRL thickness can be expressed by
and
Let and . By ignoring the dependency among the observation from each patient, the consistent estimators of (β0, β1) are obtained via regular least square estimator as
Considering possible dependency among observations from the two eyes of a patient and those from multiple locations of an eye, we obtain the variance estimator of β̂1 by
where . Hence, we reject H if the absolute value of T = β̂1/σ̂(β̂) is large. For large n1, the null distribution of T is approximately normal26 with mean 0 and variance 1.
From the data, we obtain (β̂0, β̂1) = (8.865,−0.321), σ̂ (β̂) = 0.178, and two-sided p-value=0.0355 using drusen height as the covariate; and (β̂0, β̂1) = (−18.896,−0.018), σ̂ (β̂) = 0.087, and two-sided p-value=0.4195 using drusen width as the covariate.
Appendix 3. Comparison of the inner retina (photoreceptor layer, or retinal pigment epithelium) area in age-related macular degeneration eyes versus the control Eys
Let xkij denote the inner retina (IR) (or photoreceptor layer [PRL], retinal pigment epithelium [RPE]) area for eye j(=1,…,mki) of subject i(=1,…,nk) from group k(= 1 for AMD, = 2 for control). Let denote the total number of eyes in group k and μ̂k = E(xkij) denote the mean IR area for eyes in group k that is estimated as .
Note that
where { } are independent 0-mean random variables. By the CLT, ¯k is approximately normal with mean μk and the variance that can be consistently estimated by
Hence, a 100(1−α) confidence interval for μk is given as x̄k±z1−α/2sk.
To compare the areas between these two groups, we test the hypotheis
H0 :μ1 = μ2,
vs.
H1 :μ1 ≠ μ2.
Similarly as in above, by the CLT, the null distribution of T = x̄1−x̄2 is approximated by the normal distribution with mean 0 and variance that can be consistently estimated by
where x̄ = (m1+m2)−1(m1x̄1+m2x̄2) denotes the pooled sample mean from the eyes of both groups. Hence, we reject H0 if |T/σ̂|> z1−α/2.
Appendix 4. Correlation among retinal pigment epithelium area, inner retina area, and photoreceptor layer area
The sample correlation coefficient ρ̂ obtained by ignoring the correlated data is a consistent estimator. As in the regular regression analysis with independent observations, testing on the correlation coefficient (H0 :ρ = 0) is identical to the testing on the slope of the linear regression line (H0 :β1 = 0) as described in Appendix 2.
Spectral domain optical coherence tomography imaging of the retina is useful to measure significant focal photoreceptor layer thinning over drusen and to record hyperreflective foci over and around drusen in subjects with age-related macular degeneration.
Footnotes
This article contains additional online-only material. The following should appear online-only: Appendix 1, Appendix 2, Appendix 3, and Appendix 4.
Financial Disclosure:
Stefanie G. Schuman, MD: none
Anjum F. Koreishi, BSE: none
Sina Farsiu, PhD: North Carolina Biotechnology Center (research support), Bioptigen
Inc. (research support)
Sin-ho Jung, PhD:None
Joseph A. Izatt, PhD: Bioptigen Inc (investor)
Publisher's Disclaimer: This is a PDF file of an unedited manuscript that has been accepted for publication. As a service to our customers we are providing this early version of the manuscript. The manuscript will undergo copyediting, typesetting, and review of the resulting proof before it is published in its final citable form. Please note that during the production process errors may be discovered which could affect the content, and all legal disclaimers that apply to the journal pertain.
References
- 1.Klein R, Klein BE, Jensen SC, Meuer SM. The five-year incidence and progression of age-related maculopathy: the Beaver Dam Eye Study. Ophthalmology. 1997;104:7–21. doi: 10.1016/s0161-6420(97)30368-6. [DOI] [PubMed] [Google Scholar]
- 2.Mitchell P, Smith W, Attebo K, Wang JJ. Prevalence of age-related maculopathy in Australia: the Blue Mountains Eye Study. Ophthalmology. 1995;102:1450–60. doi: 10.1016/s0161-6420(95)30846-9. [DOI] [PubMed] [Google Scholar]
- 3.Rohrer B, Guo Y, Kunchithapautham K, Gilkeson GS. Eliminating complement factor D reduces photoreceptor susceptibility to light-induced damage. Invest Ophthalmol Vis Sci. 2007;48:5282–9. doi: 10.1167/iovs.07-0282. [DOI] [PubMed] [Google Scholar]
- 4.Wong RW, Richa DC, Hahn P, et al. Iron toxicity as a potential factor in AMD. Retina. 2007;27:997–1003. doi: 10.1097/IAE.0b013e318074c290. [DOI] [PubMed] [Google Scholar]
- 5.Pauleikhoff D, Barondes MJ, Minassian D, et al. Drusen as risk factors in age-related macular disease. Am J Ophthalmol. 1990;109:38–43. doi: 10.1016/s0002-9394(14)75576-x. [DOI] [PubMed] [Google Scholar]
- 6.Bressler SB, Maguire MG, Bressler NM, Fine SL Macular Photocoagulation Study Group. Relationship of drusen and abnormalities of the retinal pigment epithelium to the prognosis of neovascular macular degeneration. Arch Ophthalmol. 1990;108:1442–7. doi: 10.1001/archopht.1990.01070120090035. [DOI] [PubMed] [Google Scholar]
- 7.Francis PJ, Schultz DW, Hamon S, et al. Haplotypes in the complement factor H (CFH) gene: associations with drusen and advanced age-related macular degeneration. [Accessed September 9, 2008];PLoS ONE [serial online] 2007 2:e1197. doi: 10.1371/journal.pone.0001197. Available at: http://www.plosone.org/article/info:doi/10.1371/journal.pone.0001197. [DOI] [PMC free article] [PubMed]
- 8.Curcio CA, Medeiros NE, Millican CL. Photoreceptor loss in age-related macular degeneration. Invest Ophthalmol Vis Sci. 1996;37:1236–49. [PubMed] [Google Scholar]
- 9.Johnson PT, Brown MN, Pulliam BC, et al. Synaptic pathology, altered gene expression, and degeneration in photoreceptors impacted by drusen. Invest Ophthalmol Vis Sci. 2005;46:4788–95. doi: 10.1167/iovs.05-0767. [DOI] [PubMed] [Google Scholar]
- 10.Johnson PT, Lewis GP, Talaga KC, et al. Drusen-associated degeneration in the retina. Invest Ophthalmol Vis Sci. 2003;44:4481–8. doi: 10.1167/iovs.03-0436. [DOI] [PubMed] [Google Scholar]
- 11.Spaide RF, Ho-Spaide WC, Browne RW, Armstrong D. Characterization of peroxidized lipids in Bruch’s membrane. Retina. 1999;19:141–7. doi: 10.1097/00006982-199902000-00010. [DOI] [PubMed] [Google Scholar]
- 12.Kopitz J, Holz FG, Kaemmerer E, Schutt F. Lipids and lipid peroxidation products in the pathogenesis of age-related macular degeneration. Biochimie. 2004;86:825–31. doi: 10.1016/j.biochi.2004.09.029. [DOI] [PubMed] [Google Scholar]
- 13.Holz FG, Pauleikhoff D, Klein R, Bird AC. Pathogenesis of lesions in late age-related macular disease. Am J Ophthalmol. 2004;137:504–10. doi: 10.1016/j.ajo.2003.11.026. [DOI] [PubMed] [Google Scholar]
- 14.Pauleikhoff D, Harper CA, Marshall J, Bird AC. Aging changes in Bruch’s membrane: a histochemical and morphologic study. Ophthalmology. 1990;97:171–8. [PubMed] [Google Scholar]
- 15.Age-Related Eye Disease Study Research Group. A randomized, placebo-controlled, clinical trial of high-dose supplementation with vitamins C and E, beta carotene, and zinc for age-related macular degeneration and vision loss: AREDS report no. 8. Arch Ophthalmol. 2001;119:1417–36. doi: 10.1001/archopht.119.10.1417. [DOI] [PMC free article] [PubMed] [Google Scholar]
- 16.Ross RJ, Verma V, Rosenberg KI, et al. Genetic markers and biomarkers for age-related macular degeneration. Expert Rev Ophthalmol. 2007;2:443–57. doi: 10.1586/17469899.2.3.443. [DOI] [PMC free article] [PubMed] [Google Scholar]
- 17.Age-Related Eye Disease Study Research Group. The Age-Related Eye Disease Study system for classifying age-related macular degeneration from stereoscopic color fundus photographs: the Age-Related Eye Disease Study report number 6. Am J Ophthalmol. 2001;132:668–81. doi: 10.1016/s0002-9394(01)01218-1. [DOI] [PubMed] [Google Scholar]
- 18.Kampmeier J, Zorn MM, Lang GK, et al. Comparison of preferential hyperacuity perimeter (PHP) test and Amsler grid test in the diagnosis of different stages of age-related macular degeneration [in German] Klin Monatsbl Augenheilkd. 2006;223:752–6. doi: 10.1055/s-2006-926880. [DOI] [PubMed] [Google Scholar]
- 19.Loewenstein A. The significance of early detection of age-related macular: Richard & Hinda Rosenthal Foundation Lecture, The Macula Society 29th Annual Meeting. Retina. 2007;27:873–8. doi: 10.1097/IAE.0b013e318050d2ec. [DOI] [PubMed] [Google Scholar]
- 20.Bressler NM, Silva JC, Bressler SB, et al. Clinicopathologic correlation of drusen and retinal pigment epithelial abnormalities in age-related macular degeneration. Retina. 1994;14:130–42. [PubMed] [Google Scholar]
- 21.Green WR. Histopathology of age-related macular degeneration. [Accessed September 9, 2008];Mol Vis [serial online] 1999 5:27. Available at: http://www.molvis.org/molvis/v5/a27/ [PubMed]
- 22.Chen TC, Cense B, Pierce MC, et al. Spectral domain optical coherence tomography: ultra-high speed, ultra-high resolution ophthalmic imaging. Arch Ophthalmol. 2005;123:1715–20. doi: 10.1001/archopht.123.12.1715. [DOI] [PubMed] [Google Scholar]
- 23.Khanifar AA, Koreishi AF, Izatt JA, Toth CA. Drusen ultrastructure imaging with spectral domain optical coherence tomography in age-related macular degeneration. Ophthalmology. doi: 10.1016/j.ophtha.2008.04.041. In press. [DOI] [PMC free article] [PubMed] [Google Scholar]
- 24.American National Standard for the Safe use of Lasers. ANSI Z136.1–2000. Orlando, FL: Laser Institute of America; 2000. [Google Scholar]
- 25.Thevenaz P, Ruttimann UE, Unser M. A pyramid approach to subpixel registration based on intensity. IEEE Trans Image Process. 1998;7:27–41. doi: 10.1109/83.650848. [DOI] [PubMed] [Google Scholar]
- 26.Liang KY, Zeger SL. Longitudinal data analysis using generalized linear models. Biometrika. 1986;73:13–22. [Google Scholar]
- 27.Medeiros NE, Curcio CA. Preservation of ganglion cell layer neurons in age-related macular degeneration. Invest Ophthalmol Vis Sci. 2001;42:795–803. [PubMed] [Google Scholar]
- 28.Buch H, Vinding T, la Cour M, et al. Risk factors for age-related maculopathy in a 14-year follow-up study: the Copenhagen City Eye Study. Acta Ophthalmol Scand. 2005;83:409–18. doi: 10.1111/j.1600-0420.2005.00492.x. [DOI] [PubMed] [Google Scholar]
- 29.Klein R, Klein BE, Knudtson MD, et al. Fifteen-year cumulative incidence of age-related macular degeneration: the Beaver Dam Eye Study. Ophthalmology. 2007;114:253–62. doi: 10.1016/j.ophtha.2006.10.040. [DOI] [PubMed] [Google Scholar]
- 30.van Leeuwen R, Klaver CC, Vingerling JR, et al. The risk and natural course of age-related maculopathy: follow-up at 6 1/2 years in the Rotterdam Study. Arch Ophthalmol. 2003;121:519–26. doi: 10.1001/archopht.121.4.519. [DOI] [PubMed] [Google Scholar]
- 31.Coleman H, Chew E. Nutritional supplementation in age-related macular degeneration. Curr Opin Ophthalmol. 2007;18:220–3. doi: 10.1097/ICU.0b013e32814a586b. [DOI] [PubMed] [Google Scholar]
- 32.Caicedo A, Espinosa-Heidmann DG, Hamasaki D, et al. Photoreceptor synapses degenerate early in experimental choroidal neovascularization. J Comp Neurol. 2005;483:263–77. doi: 10.1002/cne.20413. [DOI] [PubMed] [Google Scholar]
- 33.Zarbin MA. Current concepts in the pathogenesis of age-related macular degeneration. Arch Ophthalmol. 2004;122:598–614. doi: 10.1001/archopht.122.4.598. [DOI] [PubMed] [Google Scholar]