

Abstract
The aims of the present study were to describe the ontogeny of spatial relationships between placental components in baboons and to investigate alterations in these indices following 1) moderate maternal nutrient restriction and 2) administration of glucocorticoids to pregnant baboons. We investigated the effects of glucocorticoids since they have been shown to play a role in the altered fetal growth that accompanies maternal nutrient restriction. Glucocorticoids are also given to pregnant women who threaten premature labor to accelerate fetal lung maturation. A third aim was to compare our findings to those in similar conditions in human pregnancy.
Volumetric placental development in the baboon was similar to that in the human, though growth of fetal capillaries was slower over the second half of gestation in baboon than in human placentas. Intervillous space (IVS) and villous star volumes were halved at the end of gestation compared to the middle of gestation, as described in the human placenta.
When mothers were fed 70% of feed eaten by controls fed ad libitum, placental volumetric structure was unchanged at mid-gestation but was altered by the end of gestation when placental weight, but not fetal weight or length, was decreased. At the end of gestation villous volume and surface area, capillary surface area, and the villous isomorphic coefficient were all decreased, In contrast, IVS hydraulic diameter was increased. All parameters were similar in pregnancies with male and female fetuses, with the exception of fetal capillary volume, which was unchanged in pooled samples and those from male fetuses, but decreased in pregnancies with female fetuses
Glucocorticoid administration during the second half of gestation did not produce any changes in the measured indices of placental composition.
In summary, these changes in placental structure, associated with maternal nutrient restriction, would all act to decrease placental transport of nutrients. The influence of MNR on villous capillarization depends on fetal gender.
INTRODUCTION
Differential growth of the constituents of the placenta is important both in normal placental growth and in the adaptations that may occur under sub-optimal conditions to enable successful integration between fetal demand and placental supply [1]. Poor nutrient delivery has many adverse effects on the fetus and may result in intrauterine growth restriction (IUGR). Malnutrition is a real problem in the developing world. In areas such as Southeast Asia, as many as 80% of women may become anemic during the course of pregnancy [2]. Poor maternal nutrition also exists in low socio-economic conditions in developed countries [3]. Additionally, eating disorders, severe vomiting and nausea, or adolescent pregnancy often result in poor maternal nutritional status in pregnancy [4].
The mechanisms by which maternal nutrition influences fetal nutrition are complex and include changes in placental structure and function [5]. Normal development of the placenta is essential for fetal well-being, adequate fetal growth, and a good pregnancy outcome. Changes in the placenta itself may represent either beneficial adaptive responses or pathological changes in response to inadequate nutrient supply [6]. Impaired placental development is associated with higher offspring blood pressure and other chronic conditions in adulthood [7].
Placentation and placental structure are very similar in baboons (Papio sp.) and humans [8]. Despite some differences, such as superficial trophoblast invasion [8] and a smaller progesterone increase during pregnancy [9], the baboon model has been extensively used as an animal model for placental hormonal and morphological studies [9–10]. However, volumetric and morphometric data on normal and abnormal baboon placental growth are lacking. A stereological approach has been used only in one study, which characterized cytotrophoblast, syncytiotrophoblast, and placental volume development during baboon pregnancy from 60–165 days gestation [10].
The intervillous space of the human placenta through which the maternal blood circulates has been likened to a “porous medium” [11]. On a theoretical basis it can be compared to a set of cylinders with a vascular architecture unique to that of other vascular beds, but in reality the complex three dimensional configuration of the villous tree means that the ‘cylinders’ comprise a series of interconnecting sinuses of varying dimensions. The specialized spatiotemporal relationship between the placental villi (V) and the intervillous space (IVS) is central to efficient placental blood flow and diffusive conductance. The ontogeny of volumetric placental development has been well studied in humans and demonstrates significant changes around 20 weeks of gestation (0.5 gestation-G). This is the time of the switch to non-branching angiogenesis in new developing villi and capillary regression in pre-existing villi [12] and a switch of the villous branching pattern [13]. Associated with these changes there is a dramatic increase in overall placental volume and a sharp decline in the star volume of both villi and the IVS as terminal villi are elaborated [14]. We conducted our studies at 0.5 gestation and at the end of gestation to enable evaluation of equivalent changes in the baboon placenta.
The pathophysiology of the maternal-placental-fetal interaction in undernutrition is poorly understood, and the data relating changes in placental composition and three dimensional structure to maternal undernutrition are inconsistent and controversial [15–16]. Human data inevitably have limitations in the control of maternal prepregnancy status, uniform levels of nutrient restriction, access to fresh tissue obtained at key stages of development from pregnancies uncomplicated by other pathologies, and the need for rapid and optimal tissue processing. Detailed placental structural studies have been conducted in animal models of undernutrition such as sheep and guinea pigs [16–17]. However, there is no information available in nonhuman primates challenged with a defined degree of nutrient restriction.
The aims of the present study were three-fold. First, we describe the normal ontogenetic changes in key measures such as surface area, absolute and star volumes and derive from them indices of placental villous tree and IVS development (volume and surface area weigh star volume (pore number, isomorphic coefficient and hydraulic diameter). Villous and IVS star volumes and their derivates are the important indices of placental functional morphology, depending not only on total villous and IVS volume, but on the degree of villous branching, and fetal and maternal physiological parameters (e.g. blood pressure, oxygenation, glucose level) [14]. Second, we sought to investigate how these indices are changed by moderate maternal nutrient restriction or glucocorticoid administration during pregnancy. Third, we compare our findings to those in similar conditions in human pregnancy.
We hypothesized that in the presence of the moderate degree of decreased nutrient availability imposed, the baboon placenta would demonstrate compensatory changes to enhance placental nutrient transfer to the fetus. Since many of the changes in fetal cardiovascular and neural development have been shown to be due to exposure of the fetus and placenta to levels of glucocorticoids that are inappropriate for the specific stage of development [18], we further hypothesized that exposure to glucocorticoids at the time of development and in the weight adjusted doses that they are given to pregnant women who threaten premature labor would produce changes similar to those observed in response to maternal nutrient restriction. We also hypothesized, that ontogenic changes and responses to maternal nutrient restriction or glucocorticoid administration of placental functional morphology in baboons will be essentially the same as described for humans.
METHODS
Animal care and maintenance
All procedures were approved by the Southwest Foundation for Biomedical Research (SFBR) Institutional Animal Care and Use Committee and conducted in AAALAC-approved facilities. The feeding system to control animal diet and details of housing and environmental enrichment have been published elsewhere [19–21]. Animals (Papio sp.) were fed Purina Monkey Diet 5038 (Purina, St. Louis, MO).
Study design
Placentas from two experimental protocols were evaluated in this study: maternal nutrient restriction (MNR) and glucocorticoid exposure during pregnancy. The mothers were carefully selected to produce age and weight matched groups in the non-pregnant state as indicated in previous publications (19, 21).
Nutrient restriction study
The subjects of this study were 27 female baboons aged 8 to 15 years. Maternal data are presented in Table 1. Baboons were observed twice a day for well-being and three times a week for turgescence (sex skin swelling) and signs of vaginal bleeding to enable timing of pregnancy [20]. Pregnancy was dated initially by observing the changes in the swelling of the sex skin and confirmed at 30 days of gestation by ultrasonography. Following pregnancy confirmation, diet was closely monitored in eight animals fed ad libitum (control group) and their food intake calculated weekly on a per kilogram basis. Six pregnant baboons in MNR group received 70% of the average daily amount of feed eaten (on a weight-adjusted basis) by control (CTR) animals at the same gestational age. Cesarean sections were performed at 90 days gestation. A further seven control animals and six MNR baboons underwent cesarean section at 165 days gestation.
Table 1.
Data from control (CTR), maternal nutrient-restricted (MNR), and glucocorticoid-treated (GC) baboons
| 90 days gestational age | 165 days gestational age | 175 days gestational age | ||||
|---|---|---|---|---|---|---|
| CTR (n=8) | MNR (n=6) | CTR (n=7) | MNR (n=6) | CTR (n=12) | GC (n=13) | |
| Maternal age (years) | 9.4 ± 0.62 | 11.3 ± 1.25 | 9.8 ± 0.91 | 12.0 ± 0.51 | 10.8 ± 0.84 | 10.10 ± 0.75 |
| Maternal weight (kg) | 13.7 ± 0.41 | 12.2 ± 0.34* | 16.6 ± 0.69a | 14.1 ± 0.77* | 14.8 ± 0.55b | 15.08 ± 0.50 |
| Fetal weight (kg) | 0.1 ± 0.00 | 0.1± 0.00 | 0.7 ± 0.03a | 0.7±0.03 | 0.9 ± 0.32ab | 0.81 ± 0.23 |
| Placenta weight (g) | 70.4 ± 3.37 | 62.9 ± 1.48 | 177.3 ± 7.89a | 145.0 ± 7.23* | 191.4 ± 8.02a | 183.63 ± 6.05 |
| Fetal/placenta weight | 1.47 ± 0.07 | 1.52 ± 0.06 | 4.23 ± 0.18a | 4.66 ± 0.31 | 4.53 ± 0.20a | 4.48 ± 0.17 |
| Placenta max diameter (cm) | 7.7 ± 0.36 | 7.3 ± 0.31 | 12.4 ± 0.60a | 11.3 ± 0.93 | 13.0 ± 0.35a | 13.23 ± 0.36 |
| Placenta min diameter (cm) | 8.1 ± 0.26 | 7.2 ± 0.42 | 10.9 ± 0.49a | 10.3 ± 0.40 | 12.3 ± 0.33ab | 12.46 ± 0.46 |
| Umbilical cord length (cm) | 14.1 ± 0.80 | 11.8 ± 0.90 | 18.1 ± 0.96a | 17.3 ± 1.82 | 22.9 ± 1.43ab | 21.04 ± 1.35 |
| Number of female fetuses | 5 | 3 | 4 | 3 | 5 | 7 |
| Number of male fetuses | 3 | 3 | 3 | 3 | 7 | 6 |
Values are mean ± SEM;
p<0.05 compared to control animals at the same gestational age, p< 0.05
compared to CTR 90d,
compared to CTR 165d.
Glucocorticoid administration study
The study design has been described previously [19]. Briefly, 25 female baboons were randomly selected at the time of confirmation of pregnancy. Baboons received either vehicle (control group; n = 12) or betamethasone phosphate (Celestan®, Essex Pharma, Germany) (betamethasone group; n = 13) in daily intramuscular doses of 175 μg. kg−1 maternal body weight once a day at 0800 h at 111, 112, 118, 119, 125, and 126 days of gestation. Cesarean sections were performed at 175 ± 5 (mean ± range) days gestation age (0.97 gestation).
Cesarean section
Baboons were premedicated with ketamine (10 mg. Kg−1 i. m.). After intubation, isoflurane (2%, 2 l/min) was used to maintain a surgical plane of anesthesia throughout surgery and fetal blood sampling. Conventional cesarean-section and necropsies, fetal morphometry, tissue harvest, and processing were performed as described in detail previously [20–21].
Placental stereology
Placental sampling
At cesarean section the umbilical cord was tied in two places close to the placenta and sectioned between the ties. The placenta was removed manually followed by intravenous administration of 10 IU oxytocin. The placenta was trimmed of fetal membranes and umbilical cord and weighed. Placental volume was calculated by dividing placental weight by specific gravity (1.03 kg/m3) [22]. Five to seven samples, approximately 1 cm × 1 cm × 0.1–0.5 cm, extending from the chorionic to the basal plate were taken in a systematic, random manner using a transparent sheet with quadratic patterns (grid system) described by Burton and Jauniaux [23]. To ensure randomness of tissue orientation the samples were processed as described by Mayhew [14]. Briefly each sample was then cut to produce a cube, fixed in formalin (10% buffered formalin), and embedded in paraffin in a random direction. Sections 5-μm were cut from each block, and two were chosen at random and processed for hematoxylin and eosin staining.
Stereological evaluation
The Computer Assisted Stereology Toolbox (CAST) 2.0 system from Olympus (Ballerup, Denmark) was used to perform all microscopical measurements.
Absolute volumes of peripheral villi and fetal capillaries
Each field of view was found systematically and randomly using the CAST meander sampling facility covering the entirety of the section. In each field of view, point counting of villi, placental tissue, and blood vessels at 40× allowed estimates of compartment volumes to be calculated. Counts were summed over all fields per placenta and then ratios of villous point counts over total placental point counts, and blood vessel point counts over total placental point counts, were calculated for each placenta. These ratios were multiplied by the placental volume to obtain each specific total volumes, i.e., villous volume and fetal capillary volume. Following the quantification of structures in each field of view, a picture was taken to document the marked field of view and observed structures.
Estimation of surface area of peripheral villi and fetal capillaries
Surface densities were estimated by superimposing a series of test lines in a random orientation on the histological images and counting intersects with the structures of interest. The following formula was used to find surface area:
where Σ(I) is the summation of the number of intersections made by the lines with respect to the particular structure under study for all fields per placenta, l(p) is the length of the segment, and Σ(p) is the summation of the number of points that land on the particular structure being measured per placenta.
Star volume (villous and IVS)
Star volume was calculated as described elsewhere [24–25]. Briefly, samples points were randomly chosen and from each point five straight lines radiated in systematic, random directions (Fig. 1E & F). When a test point fell in the IVS, the length of intercepts that radiated unobstructed through this point to the surrounding villi tissue was measured [26]. The same principle was applied for villous star volume estimation. The average number of intercepts per placenta was 197 for villi and 56 for the IVS. Star volume was then estimated using the formula: V (star) = π/3×L̄3, where L3 is the mean of the cubed intercept lengths automatically corrected for the magnification by the software and then corrected for the effect of tissue processing (shrinkage).
Fig 1.
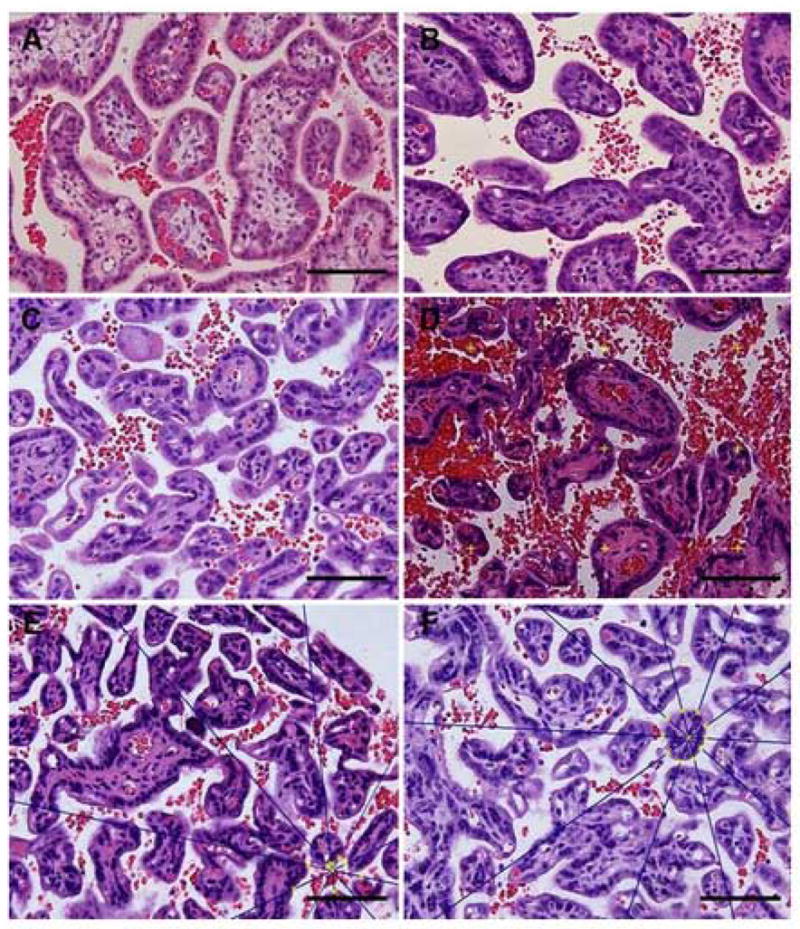
shows representative micrographs of placentas from control (1A & 1C) and nutrient restricted placentas (1B & 1D) at 90 and 165 days gestation respectively. Methods for calculating star volume for IVS (1E) and villi (1F) are shown. Bar=100 micrometer.
Estimations of number and pore hydraulic dimensions
The number of star volume units per placenta was calculated from the absolute volume and star volume as follows: Absolute volume/star volume. This formula was applied for IVS, representing theoretical number of intervillous pores [24]. The hydraulic (or cross-sectional) diameter (HD) of IVS pores was estimated as described elsewhere [24]: HD=4V/S, where V is the absolute volume of IVS and S is the total villous surface area. This formula assumes the intervillous pores are a homogenous set of right circular cylinders, which is only an approximation to the situation in vivo.
Calculation of villous isomorphic coefficient
The isomorphic coefficient, an indirect index of villous shape, was calculated as previously described [27] by the formula: S3/2/V, where S is the villous surface area and V is the total villous volume.
Shrinkage factor
The shrinkage factor was estimated as described by Mayhew and Burton [28] and Burton and Palmer [29]. Briefly, the diameter of 300 maternal erythrocytes located within the intervillous space was measured at 40× and compared to the fresh erythrocyte diameter (in a native smear). Assuming that tissue shrinkage is uniform, concentric, and consistent over time [25], the linear shrinkage rate was 29.7%.
Statistical analysis
Data throughout are presented as mean ± SEM. Allometric evaluation was performed as described by Mayhew [1]. All variables estimated for each placenta and corresponding placental volume (cm3) were subjected to log transformation followed by linear regression analysis. The allometric relationships were statistically assessed by comparing the calculated allometric exponent (parameter B) to 1 using a one sample t-test. Comparisons between treatment groups, either control and MNR or control and glucocorticoid, were assessed using Student’s t-tests. Comparisons between age groups were evaluated using ANOVA and Student-Newman-Keul’s test.
RESULTS
Placental ontogenic changes during normal primate pregnancy
Placental maximal diameter increased between 0.5 and 0.92 gestation, but was unchanged between 0.92 and 0.97 gestation. Fetal weight, placental weight, minimal placental diameter, and umbilical cord length rose progressively through normal gestation (0.5, 0.92 and 0.97 gestation; p < 0.05) (Table 1).
Figure 1 shows representative micrographs of placentas from CTR (1A & 1C) and MNR placentas (1B & 1D) at 90 and 165 days gestation respectively. Methods for calculating star volume for IVS (1E) and villi (1F) are shown.
Placental volumetric components (villi and capillaries) increased from 0.5 to 0.92 gestation, but did not change between 0.92 and 0.97 gestation (Fig. 2A), despite continuing fetal growth (Table 1). Measurements for villous and capillary surface areas followed the same pattern (Fig. 2B). Placental and fetal weight rose exponentially in the second trimester (Table 1). The IVS and villous star volume were higher in the middle of gestation than at the end of gestation. The number of IVS pores increased over the same time period (p<0.05). The ratio of absolute villous volume/villous star volume and the villous isomorphic coefficient were higher at the end than at the middle of gestation consistent with the elaboration of terminal villi (p<0.05) (Table 2).
Fig 2.

Volume (A) and surface area (B) of villi (V) and fetal capillaries (FC) from control animals at three gestational ages from three studies: 90 days gestation (white, n=8), 165 days gestation (gray, n=7), and 175 days gestation (black, n=12). *p<0.05 compared to 90 days gestation + p<0.05 compared to 165 days gestation.
Table 2.
Volume and surface area in villi and fetal capillaries, intravillous space (IVS) star volume, pore number, hydraulic diameter, villous star volume, ratio villous volume to villous star volume, and villous isomorphic coefficient from placentas of control (CTR) and placentas of maternal nutrient restriction animals at 90 (A) and 165 days (B) of gestation (dGA)
| A | CTR 90 dGA | MNR 90 dGA |
|---|---|---|
| Villous volume (cm3) | 45.3 ± 3.97 | 37.9 ± 1.79 |
| Capillary volume (cm3) | 10.1 ± 2.22 | 6.4 ± 1.19 |
| Villous surface area (m2) | 3.9 ± 0.35 | 3.5 ± 0.25 |
| Capillary surface area (m2) | 6.7 ± 0.64 | 5.7 ± 0.53 |
|
| ||
| IVS Star volume (μm3 × 106) | †13.5 ± 1.36 | 13.6 ± 4.04 |
| Pore number (× 106) | †1.9 ± 0.30 | 2.6 ± 0.74 |
| Hydraulic diameter (μm) | 24.4 ± 1.88 | 28.0 ± 3.96 |
| Villous star volume (μm3 × 106) | †0.09 ± 0.008 | 0.18 ± 0.06 |
|
| ||
| Villous volume/villous star volume(×106) | †559.3 ± 101.63 | 331.1 ± 72.16 |
| Villous Isomorphic coefficient (× 106) | †0.2 ± 0.01 | 0.17 ± 0.01 |
|
| ||
| B | CTR 165 dGA | MNR 165 dGA |
|
| ||
| Villous volume (cm3) | 116.9 ± 5.24 | 88.6 ± 5.20* |
| Capillary volume (cm3) | 28.1 ± 3.29 | 20.8 ± 3.18 |
| Villous surface area (m2) | 14.1 ± 0.82 | 10.00 ± 0.67* |
| Capillary surface area (m2) | 24.9 ± 1.34 | 17.7 ± 1.15* |
|
| ||
| IVS Star volume (μm3 × 106) | 6.4 ± 1.97 | 7.3 ± 1.56 |
| Pore number (× 106) | 15.6 ± 4.29 | 9.3 ± 2.22 |
| Hydraulic diameter (μm) | 15.9 ± 1.24 | 21.1 ± 1.20* |
|
| ||
| Villous star volume (μm3 × 106) | 0.7 ± 0.04 | 0.6 ± 0.06 |
| Villous volume/villous star volume(×106) | 171.9 ± 19.22 | 160.1 ± 15.85 |
| Villous Isomorphic coefficient (× 106) | 0.5 ± 0.02 | 0.4 ± 0.03* |
p<0.05 compared to the control at the same gestational age, t-test, (mean ± SEM).
p<0.05 compared to the control at 165 days of gestation (ANOVA).
Table 3a shows the allometric relationship between villous, fetal capillary, and placental growth during pregnancy. The exponents for peripheral villous volume and capillary volume did not differ from B=1 and were essentially the same. Exponents for villous and capillary surface area were more than 1 (p<0.01). For placental, villous, and capillary volume, allometric exponents were significantly less than 1 (p < 0.01) (Table 3b).
Table 2.
a, Allometric growth relationship between villi, capillaries, and placental volume during gestation. b, Allometric growth relationship between placental volume, villi, capillaries and fetal weight during gestation. Values represent allometric exponents (B), constants (A) calculated using a linear regression equation [1]
| Exponent B (SEM) | Constant A | p-value: (B is not 1) | |
|---|---|---|---|
| a. Villous tree and capillaries growth in relationship to placental volume | |||
| Villious tree volume | 0.9475 (0.0525) | 0.8114 | NS |
| Capillary volume | 1.0672 (0.1675) | 0.0907 | NS |
| Surface area villi | 1.02082 (0.0727) | 0.0233 | 0.008 |
| Surface area capillaries | 1.2732 (0.0539) | 0.0308 | < 0.0005 |
| b. Placental, villous tree and capillaries growth in relationship to fetal growth | |||
| Placental volume | 0.4743 (0.0276) | 7.4993 | < 0.0005 |
| Villious tree volume | 0.4388 (0.0416) | 5.8391 | < 0.0005 |
| Capillary volume | 0.4561 (0.0982) | 1.0558 | < 0.0005 |
| Surface area of villi | 0.5667 (0.0518) | 0.2758 | < 0.0005 |
| Surface area of capillaries | 0.6086 (0.0413) | 0.3897 | < 0.0005 |
Placental changes following maternal nutrient restriction
MNR did not produce any changes at 0.5 gestation in overall placental weight (Table 1), villous and capillary volumes and surface areas (Table 2A).
At 0.92 gestation, the weight of MNR placentas was lower than control placentas (p<0.05, Table 1). The villous, but not capillary, volume was decreased in placentas from the MNR group at this gestational age (Table 2B) when pooled data from pregnancies with male and female fetuses was analyzed. Capillary volume in placentas of female, but not male fetuses, was lower in MNR compared to CTR animals (13.78 ± 1.12 vs. 26.32 ± 5.29 cm 3). The surface area of both villi and capillaries was significantly lower in the MNR group (Table 2B).
There were no differences in villous and IVS star volumes and ratios (absolute volume/star volumes) between control and MNR animals at both gestational ages (Tables 2A and 2B). The hydraulic diameter of intervillous space was higher and villous isomorphic coefficient was lower at 0.92 gestation in MNR than control placentas (Table 2B). These structural changes in the placenta are clearly seen in the histological appearance of the placentas from control and nutrient restricted mothers (Fig. 1).
Placental changes following glucocorticoid exposure
There were no differences in volumetric composition at 0.97 G between the placentas of baboons treated with glucocorticoid compared to baboons receiving vehicle; villous volume was 109.9 ± 8.51cm3 in control and 109.4 ± 4.24 cm3 in the glucocorticoid group, capillary volume was 22.7 ± 3.78 cm3 in the control vs. 24.6 ± 1.43 cm3 in the glucocorticoid group. Surface area of villi and capillaries in control placentas (11.9 ± 1.05 m2 and 22.5 ± 1.36 m2, respectively) was similar to values in glucocorticoid treated animals (12.9 ± 0.56m2 and 22.9 ± 1.27m2, respectively).
DISCUSSION
Placental ontogeny
Placental and fetal weight and volumetric placental composition
The ontogeny of human placental development has been described in detail [14]. Placental volume and the volumes of the villous tree and fetal capillaries increased significantly over the second half of gestation in the baboon similar to the changes reported in the human placenta. The volume of peripheral villi at the middle of gestation was similar to the human (48.2 vs. 37.2 cm3, respectively), but at the end of gestation was only half the human peripheral villous volume (109.9 ± 8.5 cm3 vs. 226 cm3) [30]. The relationship was similar for placental volume, which reach half of human placental volume at term. Increasing volumes and surface areas of villi and capillaries are adaptive mechanisms that increase placental diffusive conductance and match the gain in fetal weight [30]. Despite continued fetal growth, the villous volume was unchanged between 0.92 and 0.97 gestation. Term in the baboon is considered as a window of 175 ± 11 (range) days which includes 165 and 175 days of gestation [31]. During this time placental villi are apparently not being elaborated, but remodeling of the villi present, with a reduction of barrier thickness, could still lead to an increase in their diffusing capacity. Further studies are required to clarify this point.
Capillaries grew at a similar rate to the villous tree in contrast to human placentas, where capillaries grow faster than villi [1]. The exponent B for villous volume growth was similar to the human but capillary growth was lower in the baboon placenta. As in human placentas, surface areas for both villi and capillaries increased faster than volume, and growth of placental components was slower than fetal growth.
Star volumes (IVS and villi) and its derivates
The IVS of the human placenta is formed of a complex network of interconnecting passages through which the maternal blood circulates. The star volume is the only measurement available to quantify irregular spaces or structures, such as villous branches. The IVS star volume describes the space through which nutrient molecules travel to enrich the trophoblast [14] and is determined by both the total intervillous space volume and spatial disposition of the villous tree. Mid-gestation is the period of greatest structural remodeling [13,25,32]. We found that IVS star volume halved between 0.5 and 0.92 gestation in our primate model, paralleling human observations [25]. The absolute measurement of IVS star volume in baboons was higher than values published for a European population [25], but less than those reported for a Bolivian population [34]. The IVS pore number and hydraulic diameter in the baboon placenta (15.6 ± 4.3 × 10⁶ and 15.9 ± 1.24 μm, respectively) were less than published values for a human European population (66 ± 15 × 106 and 80 ± 5.7 μm, respectively) [25]. While the total volume of the IVS influences fetal nutrient supply, the blood flow through the IVS is described as blood flow through the porous medium, which is different from the flow through a tube system [35]. Therefore, increasing the number of pores by 8-fold during the second half of gestation as observed in our study (and in human pregnancies) is viewed as an adaptative mechanism that influences maternal blood flow: a more porous bed conducts flow more readily [11]. During the same gestational period the hydraulic diameter decreased by 1.53 in our study. A decrease in hydraulic diameter was also observed in human placentas during gestation [25].
Villous star volume at 0.5 gestation was comparable to published human data (1.43 ± 0.09 × 106 μm3 vs. 1.88 × 106 μm3 (coefficient of variation=0.55), respectively) and decreased by the end of gestation as seen in the human placenta [25] as a result of an increase in the total number of terminal villi during second half of gestation [36].
Alterations in placental structure resulting from maternal nutrient restriction and glucocorticoid exposure
Table 4 summarizes published data from studies of human populations affected by maternal undernutrition as indicated by socio-economic status, signs of maternal anemia, low maternal weight, or restricted food availability. With one exception, authors noticed decreased peripheral villous surface area in placentas from anemic and undernourished women. Since this decreases the exchange area a decreased villous surface area is more likely to be a pathophysiological response than a compensation for the anemia. Villous capillarization data are conflicting: both increased and reduced capillarization have been reported. As Reshetnikova et al. [37] observed in women, we observed decreased capillary surface area, but not volume, in baboon placentas from nutrient restricted mothers at the end of gestation. Placental weight is reduced in ewes fed 50–60% of their energy requirements [38]. The reduction is mostly due to reduction of the fetal component of placenta. In our study the volumetric composition of placenta was not diminished by MNR at the middle of gestation. At the end of gestation in pregnancies with the male fetuses, villous volume, but not capillary volume, was decreased; however, the surface area of the capillaries was decreased at the end of gestation in all undernourished mothers. The enhanced capillary volume with a reduction in capillary surface area is likely due to increase in mean capillary diameter, or could indicate a reduction in capillary coiling and branching. A similar reduction has been observed in severe human IUGR, along with fewer cytotrophoblast cells within terminal villi [39–40]. Further work involving corrosion casting of the vascular network is required to distinguish between these possibilities. In our study we did not observe IUGR with 30% nutrient reduction, as documented by fetal length and weight. However, the increased IVS hydraulic diameter in MNR placentas might be an adaptation that promotes placental conductance in conditions of inadequate maternal nutrient supply and also produces adaptation hyperoxia. However, nutrient exchange may not be increased by a larger flow rate within the system if diffusion distance is increased. The pore numbers of IVS increased only 3-fold in MNR pregnancies compared to the 8-fold increase in control population at the end of gestation in our study, pointing to decreased conductance of IVS as a result of MNR.
Table 3.
Changes in placental morphology in the human and animal placenta related to maternal nutritional state
| Species | Population studied/experimental conditions | Placental weight/volume | Fetal weight | Villi | Capillaries | Pathology | Reference |
|---|---|---|---|---|---|---|---|
| Human | Undernourished population | NA | NA | NA | NA | Fewer cells of larger volume. Increased fat, protein, potassium, zinc, copper, hydroxyproline and decreased selenium concentrations | 43 |
| Human | Five country studies: severe anemia associated with malnutrition | Increased placental weight | Varying: low-high | NA | NA | NA | 2 |
| Human | Two urban populations: high and low-med maternal nutritional status | Decreased placental weight | Lower birthweight | Decreased peripheral villous mass and peripheral villous surface area, no differencies in stem villi | Decreased peripheral villous capillary surface area | Increased subchorionic fibrin component and infarction, lower proportion of connective tissue and syntitiotropho-blast, decreased number of syntitiotrophoblast knots | 3 |
| Human | Lower socio-economical class | Decreased placental weight | Higher percentage of low-birth weight babies and infant death | Reduction of surface area | NA | No changes in placental water, protein, DNA, ash and hemoglobin, lower level of hydroxyprone and fat | 33 |
| Human | Lower socio-economical class | Decreased placental weight, reduced placental weight and surface area | Decreased fetal weight | NA | NA | Ill-defined cotyledons, eccentric attachment to the cord, presence of hemorrhage | 44 |
| Human | Lower socio-economical class | Decreased placental weight | Decreased fetal weight | NA | NA | Increased villous and intervillous fibrinoid necrosis, decreased number of vascular-syntitial membranes, increased number of syntitiotrophoblast knots | 45 |
| Human | Malnutrition | Decreased placental weight | Higher level of stromal villi fibrosis | Reduced villi vascularity | Degenerative changes at peripheral placental regions (infarction, calcification, deposition of fibrinoid) | 46 | |
| Human | Iron-deficient anemia | Increased numbers of capillaries per villous cross section | Increased numbers of villous macrophages and of proliferating MIB-1-positive cells compared to control group | 47 | |||
| Human | Anemia/undernutrition | No differences | No differences | Reduction of surface area, volume of intermediate and terminal villi, stem villi | Reduction of surface area, no differences in volume | Reduction of trophoblast and stroma, unchanged intervilli space volume | 37 |
| Human | Prospective study in poor women regarding maternal pre-pregnancy weight and weight gain | Maternal pre-pregnancy weight is an important determinant of placental weight | Increased IVS and non-parenchimal volume components with increasing pre-pregnancy weight | No correlations with villi surface area | Maternal pre-pregnancy weight is an important determinant of placental vasculariation (direct correlation) | Volume of fibrin correlated positively with maternal pre-pregnancy weight | 48 |
| Human | Maternal anemia | Reduced villous surface area - alters disproportionately to volume | 27 | ||||
| Sheep | Undernutrition: sheep, twin pregnancies | No differences | reduced | NA | No alteration in placental vascular architecture as measured by Doppler systolic/diastolic ratio | NA | 49 |
| Sheep | Fed 50% of energy requirements in early and late gestation | Reduction in placental weight at 80 days, but an increase in placental weight at 145 days of gestation | No effect | NA | NA | Reduction of fetal component of placenta | 38 |
| Sheep | Fed 70% of protein requirements and 70% global food consumption in early pregnancy | No differences. More smaller placentomes and fewer larger placentomes in 70% protein group compared to 70% global group | No differences | NA | No changes in Doppler and echocardiographic parameters reflecting vascular resistance | NA | 50 |
| Sheep | Restricted at 70% of control feed allowance, singleton and twin pregnancies | No differences | No differences | No changes | No changes | NA | 51 |
| Sheep | Moderate restriction | Higher placental weight | Different effects, depending on time of restriction | NA | NA | NA | 15 |
| Guinea-pig | 70% of ad libitum fed control from periconceptual period till day 30 and till day 60 post conception | Lower placental weight | Lower fetal weight | Reduced the total placental surface area for exchange and surface density of trophoblast at day 30 and day 60 of gestation | Reduced capillaries volume at day 60. | The arithmetic mean barrier thickness for diffusion was increased by maternal food restriction at both gestational ages (day 30, +37%, and day 60, 40%) | 16 |
IVS star volume depends not only on the total size of IVS, but also on the presence of fibrin deposits and number, size, and spatial arrangement of villous arborization [25] and is inversely proportional to thickness of the villous membrane [41]. Spatial relationships between the villi and IVS depend not only on villi number, but also on location within placenta and umbilical cord blood pressure [41]. Mean star volume of villi depends on the length, diameter, degree of branching, shape, and presence or absence of syncytial intervillous bridges [25]. The ratio of villous volume to the star volume, an index of scale of villous proliferation, was not different between MNR and control groups in our study.
Contrary to our hypothesis glucocorticoid administration during the second half of gestation did not produce any volumetric changes in placental composition in baboons. Thus, the impaired placental function shown in rodents as a result of glucocorticoid exposure does not seem to hold in primates [18].
In summary, although capillaries grew more slowly, volumetric placental development in baboons follows the pattern of human placental development. IVS and villous star volumes were halved at term compared to mid-gestation, IVS porosity increased 8-fold, and hydraulic diameter decreased 1.53-fold in the second half of gestation.
When MNR was continued until the end of gestation, it decreased placental weight in the absence of a change in fetal weight. Placental villous volume and surface area were decreased, which was accompanied by changes in villous shape. MNR had different effect on capillarization in placentas from pregnancies in male and female fetuses. Capillary volume was unchanged in pregnancies with male fetuses and decreased if mothers were carrying female fetus, while capillary surface area was decreased. IVS hydraulic volume increased and the villous isomorphic coefficient increased in placentas from MNR baboons. MNR influences placental development via a mechanism that includes capillary coiling and increased IVS conductivity.
These changes suggest that under certain disadvantageous nutritional states, placental function decreases before fetal growth restriction occurs and thus is likely to play a causative role rather than being secondary to the deceleration of fetal growth. This primary role for MNR has been suggested by others [42].
Acknowledgments
This work was supported by NICHD HD 21350 and the Ray Ellison Grandchildren’s Trust, Friends of the Next Generation and the Ramsay Bequest at the Southwest Foundation for Biomedical Research whose support enabled the purchase of the Computer Assisted Stereoscopic Technology (CAST) system.
Footnotes
Publisher's Disclaimer: This is a PDF file of an unedited manuscript that has been accepted for publication. As a service to our customers we are providing this early version of the manuscript. The manuscript will undergo copyediting, typesetting, and review of the resulting proof before it is published in its final citable form. Please note that during the production process errors may be discovered which could affect the content, and all legal disclaimers that apply to the journal pertain.
References
- 1.Mayhew TM. Stereology and the placenta: where’s the point? -- a review. Placenta. 2006;27(Suppl A):S17–25. doi: 10.1016/j.placenta.2005.11.006. [DOI] [PubMed] [Google Scholar]
- 2.Beischer NA, Sivasamboo R, Vohra S, Silpisomkosal S, Reid S. Placental hypertrophy in severe pregnancy anaemia. J Obstet Gynaecol Br Commonw. 1970;77:398–409. doi: 10.1111/j.1471-0528.1970.tb03541.x. [DOI] [PubMed] [Google Scholar]
- 3.Laga EM, Driscoll SG, Munro HN. Comparison of placentas from two socioeconomic groups, 1: Morphometry. Pediatrics. 1972;50:24–32. [PubMed] [Google Scholar]
- 4.Kind KL, Moore VM, Davies MJ. Diet around conception and during pregnancy--effects on fetal and neonatal outcomes. Reprod Biomed Online. 2006;12:532–41. doi: 10.1016/s1472-6483(10)61178-9. [DOI] [PubMed] [Google Scholar]
- 5.Bloomfield PH, Harding JE. Experimental aspects of nutrition and fetal growth. Fetal Matern Med Rev. 1998;10:91–107. [Google Scholar]
- 6.James P. Marabou 2005: nutrition and human development. Nutr Rev. 2006;64:S1–11. doi: 10.1301/nr.2006.may.s1-s11. discussion S72–91. [DOI] [PubMed] [Google Scholar]
- 7.Godfrey KM. The role of placenta in fetal programming-a review. Placenta. 2002;23(Suppl A):S20–7. doi: 10.1053/plac.2002.0773. [DOI] [PubMed] [Google Scholar]
- 8.Houston ML. The development of the baboon (Papio sp. ) placenta during the fetal period of gestation. Am J Anat. 1969;126:17–29. doi: 10.1002/aja.1001260103. [DOI] [PubMed] [Google Scholar]
- 9.Albrecht ED, Pepe GJ. Placental steroid hormone biosynthesis in primate pregnancy. Endocr Rev. 1990;11:124–50. doi: 10.1210/edrv-11-1-124. [DOI] [PubMed] [Google Scholar]
- 10.Babischkin JS, Burleigh DW, Mayhew TM, Pepe GJ, Albrecht ED. Developmental regulation of morphological differentiation of placental villous trophoblast in the baboon. Placenta. 2001;22:276–83. doi: 10.1053/plac.2000.0621. [DOI] [PubMed] [Google Scholar]
- 11.Schmid-Schonbein H. Conceptional proposition for a specific microcirculatory problem: maternal blood flow in hemochorial multivillous placentae as percolation of a porous medium. Trophoblast Res. 1988;3:17–38. [Google Scholar]
- 12.Kaufmann P, Mayhew TM, Charnock-Jones DS. Aspects of human fetoplacental vascuologenesis and angiogenesis. II. Changes during normal pregnancy. Placenta. 2004;25:114–126. doi: 10.1016/j.placenta.2003.10.009. [DOI] [PubMed] [Google Scholar]
- 13.Jackson MR, Mayhew TM, Boyd PA. Quantitative description of the elaboration and maturation of villi from 10 weeks of gestation to term. Placenta. 1992;13:357–70. doi: 10.1016/0143-4004(92)90060-7. [DOI] [PubMed] [Google Scholar]
- 14.Mayhew TM. Recent applications of the new stereology have thrown fresh light on how the human placenta grows and develops its form. J Microsc. 1997;186:153–63. doi: 10.1046/j.1365-2818.1997.1250683.x. [DOI] [PubMed] [Google Scholar]
- 15.Faichney GJ, White GA. Effects of maternal nutritional status on fetal and placental growth and on fetal urea synthesis in sheep. Aust J Biol Sci. 1987;40:365–77. doi: 10.1071/bi9870365. [DOI] [PubMed] [Google Scholar]
- 16.Roberts CT, Sohlstrom A, Kind KL, Earl RA, Khong TY, Robinson JS, Owens PC, Owens JA. Maternal food restriction reduces the exchange surface area and increases the barrier thickness of the placenta in the guinea-pig. Placenta. 2001;22:177–85. doi: 10.1053/plac.2000.0602. [DOI] [PubMed] [Google Scholar]
- 17.Kelly RW. Nutrition and placental development. Proc Nutr Soc Australia. 1992;17:203–11. [Google Scholar]
- 18.Edwards CR, Benediktsson R, Lindsay RS, Seckl JR. Dysfunction of placental glucocorticoid barrier: link between fetal environment and adult hypertension? Lancet. 1993;341:355–7. doi: 10.1016/0140-6736(93)90148-a. [DOI] [PubMed] [Google Scholar]
- 19.Schlabritz-Loutsevitch NE, Hodara VL, Parodi LM, Hubbard GB, Jenkins SL, Dudley DJ, Nathanielsz PW, Giavedoni LD. Three weekly courses of betamethasone administered to pregnant baboons at 0.6, 0.65, and 0.7 of gestation alter fetal and maternal lymphocyte populations at 0.95 of gestation. J Reprod Immunol. 2006;69:149–63. doi: 10.1016/j.jri.2005.09.003. [DOI] [PubMed] [Google Scholar]
- 20.Schlabritz-Loutsevitch NE, Howell K, Rice K, Glover EJ, Nevill CH, Jenkins SL, Cummins LB, Frost PA, McDonald TJ, Nathanielsz PW. Development of a system for individual feeding of baboons maintained in an outdoor group social environment. J Med Primatol. 2004;33:117–26. doi: 10.1111/j.1600-0684.2004.00067.x. [DOI] [PubMed] [Google Scholar]
- 21.Cox LA, Nijland MJ, Gilbert JS, Schlabritz-Loutsevitch N, Hubbard GB, McDonald TJ, et al. Effect of thirty percent maternal nutrient restriction from 0.16 to 0.5 gestation on fetal baboon kidney gene expression. J Physiol (Lond) 2006;572:67–85. doi: 10.1113/jphysiol.2006.106872. [DOI] [PMC free article] [PubMed] [Google Scholar]
- 22.Jackson MR, Mayhew TM, Haas JD. The volumetric composition of human term placentae: altitudinal, ethnic and sex differences in Bolivia. J Anat. 1987;152:173–87. [PMC free article] [PubMed] [Google Scholar]
- 23.Burton GJ, Jauniaux E. Sonographic, stereological and Doppler flow velocimetric assessments of placental maturity. Br J Obstet Gynaecol. 1995;102:818–25. doi: 10.1111/j.1471-0528.1995.tb10849.x. [DOI] [PubMed] [Google Scholar]
- 24.Mayhew TM, Jairam IC. Stereological comparison of 3D spatial relationships involving villi and intervillous pores in human placentas from control and diabetic pregnancies. J Anat. 2000;197:263–74. doi: 10.1046/j.1469-7580.2000.19720263.x. [DOI] [PMC free article] [PubMed] [Google Scholar]
- 25.Mayhew TM, Wadrop E. Placental morphogenesis and the star volumes of villous trees and intervillous pores. Placenta. 1994;15:209–17. doi: 10.1016/s0143-4004(05)80457-6. [DOI] [PubMed] [Google Scholar]
- 26.Gundersen HJ, Jensen EB. Stereological estimation of the volume-weighted mean volume of arbitrary particles observed on random sections. J Microsc. 1985;138:127–42. doi: 10.1111/j.1365-2818.1985.tb02607.x. [DOI] [PubMed] [Google Scholar]
- 27.Mayhew TM. Patterns of villous and intervillous space growth in human placentas from normal and abnormal pregnancies. Eur J Obstet Gynecol Reprod Biol. 1996;68:75–82. doi: 10.1016/0301-2115(96)02486-4. [DOI] [PubMed] [Google Scholar]
- 28.Mayhew TM, Burton GJ. Methodological problems in placental morphometry: apologia for the use of stereology based on sound sampling practice. Placenta. 1988;9:565–81. doi: 10.1016/0143-4004(88)90001-x. [DOI] [PubMed] [Google Scholar]
- 29.Burton GJ, Palmer ME. Eradicating fetomaternal fluid shift during perfusion fixation of the human placenta. Placenta. 1988;9:327–32. doi: 10.1016/0143-4004(88)90040-9. [DOI] [PubMed] [Google Scholar]
- 30.Mayhew TM. Changes in fetal capillaries during preplacental hypoxia: growth, shape remodelling and villous capillarization in placentae from high-altitude pregnancies. Placenta. 2003;24:191–8. doi: 10.1053/plac.2002.0895. [DOI] [PubMed] [Google Scholar]
- 31.Kriewaldt FH, Hendrickx AG. Reproductive parameters of the baboon. Lab Anim Care. 1968;18:361–70. [PubMed] [Google Scholar]
- 32.Castellucci M, Kosanke G, Verdenelli F, Huppertz B, Kaufmann P. Villous sprouting: fundamental mechanisms of human placental development. 2000;6(5):485–494. doi: 10.1093/humupd/6.5.485. [DOI] [PubMed] [Google Scholar]
- 33.Lechtig A, Yarbrough C, Delgado H, Martorell R, Klein RE, Behar M. Effect of moderate maternal malnutrition on the placenta. Am J Obstet Gynecol. 1975;123:191–201. doi: 10.1016/0002-9378(75)90526-8. [DOI] [PubMed] [Google Scholar]
- 34.Lee R, Mayhew TM. Star volumes of villi and intervillous pores in placentae from low and high altitude pregnancies. J Anat. 1995;186:349–55. [PMC free article] [PubMed] [Google Scholar]
- 35.Dullien FA, Porous Media. Fluid Transport and Pore Structure. Academic Press; 1979. [Google Scholar]
- 36.Castellucci M, Scheper M, Scheffen I, Celona A, Kaufmann P. The development of the human placental villous tree. Anat Embryol (Berl) 1990;181(2):117–28. doi: 10.1007/BF00198951. [DOI] [PubMed] [Google Scholar]
- 37.Reshetnikova OS, Burton GJ, Teleshova OV. Placental histomorphometry and morphometric diffusing capacity of the villous membrane in pregnancies complicated by maternal iron-deficiency anemia. Am J Obstet Gynecol. 1995;173(3 Pt 1):724–7. doi: 10.1016/0002-9378(95)90330-5. [DOI] [PubMed] [Google Scholar]
- 38.Heasman L, Clarke L, Stephenson TJ, Symonds ME. The influence of maternal nutrient restriction in early to mid-pregnancy on placental and fetal development in sheep. Proc Nutr Soc. 1999;58:283–8. doi: 10.1017/s0029665199000397. [DOI] [PubMed] [Google Scholar]
- 39.Kuzmina IY, Hubina-Vakulik GI, Burton GJ. Placental morphometry and Doppler flow velocimetry in cases of chronic human fetal hypoxia. Eur J Obstet Gynecol Reprod Biol. 2005;120:139–45. doi: 10.1016/j.ejogrb.2004.09.001. [DOI] [PubMed] [Google Scholar]
- 40.Krebs C, Macara LM, Leiser R, Bowman AW, Greer IA, Kingdom JC. Intrauterine growth restriction with absent end-diastolic flow velocity in the umbilical artery is associated with maldevelopment of the placental terminal villous tree. Am J Obstet Gynecol. 1996;175:1534–42. doi: 10.1016/s0002-9378(96)70103-5. [DOI] [PubMed] [Google Scholar]
- 41.Karimu AL, Burton GJ. Star volume estimates of the intervillous clefts in the human placenta: how changes in umbilical arterial pressure might influence the maternal placental circulation. J Dev Physiol. 1993;19:137–42. [PubMed] [Google Scholar]
- 42.Jansson T, Powell TL. IFPA 2005 award in placentology lecture, human placental transport in altered fetal growth: does the placenta function as a nutrient sensor? –a review. Placenta. 2006;27 (Supp A):S91–S97. doi: 10.1016/j.placenta.2005.11.010. [DOI] [PubMed] [Google Scholar]
- 43.Dayton DH, Filer LJ, Canosa C. Cellular changes in the placentas of undernourished mothers in Guatemala. Federation Proc. 1969;28:488. [Google Scholar]
- 44.Murthy LS, Agarwal KN, Khanna S. Placental morphometric and morphologic alterations in maternal undernutrition. Am J Obstet Gynecol. 1976;124:641–6. doi: 10.1016/0002-9378(76)90067-3. [DOI] [PubMed] [Google Scholar]
- 45.Khanna S, Agarwal KN, Murthy LS. Placental histological changes in maternal undernutrition. Indian J Med Res. 1977;66:429–34. [PubMed] [Google Scholar]
- 46.Mukherjee NK, Mitra NK. The effect of malnutrition on placenta. Indian J Pathol Microbiol. 1990;33:314–22. [PubMed] [Google Scholar]
- 47.Kadyrov M, Kosanke G, Kingdom J, Kaufmann P. Increased fetoplacental angiogenesis during first trimester in anaemic women. Lancet. 1998;352:1747–9. doi: 10.1016/s0140-6736(98)02069-8. [DOI] [PubMed] [Google Scholar]
- 48.Stevens-Simon C, Metlay LA, McAnarney ER. Maternal prepregnant weight and weight gain: relationship to placental microstructure and morphometric oxygen diffusion capacity. Am J Perinatol. 1995;12:407–12. doi: 10.1055/s-2007-994509. [DOI] [PubMed] [Google Scholar]
- 49.Newnham JP, Kelly RW, Patterson L, James I. The influence of maternal undernutrition in ovine twin pregnancy on fetal growth and Doppler flow-velocity waveforms. J Dev Physiol. 1991;16:277–82. [PubMed] [Google Scholar]
- 50.Kalache KD, Ojutiku D, Nishina H, Green LR, Hanson MA. Mild maternal undernutrition in the first half of ovine pregnancy influences placental morphology but not fetal Doppler flow velocity waveforms and fetal heart size. J Perinat Med. 2001;29:286–92. doi: 10.1515/JPM.2001.041. [DOI] [PubMed] [Google Scholar]
- 51.MacLaughlin SM, Walker SK, Roberts CT, Kleemann DO, McMillen IC. Periconceptional nutrition and the relationship between maternal body weight changes in the periconceptional period and feto-placental growth in the sheep. J Physiol. 2005;565:111–24. doi: 10.1113/jphysiol.2005.084996. [DOI] [PMC free article] [PubMed] [Google Scholar]