

Abstract
The retrotrapezoid “nucleus” (RTN), located in the rostral ventrolateral medullary reticular formation, contains a bilateral cluster of ∼1000 glutamatergic noncatecholaminergic Phox2b-expressing propriobulbar neurons that are activated by CO2 in vivo and by acidification in vitro. These cells are thought to function as central respiratory chemoreceptors, but this theory still lacks a crucial piece of evidence, namely that stimulating these particular neurons selectively in vivo increases breathing. The present study performed in anesthetized rats seeks to test whether this expectation is correct. We injected into the left RTN a lentivirus that expresses the light-activated cationic channel ChR2 (channelrhodopsin-2) (H134R mutation; fused to the fluorescent protein mCherry) under the control of the Phox2-responsive promoter PRSx8. Transgene expression was restricted to 423 ± 38 Phox2b-expressing neurons per rat consisting of noncatecholaminergic and C1 adrenergic neurons (3:2 ratio). Photostimulation delivered to the RTN region in vivo via a fiberoptic activated the CO2-sensitive neurons vigorously, produced a long-lasting (t1/2 = 11 s) increase in phrenic nerve activity, and caused a small and short-lasting cardiovascular stimulation. Selective lesions of the C1 cells eliminated the cardiovascular response but left the respiratory stimulation intact. In rats with C1 cell lesions, the mCherry-labeled axon terminals originating from the transfected noncatecholaminergic neurons were present exclusively in the lower brainstem regions that contain the respiratory pattern generator. These results provide strong evidence that the Phox2b-expressing noncatecholaminergic neurons of the RTN region function as central respiratory chemoreceptors.
Introduction
The retrotrapezoid “nucleus” (RTN) is a functionally defined region of the reticular formation that has imprecise borders and contains several types of neuronal somata and dendrites (Smith et al., 1989; Cream et al., 2002; Stornetta et al., 2006). Based on the results of conventional lesions or stimulation of this brain region, the RTN regulates some aspect of breathing (inspiration, expiration, or both) and is involved in central respiratory chemoreception, the process by which CO2 is detected by the brain to regulate breathing (Cream et al., 1999; Nattie et al., 2001; Li and Nattie, 2002; Onimaru and Homma, 2003; Feldman and Del Negro, 2006; Guyenet, 2008). However, none of the experimental approaches used to date had the selectivity required to identify the specific type of neuron responsible for the observed physiological effects.
A bilateral cluster of ∼1000 noncatecholaminergic glutamatergic neurons that express the transcription factor Phox2b has been recently identified in rats within the functionally defined RTN (Stornetta et al., 2006). These neurons may be central respiratory chemoreceptors because they are vigorously activated by hypercapnia (increased arterial PCO2) in vivo and by extracellular acidification in slices (Mulkey et al., 2004, 2007; Stornetta et al., 2006; Onimaru et al., 2008). Furthermore, the region in which these cells reside innervates preferentially the lower brainstem areas that contain the central respiratory pattern generator (Mulkey et al., 2004; Rosin et al., 2006). Consistent with this hypothesis, transgenic mice with developmental problems that include the loss of the Phox2b-expressing neurons of the RTN region have lethal breathing deficits at birth (Dubreuil et al., 2008; Pagliardini et al., 2008). However, the notion that these particular Phox2b-expressing neurons are central respiratory chemoreceptors still lacks a crucial piece of evidence, which is that breathing increases when these neurons are selectively activated in vivo.
To test whether the selective activation of the Phox2b-expressing chemosensitive neurons of the RTN region drives breathing, we used a lentiviral vector to deliver an enhanced form (H134R mutation) of the light-activated cation channel channelrhodopsin-2 (ChR2) to these neurons (Nagel et al., 2003; Boyden et al., 2005; Adamantidis et al., 2007). A fusion protein between ChR2 and the fluorescent protein mCherry provided histological identification of the ChR2-expressing cell bodies and their axonal projections (Adamantidis et al., 2007). To drive ChR2-mCherry expression selectively to Phox2b-expressing neurons, we used the Phox2-responsive artificial promoter PRSx8, which is a multimer of a specific Phox2-(a or b)-responsive element (Hwang et al., 2001; Duale et al., 2007).
In this study, we show that PRSx8 drives high levels of expression of ChR2-mCherry selectively in Phox2b-containing neurons. By appropriately targeting the microinjections of lentivirus, we were able to restrict transgene expression almost exclusively to two populations of Phox2b-expressing neurons, the chemoreceptor candidates (the noncatecholaminergic Phox2b-expressing neurons) and the nearby C1 adrenergic neurons. The baseline transfection ratio (3:2 in favor of the putative chemoreceptor neurons) could be further increased by selective lesions of the C1 neurons. Using this approach, we showed that the selective photostimulation of the noncatecholaminergic Phox2b-expressing neurons of the RTN produces a long-lasting activation of the inspiratory motor outflow consistent with the notion that these neurons function as central respiratory chemoreceptors.
Materials and Methods
Animal use was in accordance with guidelines approved by the University of Virginia Animal Care and Use Committee.
Plasmid and virus preparation
PRSX8-ChR2-mCherry.
The AgeI–NotI fragment from pLenti-Synapsin-hChR2(H134R)-EYFP-WPRE containing hChR2(H134R) was subcloned into the pLenti-CaMKIIα-hChR2-mCherry-WPRE vector to replace the hChR2 with the hChR2(H134R) mutation providing a twofold increase in steady-state channel current (Gradinaru et al., 2007) [plasmids were provided by K. Deisseroth (Stanford University, Stanford, CA) (Adamantidis et al., 2007)]. We used the resulting construct (pLenti-CaMKIIα-hChR2 (H134R)-mCherry-WPRE) for all subsequent manipulations. The 240 bp artificial PRSx8 promoter (Hwang et al., 2001) was PCR amplified with the addition of PacI and AgeI restriction sites at the 5′ and 3′ ends, respectively, from a PRS-IRES-eGFP plasmid provided by M. Raizada (University of Florida, Gainesville, FL). The PRSx8 promoter was used to replace the CaMKIIα promoter (flanked with the PacI and AgeI restriction sites) to form the pLenti-PRSx8-hChR2 (H134R)-mCherry-WPRE vector (abbreviated PRSX8-ChR2-mCherry).
PRSX8-AllatoR-IRES-eGFP.
The pAAV-Syn-AlstR-IRES2-EGFP plasmid originally made by E. Callaway (Salk Institute, La Jolla, CA) (Tan et al., 2006) and obtained from Addgene (Addgene plasmid 14895) was used to make an AllatoR-IRES-eGFP insert by PCR amplification incorporating AgeI and NheI restriction sites. The resulting piece of DNA lacking the synapsin promoter was subcloned into a TOPO blunt vector (ZeroBlunt TOPO PCR cloning kit; Invitrogen) and then recut with AgeI and BsrGI. The 2447 bp piece including the sequence for the allatostatin receptor and the IRES-eGFP was then used to replace the Channelrhodopsin2-mCherry sequence flanked by the AgeI and BsrGI restriction sites in the pLenti-PRSx8-hChR2 (H134)-mCherry-WPRE viral construct described above.
Virus production and titering.
High-titer virus was produced after the protocol of Sena-Esteves et al. (2004) with the following modifications: (1) 15 × 150 mm plates of HEK293T cells and all volumes adjusted to 15 ml per plate; (2) 20 μl/plate of Lipofectamine 2000 (Invitrogen) as transfection agent; (3) 15 μg of lentivirus plasmid [PRSX8-hChR2 (H134R)-mCherry or AllatoR-IRES-eGFP], 10 μg of pCMVdeltaR8.74, and 5 μg of pMD2.G per plate (all plasmids provided by K. Deisseroth).
A dilution series of virus was placed on confluent PC12 cells (differentiated with 1% NGF) as well as HEK293T cells (negative control) for up to 1 week. Fluorescent cells were counted and the number of transducing units (TU) per milliliter was calculated. The titer for the PRSX8-ChR2-mCherry lentivirus was 9.36 × 10⁷ TU/ml. The titer for the PRSX8-AllatoR-IRES-eGFP was 1.14 × 10⁷ TU/ml. The same batch of either virus was used for all animals described for that virus in the current study.
Injections of lentivirus and toxin
The injections of virus [PRSx8-hChR2 (H134R)-mCherry or PRSx8-Allato-EGFP] were made while the rats (Sprague Dawley; males; weight, 219–282 g) were anesthetized with a mixture of ketamine (75 mg/kg), xylazine (5 mg/kg), and acepromazine (1 mg/kg) administered intramuscularly. Surgery used standard aseptic methods, and after surgery, the rats were treated with the antibiotic ampicillin (100 mg/kg, i.m.) and the analgesic ketorolac (0.6 mg/kg, i.p.). The lentivirus was delivered into the RTN by controlled pressure injection (60 psi; 3–8 ms pulses) using glass pipettes pulled to an external tip diameter of 25 μm. These pipettes (resistance, 6–12 Ω) allowed the recording of antidromic field potentials that were elicited by stimulating the mandibular branch of the facial nerve and were used to direct the electrode tip to the desired sites under the caudal pole of the facial nucleus. Injections were made unilaterally at two and, more rarely, three different rostrocaudally aligned sites separated by 200 (three injections) or 300 μm (two injections) for a total volume of 400 nl. In a subset of animals (n = 5), we also injected anti-dopamine-β-hydroxylase conjugated to saporin (antiDβH-sap; Advanced Targeting Systems) at 0.22 μg/μl bilaterally (four sites total; 100 nl per site) into the region of the lateral horn of the second thoracic segment (1.0–1.2 mm lateral of midline, 1 mm below lateral sulcus) to destroy the C1 neurons that project to the spinal cord. Animals were maintained for no less than 3 weeks before they were used in physiological experiments. The surgical procedures and virus injections produced no observable behavioral or respiratory effects, and these rats gained weight normally.
Physiology
In all but four rats, general anesthesia was induced with 5% isoflurane in 100% oxygen. Rats (365–410 g) received a tracheostomy. Artificial ventilation with 3.0–3.5% isoflurane in 100% oxygen was maintained throughout surgery. On completion of surgical procedures, isoflurane was reduced (1.8–2.0%). Adequate anesthesia was monitored by the absence of withdrawal reflex and blood pressure (BP) changes to a firm paw pinch. After administration of a paralyzing agent, adequate anesthesia was assessed by the absence of blood pressure changes to a firm paw pinch. Rectal temperature was maintained at 37.5 ± 0.5°C. In all animals, the femoral artery and vein were cannulated and the vagi were cut distal to the carotid bifurcation as previously described (Guyenet et al., 2005). Four rats (365–380 g) were anesthetized with urethane according to the following protocol. Induction was produced with an intraperitoneal injection of urethane in normal saline (1.3 g/kg in a 10% solution). This dose allowed catheter implantation. From this point on, supplementary doses of 0.1 g/kg were administered intravenously as needed (up to an additional 0.25 g/kg during the course of an experiment) to maintain a plane of anesthesia in which strong nociceptive pinch produced <5 mmHg change in blood pressure and no change in phrenic nerve discharge.
In 14 cases (10 isoflurane-anesthetized rats and 4 rats under urethane), the animals were placed in the stereotaxic frame in the prone position and a small portion of the occipital plate was removed to allow transcerebellar access to the RTN. The right phrenic and splanchnic nerves were dissected and recorded as previously described to monitor central respiratory drive to the diaphragm and sympathetic nerve discharge (Takakura et al., 2006; Moreira et al., 2007). In these animals, illumination of the RTN region was done by placing a 200-μm-diameter fiber optic (Thorlabs; catalog #BFL37-200) vertically through the cerebellum. Before inserting the fiber optic, we remapped the facial motor nucleus with antidromic field potentials using a glass pipette. Based on the updated coordinates of the facial motor nucleus, the optical fiber was placed between 300 and 1000 μm dorsal to where the ChR2-expressing neurons were located. Before commencing the protocol, rats were administered pancuronium (initial dose, 1 mg/kg, i.v.; plus additional 0.2 mg/kg doses if needed).
In some experiments (nine isoflurane-anesthetized rats), the animals were placed in the stereotaxic frame in the supine position. The muscle and other tissue overlying the base of the skull were removed, and we exposed the ventral surface of the medulla from the midpoint of the trapezoid body to the level of the most rostral hypoglossal rootlet. Teflon-coated silver wire was inserted through the skin into the diaphragm to record diaphragmatic EMG. In this group of animals, photostimulation of the ventral medullary surface was done with a fiber patch cable (Oz Optics; part no. QMMJ-33-IRVIS-200/240-3-2) mounted on a micromanipulator. The optic cable focused the light over a 1-mm-diameter circle and was maneuvered 1–2 mm above the ventral surface to a location at which the maximal respiratory effect was observed. The hot spot was always found immediately caudal to the trapezoid body and lateral to the pyramidal tract where the RTN is located.
In all cases, photostimulation of the ventrolateral medulla (VLM) was done with a diode pumped 473 nm blue laser (CrystaLaser model BC-473-060-M) controlled by a function generator (Leader Electronics) or a Grass model S88 stimulator (Astro-Med) to generate 10 ms light pulses at 20 Hz for 30 s. The light output of the laser was set at 12 mW for all experiments. The power at the end of the fiber optic was 9 mW, as measured with an optical power meter (PN20A; Thorlabs). The same fiber optic was used for all experiments. The power output was chosen empirically during the first few experiments based on the following three criteria: efficacy, reproducibility of the effects over a 3 h period, and lack of tissue lesion in the histological material other than the mechanical damage expected from the insertion of a 200-μm-thick object. The 12 mW setting was thereafter kept constant throughout the experiments and does not necessarily represent the optimal light intensity. Trials were repeated every 2 min for the entirety of the experiment. CO2 was added to inspired gases in a stepwise manner to increase basal respiratory drive. End-tidal CO2 (etCO2; a parameter closely approximating arterial PCO2) was monitored with a micro-capnometer (Columbus Instruments). To test whether photostimulation could evoke a cardiovascular response independent from changes in respiration, stimulation trials were conducted below apneic threshold when respiratory effects were not evoked. The peripheral vasodilator, hydralazine (10 mg/kg; Sigma-Aldrich), was administered intravenously to lower blood pressure and unload the arterial baroreceptors in specific experiments.
CO2-responsive RTN neurons were recorded in vivo using a dorsal transcerebellar approach as described previously (Guyenet et al., 2005). To allow recording electrodes free access to the region of interest, the 200-μm-thick fiber optic was inserted at an angle of 20° from the vertical in a transverse plane, and its tip was placed dorsomedial to the RTN region.
All analog data were stored on a computer via a micro1401 digitizer (Cambridge Electronic Design) and were processed off-line using Spike 5 software (Cambridge Electronic Design) as described previously (Guyenet et al., 2005; Takakura et al., 2006). Integrated phrenic nerve discharge (iPND), integrated diaphragmatic EMG (iEMG), and integrated splanchnic nerve discharge (iSND) were obtained after rectification and smoothing (τ = 0.015, 0.015, and 2 s, respectively) of the original signal, which was acquired with a 30–300 Hz bandpass. The product of the respiratory frequency times the amplitude of iPND or iEMG (f × A) was used to measure the total respiratory neural output of the preparation. PND amplitude (A), PND frequency (f), and the double product (f × A) were normalized in each experiment by assigning to each of the three variables a value of 100 at saturation of the chemoreflex (high CO2) and a value of 0 to periods of apnea. iSND was normalized within animals by assigning a value of 100 to resting SND and a value of 0 to the minimum value recorded either during administration of a dose of phenylephrine that saturated the baroreflex (10 μg/kg, i.v.) or after ganglionic blockade (hexamethonium; 5 mg/kg, i.v.; Sigma-Aldrich). In the animals designed to investigate the effect of ablating C1 neurons on the arterial pressure (AP) response to photostimulation, only trials in which the respiratory response to photostimulation was absent were used to avoid the confounding effects of diaphragmatic contraction on AP.
Statistical analysis was done using GraphPad 10 software. Unpaired Student's t test, one- and two-way ANOVAs were used as appropriate. The persistent frequency effects of photostimulation were analyzed using nonlinear regression. PND frequency (events per minute) was normalized by assigning a value of 100% to the final PND burst occurring during photostimulation, and a value of 0% to the average prestimulus burst frequency. Nonlinear fits (one-phase exponential decay) were fitted to the “relaxation” of PND frequency after photostimulation. Multiple trials were fitted with a single curve per animal, and the time to half response (t1/2) was used to describe the effect within and between groups. All grouped values are presented as mean ± SEM. Differences in which p < 0.05 were considered statistically significant.
Histology
After the end of the physiological procedures, the rats were deeply anesthetized and perfused with a heparin solution followed by a saline rinse and buffered 4% paraformaldehyde. After 1–2 d of postfixation, 30-μm-thick coronal sections were cut with a vibrating microtome according to previously established procedures (Kang et al., 2007). Phox2b was detected using an antibody raised in rabbit (1:800 dilution; provided by J.-F. Brunet, École Normale Supérieure, Paris, France). This primary antibody was detected using a donkey anti-rabbit IgG (H+L) tagged with Alexa Fluor 488 (1:200; Invitrogen) or with Cy3-conjugated donkey anti-rabbit IgG (H+L) (1:200; Jackson ImmunoResearch) depending on the other requirements of the experiments. Enhanced green fluorescent protein (EGFP) was detected using chicken anti-green fluorescent protein IgY (1:2000; Aves Labs) followed by either Cy3-conjugated donkey anti-chicken IgY (IgG) (H+L) (1:200; Jackson ImmunoResearch) or Cy2-conjugated donkey anti-chicken IgY (IgG) (H+L) (1:200; Jackson ImmunoResearch). mCherry was detected with Living Colors Rabbit Anti-DsRed Polyclonal Antibody (1:500; Clontech) followed by Alexa Fluor 488 donkey anti-rabbit IgG (H+L) (1:200; Invitrogen) or with Cy3-conjugated donkey anti-rabbit IgG (H+L) (1:200; Jackson ImmunoResearch). The specificity of the Phox2b antibody has been described previously (Kang et al., 2007). The antibodies against EGFP or mCherry revealed immunoreactive neurons only in the brainstem of rats that had received lentiviral vectors that encode EGFP or mCherry. The anti-tyrosine hydroxylase (TH) antibodies revealed the presence of immunoreactive neurons exclusively in the brain regions known to contain catecholaminergic neurons.
Mapping and cell counting
All histological material was examined and photographed using a Zeiss Axioimager.Z1 (Carl Zeiss Microimaging) with a Zeiss Axiocam MRc digital camera (basic resolution, 1388 × 1040 pixels). For estimation of the number and phenotype of transfected neurons, a one-in-six series of 30 μm coronal sections that encompassed the transfected brain area (from 7 to 10 sections/rat) was plotted using the Neurolucida computer-assisted graphing software as previously described (Stornetta et al., 2002).
Results
ChR2-mCherry is expressed by two classes of Phox2b-expressing neurons after injection of a lentiviral vector into the RTN
Injections of the lentivirus PRSX8-ChR2-mCherry into the left RTN region produced intense mCherry expression only in neurons, and the labeled neurons were always located in close proximity to the original injection site (i.e., under the caudal aspect of the facial motor nucleus) (Figs. 1A, 2A). Approximately 94% of the mCherry-positive neurons were immunoreactive for Phox2b as judged by analyzing one-in-six series of 30-μm-thick transverse sections from nine rats (8–10 sections/rat counted). Examples of mCherry-positive Phox2b-immunoreactive (ir) neurons are shown in Figure 1B. Supplemental Figure 1A (available at www.jneurosci.org as supplemental material) shows the anatomical distribution of the entire population of Phox2b-expressing neurons located in the ventral half of the medulla oblongata in a representative case. Excluding facial motor neurons that express very low levels of Phox2b in the adult, the Phox2b-expressing neurons form two clusters, as shown previously (Stornetta et al., 2006). The cluster of interest to the present study (VLM cluster) is located in close proximity to the ventral surface. It includes C1 catecholaminergic neurons and, in its rostral extension, the presumed RTN chemoreceptors, which are not catecholaminergic (Takakura et al., 2008). The VLM cluster is visibly separate from a more dorsal cluster of Phox2b-ir neurons that includes and surrounds the nucleus ambiguus. The ChR2-expressing neurons were confined to the region outlined by the VLM cluster, and, with few exceptions, all these cells were Phox2b-ir (supplemental Fig. 1A,B, available at www.jneurosci.org as supplemental material). Based on cells counts from four rats, ∼24% of the Phox2b-positive neurons located in the region of the VLM exposed to the virus expressed ChR2-mCherry (supplemental Fig. 1B, available at www.jneurosci.org as supplemental material).
Figure 1.
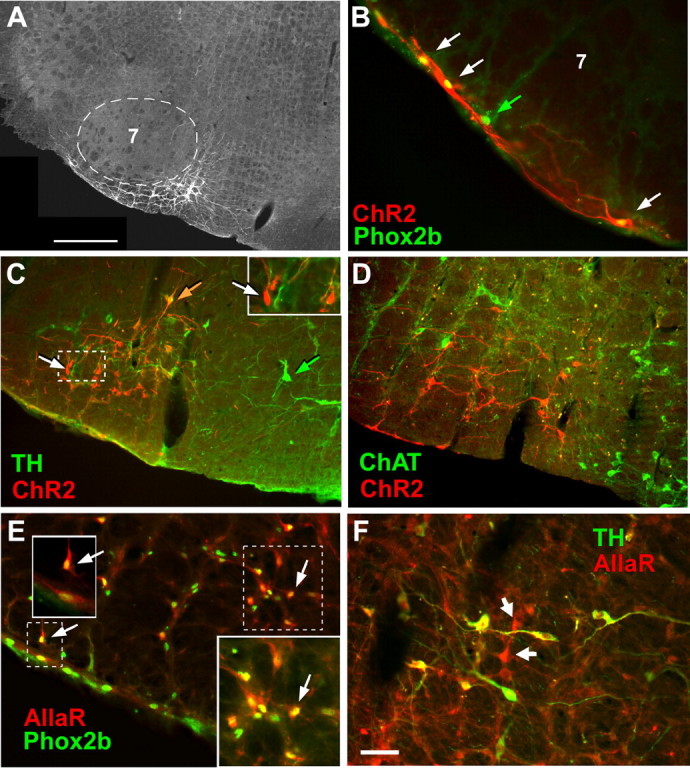
Transgene expression by noncatecholaminergic and catecholaminergic neurons after injection of PRSx8-ChR2-mCherry or PRSx8-AllatoR-IRES-EGFP lentivirus into region of the retrotrapezoid nucleus. A, Transverse section showing an injection site in the RTN. Fluorescent neurons expressing ChR2-mCherry are located exclusively medial and ventral to the facial motor nucleus (7; dotted line). In this and all other panels, medial is toward the right, lateral is left, and dorsal is up. Scale bar, 500 μm. B, ChR2-mCherry-expressing neurons located under the facial motor nucleus along the ventral medullary surface. Three neurons expressing the ChR2-mCherry transgene (red fluorescence; white arrows) have Phox2b-ir nuclei (green fluorescence appears yellow in mCherry-positive neurons). The neuron identified with a green arrow has a Phox2b-ir nucleus but was not transfected with virus. C, Neurons that express ChR2-mCherry are both catecholaminergic (TH-ir) and noncatecholaminergic. TH immunoreactivity is in green, and mCherry is red. Double-labeled neurons appear orange. One example is shown by the orange arrow. mCherry-expressing noncatecholaminergic neurons appear red (e.g., white arrows in the main photograph and the inset). Untransfected TH-ir neurons (located medially, toward the right side) show only green fluorescence (e.g., green arrow). D, Neurons expressing the ChR2-mCherry transgene are not cholinergic. The neurons expressing the mCherry fusion protein are in red, whereas the choline acetyltransferase (ChAT)-ir neurons are in green. Note that there are no double-labeled neurons. E, Neurons expressing the AllatoR-IRES-eGFP transgene (AllaR, revealed by GFP immunoreactivity, is visualized with red fluorescence) are Phox2b-ir (yellow or yellow-green fluorescent nuclei). The arrows point to a few examples. The insets are higher magnification of dashed outlines. F, Neurons expressing the AllatoR-IRES-eGFP transgene are a mixture of catecholaminergic C1 neurons (TH-ir) (double-labeled neurons appear yellow, a combination of green and red fluorescence) and noncatecholaminergic neurons (red fluorescence only; white arrows). Scale bar: (in F) B, E, F, 50 μm; C, D, 100 μm.
Figure 2.

Distribution and quantification of neurons expressing the ChR2-mCherry transgene. A, Distribution of C1 (ChR2+TH+, yellow squares) and noncatecholaminergic neurons (ChR2+TH−, red circles) expressing ChR2-mCherry in a representative rat (neuronal nuclear profiles counted in a 1-in-6 series of 30-μm-thick transverse sections through the injection site). Nontransfected C1 neurons (ChR2−TH+, blue triangles) are also represented. Each symbol represents one cell. The numbers in the top left corner of each section refer to the distance of the section behind bregma in millimeters [after the atlas of Paxinos and Watson (2005)]. By our convention, 11.6 mm is designated as the first section in which the facial motor neurons appear from a caudal approach, and the rest of the sections are placed relative to this landmark. Brain reconstructions were made using the Neurolucida software (MBFBioscience) and a Zeiss Axioskop II microscope with epifluorescence using filter sets for Cy3 and Alexa 488 fluorophores. Note the vertical lesion caused by the placement of the fiber optic in the section corresponding to bregma level 11.42. B, Group data. Two of the plots show the rostrocaudal distribution of noncatecholaminergic (TH−, red circles, red line) and catecholaminergic (TH+, yellow squares, black line) neurons that expressed mCherry after injection of PRSX8-ChR2-mCherry virus into the RTN region (mean ± SEM; 7 rats). The remaining plot shows the distribution of all the neurons (TH+ and TH−) that expressed eGFP after injection of PRSX8-Allatostatin receptor-IRES-eGFP virus into the RTN region (black circles, dashed line; 5 rats). C, Total number of counted catecholaminergic (TH+) and noncatecholaminergic neurons expressing the transgene after injection of PRSX8-ChR2-mCherry lentivirus (7 rats; cell counts in black bars) or PRSX8-AllatoR-IRES-EGFP lentivirus (5 rats; cell counts of EGFP-ir in gray bars) into the RTN region (mean ± SEM). Cell counts were made in each rat in a one-in-six series of 30 μm sections as in A. Accordingly, the estimated total number of transfected neurons is approximately six times that reported on the graph.
The ChR2-mCherry fusion protein was expressed in both catecholaminergic (identified with TH immunoreactivity) and noncatecholaminergic neurons (Fig. 1C) and was usually absent from cholinergic neurons (Fig. 1D). Figure 2A shows the distribution of the transfected neurons in one representative case. Catecholaminergic (TH-ir) and noncatecholaminergic mCherry-expressing neurons are represented separately. The catecholaminergic neurons located medial to the RTN region (blue triangles) were not transfected, which underscores the limited spread of the infection. Of note, the portion of the ventral respiratory column that corresponds to the Bötzinger complex (located immediately under the nucleus ambiguus, Amb, in Fig. 2A, at bregma levels −11.6 to −12.1 mm) did not contain labeled neurons, nor did the pre-Bötzinger complex region, which is located caudal to bregma level 12.1 (Fig. 2B). These two brain regions contain neurons that are essential for respiratory rhythm and pattern generation (Rybak et al., 2004; Alheid and McCrimmon, 2008).
Based on a quantitative analysis of seven rats processed for simultaneous detection of mCherry and tyrosine-hydroxylase, 423 ± 38 neurons were mCherry-positive per rat. This estimate was obtained by counting the nuclear profiles of labeled neurons in a one-in-six series of 30-μm-thick sections, multiplying the number by 6, and adjusting the resulting number with the Abercrombie correction as per Takakura et al. (2008). Of the 423 neurons, 169 ± 19 were catecholaminergic, and the remaining 254 ± 31 neurons were noncatecholaminergic. These cells were generally located ventrolateral to the TH-ir neurons and under the facial motor nucleus; therefore, they had the location and phenotype of the putative chemoreceptors (Stornetta et al., 2006). Only 13 of 242 mCherry neurons counted in three rats processed for simultaneous detection of mCherry and choline acetyl-transferase (5%) were cholinergic. We estimate therefore that the virus labeled on average and in each rat ∼241 Phox2b-ir noncatecholaminergic and noncholinergic neurons (putative chemoreceptors), 169 catecholaminergic neurons belonging to the C1 group (Card et al., 2006), and 13 cholinergic neurons. The number of putative chemoreceptors (Phox2b-ir noncatecholaminergic and noncholinergic neurons) present in the RTN has been previously estimated at 2000 total (1000 per side); therefore, on average, only 12% of the total brain population of putative RTN chemoreceptors (240 of 2000) expressed ChR2 after unilateral lentivirus injection.
Photostimulation of ChR2-expressing neurons increases phrenic nerve activity and blood pressure
Figure 3 describes the typical cardiorespiratory effects produced by photostimulation of the RTN region with blue light (λ = 473 nm) in one isoflurane-anesthetized vagotomized rat subjected a unilateral microinjection of PRSx8-ChR2-mCherry lentivirus 4 weeks before the light stimulation experiment. The rat was respirated with pure oxygen to insure that the addition of CO2 to the breathing mixture would activate central chemoreceptors only. The 20 Hz pulsed 473 nm laser light (10 ms pulses) was applied with a 200 μm optical fiber inserted into the brain tissue from the dorsal surface to within <1 mm of the transfected cells for periods of 30 s every 2 min while end-tidal CO2 was increased in a stepwise manner by adding CO2 to the breathing mixture. Three representative episodes are shown in Figure 3A. When CO2 was kept up to 1% below the apneic threshold (the CO2 level at which PND starts to appear) (Fig. 3A1), or very close to this threshold (Fig. 3A2), the photostimulation produced a very large increase in the amplitude and frequency of the PND. The magnitude of the respiratory responses caused by the photostimulation (both amplitude and frequency effects) decreased steeply above this threshold to reach essentially zero at the level of end-tidal CO2 that saturated the chemoreflex at rest (6–7% CO2) (Fig. 3A3). The relationship between end-tidal CO2 and the magnitude of the respiratory response caused by the photostimulation is described graphically in Figure 3B–D, in which each pair of vertically aligned open and closed symbols represents a different episode of photostimulation (closed, rest; open, photostimulation). At rest, PND frequency (Fig. 3B), PND amplitude (Fig. 3C), and the product of PND frequency and amplitude (a measure of the total phrenic neural output) (Fig. 3D) were a saturable function of the end-expiratory CO2, a well described characteristic of the respiratory response to central chemoreceptor stimulation in vagotomized animals (Eldridge et al., 1984). During photostimulation, each of these three dependent variables was increased relative to their corresponding resting values (Fig. 3B–D), but the magnitude of the change decreased sharply with increasing levels of end-expiratory CO2 to reach essentially zero at high levels of end-expiratory CO2 (Fig. 3E–G). In other words, RTN stimulation could not increase PND amplitude or frequency beyond the levels that these parameters reached naturally when the rat was exposed to a high level of CO2. In effect, RTN stimulation left-shifted the relationship between PND (f × A) and end-expiratory CO2 such that the apneic threshold was ∼1% CO2 lower during the photostimulation (Fig. 3B–D). The relationship between the photoactivation-induced increase in PND frequency (f), PND amplitude (A), or total respiratory output (f × A) and the resting levels of these parameters is represented in Figure 3E–G.
Figure 3.

Cardiorespiratory effects produced by photostimulation of ChR2-expressing RTN neurons in one rat. A, Pulsed laser light (473 nm; 10 ms, 20 Hz) was applied for 30 s every 2 min to the ventrolateral medulla through a 200-μm-thick fiber optic while the end-tidal CO2 (etCO2) (top trace) was set at various levels. Shown are the effects of the photostimulation (laser ON; horizontal bars) on phrenic nerve discharge frequency (PND; second trace from top), PND amplitude (rectified and integrated with 0.015 s time constant; third trace from top), and arterial pressure (AP) (fourth trace). Episode A1 was recorded while etCO2 was below the apneic threshold, episode A2 while etCO2 was just above the apneic threshold, and episode A3 while etCO2 was close to the saturation of the central chemoreflex. B, Relationship between the respiratory frequency and etCO2. C, Relationship between PND amplitude and etCO2. D, Relationship between the total respiratory outflow (f × A, product of PND amplitude and PND frequency, normalized to 100%) and etCO2. Each pair of vertically aligned symbols (a dot and a circle) derives from one episode of photostimulation such as shown in A1–A3. E, Relationship between the photoactivated increase in respiratory frequency and the respiratory frequency at rest. The graph is derived from the data shown in B. F, Relationship between the photoactivated increase in the amplitude of the PND and the PND amplitude at rest. The graph is derived from the data shown in C. G, Relationship between the respiratory response caused by each period of photostimulation (increase of the f × A product) and the resting level of respiratory activity (f × A). The graph is derived from the data shown in D. H, Changes in MAP and SND plotted as a function of etCO2. All panels are from the same rat.
The experiment shown in Figure 3 was reproduced with very similar results in four isoflurane-anesthetized rats and in four urethane-anesthetized rats. The data from these nine rats were therefore pooled and are summarized in Figure 4. In this summary figure, the effects of photostimulation on the PND frequency were normalized because of the higher maximum breathing rate of the urethane-anesthetized rats at saturation of the chemoreflex (38.5 ± 2.6 vs 51.1 ± 3.5 bursts/min; p < 0.05). To summarize briefly, RTN stimulation raised PND frequency by up to 88.3 ± 4.8% of the maximum value observed at saturating levels of CO2 (range, 85.2 ± 117.4%) and the largest effect of RTN stimulation on PND amplitude was 54 ± 4% of the maximum resting value observed at saturating levels of CO2 (range, 55.0–67.9%)
Figure 4.

Cardiorespiratory effects produced by photostimulation of the ventrolateral medulla: group data. Effects produced by applying blue laser light (473 nm; 10 ms, 20 Hz) to the ventrolateral medulla in nine rats treated with PRSx8-ChR2mCherry-lentivirus (pooled data of 5 isoflurane-anesthetized rats and 4 urethane-anesthetized rats) and five control rats treated with PRSx8-allatoR-EGFP-lentivirus. A, Plot of the increase in respiratory frequency as a function of the resting phrenic nerve discharge. PND frequency was regrouped by quintiles and normalized to the maximum frequency observed at saturation of the chemoreflex. B, Plot of the increase in respiratory amplitude as a function of the resting phrenic nerve amplitude regrouped by quintiles and normalized to the maximum amplitude observed at saturation of the chemoreflex. C, Plot of the increase in total phrenic outflow (f × A) as a function of the resting PND also regrouped by quintiles and normalized to the maximum value observed at saturation of the chemoreflex. The difference between the control rats and the experimental rats was highly significant for all three dependent variables (see text for statistics). D, Effect of photostimulation on the MAP and on the SND plotted as a function of the total phrenic nerve activity f × A divided in quintiles as in A–C. The difference between the rats treated with the experimental virus (ChR2) and the control virus was highly significant (see text for statistics). Error bars indicate SEM.
Illumination of the RTN region also produced a small rise in blood pressure and splanchnic sympathetic nerve discharge (original trace not shown) (Fig. 3A,H). On average, these changes were significant (blood pressure, +5.2 ± 0.4 mmHg; sympathetic nerve activity, +9.9 ± 1.0 U; five isoflurane-anesthetized rats). The magnitude of these changes was independent of the prevailing level of end-tidal CO2 [mean arterial pressure (MAP), F(4,29) = 0.26, p = 0.90; SND, F(4,29) = 1.0, p = 0.40, two-way ANOVA] (Fig. 4D). RTN stimulation produced similarly small but significant effects on blood pressure in urethane-anesthetized rats (6.7 ± 1.0 mmHg; p < 0.05). This effect was of the same magnitude as that observed in the isoflurane group of ChR2-transfected rats (p = 0.43).
The effects of photostimulation on PND and BP were unchanged after repeated episodes of photostimulation (up to 50 over 100 min). This evidence plus the absence of histological damage attributable to heat in the region surrounding the tip of the optical fiber suggest that the repeated photostimulation episodes did not alter the properties of the ChR2-expressing neurons over the course of the typical experiment.
To ascertain that the effect of the photostimulation was selectively caused by the presence of ChR2, the experiment described above was repeated in five isoflurane-anesthetized rats that had received injections of identical volumes of a PRSx8-allatoR-EGFP lentivirus of similar titer. The PRSx8-allatoR-EGFP lentivirus produced a rate of infection of RTN neurons that was very similar (total of 324 ± 32 transfected neurons per brain with 92% Phox2b-ir neurons) to that caused by the PRSx8-ChR2-mCherry lentivirus (Figs. 1E,F, 2C) and the anatomical distribution of the transfected neurons was indistinguishable (Fig. 2B). However, laser light applied in the same manner as in the experimental group produced no effect on any of the dependent variables measured and the difference between the experimental ChR2 and control allatoR-expressing rats was highly significant (f, F(1,45) = 106.7, p < 0.001; A, F(1,46) = 62.1, p < 0.001; f × A, F(1,50) = 41.94, p < 0.001; MAP, F(1,47) = 57.7, p < 0.001; SND, F(1,29) = 61.3, p < 0.001; two-way ANOVA) (Fig. 4A–D). This evidence demonstrates that the responses to photostimulation observed in the experimental rats must have been caused by the presence of ChR2 and could not result merely from nonspecific viral infection or inflammation caused by the virus.
Photostimulation activates and entrains a subset of the CO2-responsive neurons of the RTN region
By inserting the fiber optic at an angle of 20° from the vertical, we were able to illuminate the RTN region with laser light while recording single units located near the caudal edge of the facial motor nucleus (one rat under isoflurane, two rats under urethane anesthesia). Twelve CO2-activated units with properties previously associated with the noncatecholaminergic Phox2b-expressing glutamatergic neurons were identified (Mulkey et al., 2004; Stornetta et al., 2006). As previously described, these neurons were located in the RTN below the caudal end of the facial motor nucleus (Fig. 5A); they were silent at end-tidal CO2 <3.5–4% and were increasingly active above that threshold level (Fig. 5B). At high CO2 levels, their discharge probability fluctuated predictably throughout the respiratory cycle (respiratory modulation), but, unlike the neurons that make up the core of the respiratory rhythm and pattern generator, for example the Bötzinger region neurons described below, they were not silent during a specific portion of the respiratory cycle (not illustrated).
Figure 5.

Photoactivation of the CO2-responsive RTN neurons. A, Location of 12 CO2-activated neurons located in the RTN and 9 control respiratory cells located in the Bötzinger region of the ventral respiratory column. The location of the cells is plotted using their stereotaxic coordinates relative to the base and the caudal edge of the facial motor nucleus as determined by antidromic field potentials. The base of the brain is between 0.3 and 0.4 mm below the facial motor nucleus. B, Effect of a train of laser pulses (473 nm; 10 ms, 20 Hz) on a CO2-responsive RTN neuron recorded at low (left trace) and high level of end-tidal CO2 (right trace). C, Activation of a Bötzinger expiratory-augmenting neuron by photostimulation applied to the RTN region at low (left trace) and at high level of end-tidal CO2 (right trace). D, Top traces, Examples of two RTN neurons that were presumably directly photoactivated via ChR2. These cells fired a single action potential toward the end of almost every light pulse. Bottom trace, Bötzinger respiratory neuron, shown in C, which was presumably indirectly (i.e., synaptically) activated by the photostimulation of the RTN. The action potentials of this neuron were not synchronized with the light pulses. E, Probability histogram showing the distribution of action potentials occurring from 5 ms before the light pulses to 20 ms after the end of the light pulses. The histograms were built using the onset of the light pulses as trigger. The top trace describes four RTN neurons that were strongly synchronized with the light pulses; the middle trace describes the remaining eight RTN neurons. The bottom histogram represents six Bötzinger area respiratory neurons activated during photostimulation. F, Average discharge frequency of the RTN neurons at rest and during photostimulation. The four RTN neurons that were vigorously entrained by the photostimulation on a pulse-by-pulse basis are represented separately from the rest of the RTN neurons. The effect of photostimulation on the neuronal firing rate at low and high levels of end-expiratory CO2 are also represented. Error bars indicate SEM. Asterisks indicate statistically significant difference from resting (paired t test).
Four of the 12 CO2-sensitive RTN neurons were vigorously activated by photostimulation (Fig. 5B) and their action potentials became highly synchronized with the light pulses (Fig. 5D, top two traces; E, top trace). The action potentials of the other eight RTN CO2-sensitive neurons were not or only very weakly synchronized with the light pulses (Fig. 5E, middle trace). As a group, the four CO2-sensitive RTN neurons with action potentials that were synchronized to the light pulses were very robustly activated by photostimulation both at low and at high levels of end-expiratory CO2 (Fig. 5F, “entrained” RTN neurons), whereas the other eight cells that were not or poorly entrained by individual light pulses were marginally activated (Fig. 5F, poorly entrained RTN neurons). Pulse-by-pulse entrainment is a hallmark of the direct photoactivation of ChR2-transfected neurons (Adamantidis et al., 2007; Arenkiel et al., 2007; Gradinaru et al., 2007). The fact that only 33% of the CO2-activated neurons of the RTN region were entrained in this manner by the light pulses (4 of 12) is consistent with the above-described anatomical results, which indicated that only a subset of the Phox2b-positive noncatecholaminergic neurons of this region expressed ChR2 in these rats.
In these three rats, we also recorded from nine respiratory neurons located in the Bötzinger region of the ventral respiratory column (i.e., caudal and dorsal to the RTN) (Fig. 5A). Six of these neurons (three expiratory-augmenting, one expiratory-decrementing, one expiratory throughout, one inspiratory) had ON–OFF patterns of discharge and were silent below the apneic threshold. These neurons were activated during photostimulation approximately in proportion to the effect of the same stimulation on the PND (Fig. 5C), but none of the cells was photoactivated on a pulse-by-pulse basis (Fig. 5D, bottom trace; E, bottom trace). The remaining three neurons (I-inhibited Bötzinger neurons) were tonically active below the apneic threshold and developed an inspiratory inhibition above this threshold. These neurons were not synchronized by the light pulses (results not illustrated).
Cardiorespiratory effects produced by photostimulation of ChR2-expressing RTN neurons in rats with lesions of C1 neurons
Our working hypothesis was that photostimulation of the ChR2-expressing noncatecholaminergic neurons was responsible for the increase in PND, whereas photoactivation of the neighboring ChR2-expressing C1 neurons caused the rise in BP and SND. To test this hypothesis, we compared the cardiorespiratory responses evoked in control rats in which ChR2-mCherry was expressed by the usual mixture of noncatecholaminergic and catecholaminergic cells (N = 5) and in experimental rats (N = 5) in which the number of ChR2-expressing catecholaminergic cells were reduced by selective lesions of the C1 cells. To destroy the C1 neurons, we administered a catecholaminergic neuron-selective toxin [anti-dopamine-β-hydroxylase-saporin (anti-DBH-sap)] to the experimental rats (Schreihofer et al., 2000; Wiley and Kline, 2000). This toxin was injected into the thoracic spinal cord during the same surgery when PRSx8-ChR2-mCherry lentivirus was injected into the RTN region. Anti-DBH-sap binds to the enzyme that is exteriorized on the plasma membrane of catecholaminergic neurons during exocytosis and the complex is internalized during membrane recycling (Wiley and Kline, 2000). Saporin is then transported back to the cell bodies in which it kills neurons by inhibiting ribosomal protein synthesis (Wiley and Kline, 2000). The physical elimination of the bulbospinal C1 cells is complete within 2 weeks (Schreihofer et al., 2000). All the physiological experiments were done 4 weeks after virus and toxin injections.
For the physiological experiments, we used a ventral approach to the medulla oblongata and we used the diaphragmatic EMG instead of the phrenic nerve activity as an index of respiration. A ventral approach to the medulla was used in these experiments so that we could also explore the site specificity of the cardiorespiratory responses to photostimulation. BP was used as the sole cardiovascular parameter. Photostimulation produced a reproducible increase in inspiratory activity (diaphragmatic EMG) with characteristics similar to the phrenic nerve responses described in Figures 3 and 4 (original recordings not illustrated). The increases in total respiratory outflow (f × A) caused by photostimulation were also maximal close to the apneic threshold (mean, 59.8 ± 14.8%; range, 22.8–106.7%) and became gradually smaller with increasing levels of end-tidal CO2 (F(4,32) = 7.7; p < 0.001) (Fig. 6A).
Figure 6.
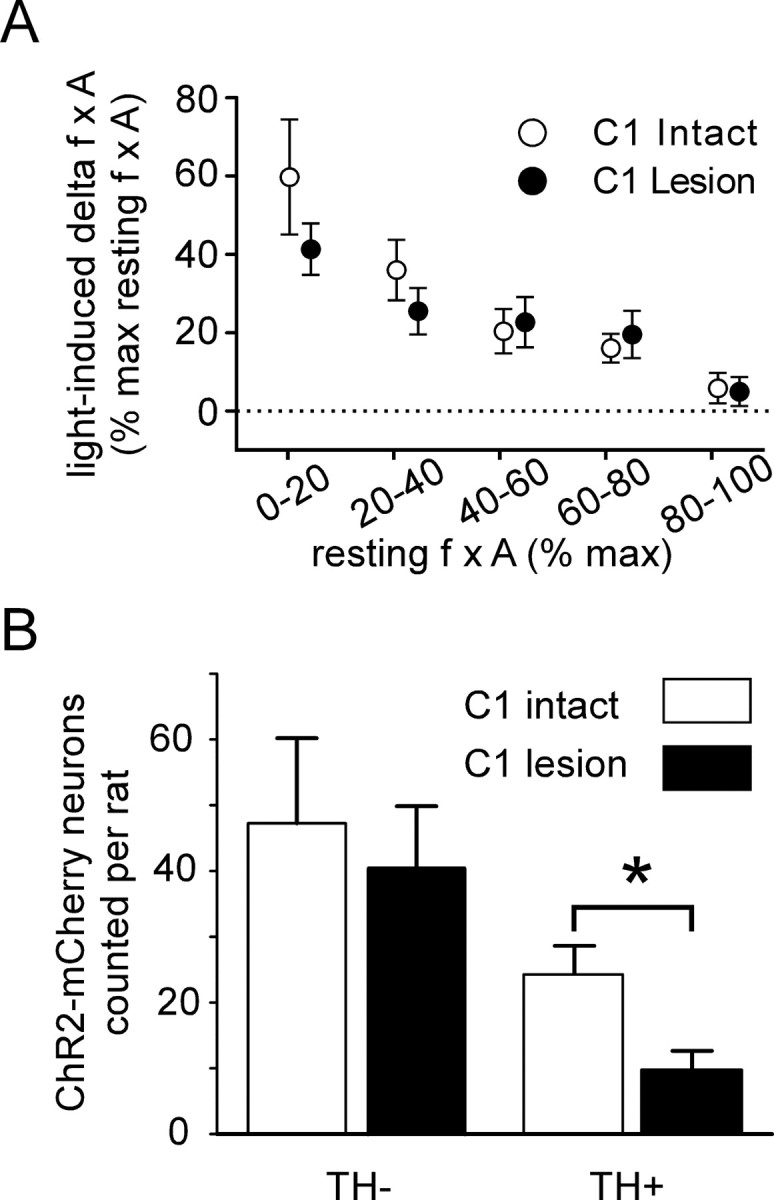
Cardiorespiratory effects produced by stimulating ChR2-expressing neurons in control rats versus rats with C1 cell lesions. A, Plot of the respiratory response (increase in f × A) to photostimulation as a function of the resting value of f × A. The f × A product was normalized as in Figures 3G and 4C, the 100% value representing the highest value observed at saturation of the chemoreflex. The respiratory response produced in control rats and in rats with lesions of the C1 neurons was the same (ns, two-way ANOVA). B, Total number of ChR2-mCherry-positive neurons counted in control and C1 lesion rats in a one-in six series of sections (actual numbers of neurons labeled per rat should be ∼6 times larger). The number of catecholaminergic neurons (TH-ir) that expressed the transgene was greatly reduced in the C1 lesion rats (p < 0.05 by unpaired t test), whereas the number of TH-negative neurons (RTN neurons) was the same (ns, unpaired t test). Error bars indicate SEM. The asterisk indicates statistically significant difference.
In these experiments, the site selectivity of the cardiorespiratory response was explored by directing the laser light to various regions of the ventral medullary surface. Illumination of the contralateral medullary surface produced no effect on diaphragmatic EMG or blood pressure (five rats) (results not illustrated). Illumination of the pyramidal tract (medial to the RTN) or the trapezoid body (rostral to the RTN) on the side ipsilateral to the virus injection likewise produced no effect (five rats) (results not shown).
On average, the respiratory response produced by photostimulation of the ventral medullary surface was indistinguishable from the effects produced by the transcerebellar fiberoptic approach described in the previous section (F(1,31) = 0.87; p = 0.36). Importantly, the degree of respiratory stimulation caused by application of pulsed blue laser light directly to the ventral medullary surface was identical in intact rats and in rats with C1 lesions (F(1,30) = 0.76; p = 0.39) (Fig. 6A). In contrast, photostimulation produced virtually no increase in BP in the rats with C1 lesions (8.3 ± 1.4 vs 0.9 ± 0.5 mmHg; p < 0.01). Resting BP was slightly but also significantly lower in the C1-lesion group (72.6 ± 5.5 mmHg vs 94.2 ± 6.3; p < 0.05) presumably because of the reduction in the number of bulbospinal C1 neurons.
A quantitative analysis of the neurons that expressed ChR2-mCherry in four of five control rats and four of five rats with C1 lesions revealed that the total estimated number of ChR2-expressing TH-negative neurons was about the same in each group (control group, 230 ± 62; C1 lesion group, 197 ± 45; ns from controls), but the number of ChR2-expressing C1 neurons was reduced ∼60% in the rats with C1 lesions (48 ± 13 vs 118 ± 21 for controls; p < 0.05) (Fig. 6B). We do not know why a mere 60% reduction of the number of ChR2-expressing C1 neurons eliminated the blood pressure rise caused by photostimulation of the rostral medulla. We can only speculate that a minimum number of C1 neurons must express ChR2 for photostimulation to produce a detectable change in blood pressure.
Slow relaxation of the respiratory response to photostimulation of the RTN region
Figure 7A illustrates a typical respiratory response elicited by photostimulation while the CO2 level was maintained just above the apneic threshold in a urethane-anesthetized rat. The relaxation of the response was analyzed by plotting the relationship between the instantaneous respiratory frequency normalized from 0 to 100% and the time after the end of the photostimulation as shown in Figure 7A. The large open circles in Figure 7B represent this relationship for the episode shown in Figure 7A. The small dots in Figure 7B represent the relaxation of additional episodes of photostimulation performed in the same rat below saturation of the chemoreflex. In each rat, the entire series of points could be fitted reasonably well to a single exponential (t1/2, 8.4 s, and r2 = 0.78 in the case shown in Fig. 7; mean r2 = 0.80 ± 0.2). This exponential decay followed an abrupt initial drop down to 65–90% of the maximum frequency observed at the end of the stimulus period. The average t1/2 observed in 13 rats (9 rats with dorsal photostimulation via small optical fiber; 4 rats using ventral surface illumination) was 11.0 ± 1.1 s. The t1/2 was the same in rats with C1 lesions (12.4 ± 2.0 s; N = 5) as in control rats (p = 0.78). The relaxation of the amplitude component of the response was similarly analyzed using the normalization indicated in Figure 7A. For this analysis, we selected only the episodes in which the amplitude increased by at least 30% over baseline. The t1/2 of the amplitude component of the response was similar to that of the frequency component (15.5 ± 1.9 s; p = 0.28).
Figure 7.

Persistence of the respiratory response elicited by photostimulation of the ChR2-expressing neurons. A, Representative respiratory response to photostimulation of the RTN region in a urethane-anesthetized rat (473 nm, 20 Hz, 10 ms light pulses; transcerebellar optical fiber method). The drawing illustrates how the increase in PND amplitude and frequency were normalized. B, Relaxation of the frequency response after the end of the photostimulation period. The change in PND frequency is normalized as shown in A. The episode shown in A is represented by the open circles. The other episodes of photostimulation in the same animal are represented by small dots. The curve is the best single-exponential fit through all the points.
For comparison, we also analyzed the kinetics of the sympathetic nerve response to photostimulation (Fig. 8A). Figure 8B shows the grand average obtained by averaging five individual responses per rat and further averaging the resulting curves across five rats, normalized from baseline (0%) to peak (100%). SND increased immediately after the start of photostimulation and reached a half-maximum value 2.0 ± 0.3 s after the onset of the stimulus. SND decayed precipitously at the offset of the stimulus (average t1/2 from level present at the end of the stimulus, 0.71 ± 0.22 s), eventually reaching a value slightly lower then the prestimulus baseline before returning to baseline. Blood pressure rose after a short delay, continued to increase slightly during the stimulus, and also decayed more slowly than the SND. The slow and gradual decrement of the SND observable during the latter part of the stimulus period was presumably attributable to baroreflex compensation, and the same explanation accounts for the undershoot of the SND soon after the end of the stimulus (Fig. 8A,B). To determine whether the baroreflex could have accounted for the very rapid return to control of SND after the end of the photostimulation, we examined whether this decay time was changed by lowering the blood pressure to a level considerably below the baroreflex threshold. As shown in one representative case (Fig. 8C), lowering mean BP with the arteriolar dilator drug hydralazine (10 mg/kg) from the normal mean level of 110 mmHg down to 60 mmHg caused an increase in the SND response to photostimulation (Fig. 8C) and a change in kinetic better appreciated after normalization and signal averaging (representative example in Fig. 8D). As shown in Figure 8D, after functional baroreceptor denervation achieved by hydralazine treatment, SND rose rapidly initially during photostimulation and then kept increasing, albeit more slowly, and never decreased, peaking 27.3 ± 0.6 s after onset (p < 0.001 vs control). Furthermore SND did not display any undershoot after interruption of the stimulus. The return to baseline, although still rapid (time to 50% decrease from the level present at the end of the stimulus, 2.9 ± 0.52 s; N = 3 rats), was somewhat slower than in rats with normal levels of resting blood pressure (p < 0.01). However, SND still recovered at least four times faster than the phrenic outflow after the end of the photostimulation.
Figure 8.

Kinetic properties of the sympathetic nerve response produced by photostimulation of the ChR2-expressing neurons. A, Representative cardiovascular response to a 30 s exposure of the RTN region to 473 nm, 20 Hz, 10 ms light pulses (transcerebellar optical fiber method). Top trace, Raw splanchnic sympathetic nerve discharge; middle trace, iSND (for units and calibration, see Materials and Methods); bottom trace, mean femoral arterial pressure (MAP). The drawing illustrates how the increase in SND amplitude was normalized across photostimulation episodes and rats. B, Averaged normalized cardiovascular responses to blue light photostimulation (SND and BP) before administration of the arteriolar vasodilator hydralazine. To generate these curves, a single curve was generated per rat by averaging up to six individual normalized responses using the onset of the photostimulation as a trigger. In a second step, the resulting curves were averaged across the five rats to produce the grand averages shown in this panel. C, Sympathetic nerve response before and after lowering BP with an intravenous injection of the vasodilator hydralazine (given at arrow during the 5 min break in the record) to eliminate the influence of the baroreflex on SND. D, Averaged normalized sympathetic nerve response to photostimulation before and after administration of hydralazine. In the presence of this agent, SND was maintained or further increased during the course of the stimulus indicating the absence of a baroreflex. The absence of the baroreflex also accounts for the loss of the undershoot present immediately after the end of the stimulus in the absence of hydralazine. In the presence of hydralazine, SND recovered to the baseline level within a few seconds after the end of the photostimulation.
Brainstem projections of ChR2-expressing noncatecholaminergic RTN neurons
The ChR2-mCherry protein is transported very effectively to the axons and axonal varicosities. We took advantage of this feature to determine the projections of the labeled RTN neurons. We selected for analysis 3 of the C1-lesion cases in which the ratio between mCherry labeled noncatecholaminergic and C1 neurons was especially favorable (9:1; 5:1, and 4:1). The general pattern of axonal projections was very similar in each case and is illustrated in the case of the animal with a 9:1 ratio favoring the noncatecholaminergic RTN neurons (Fig. 9). The injection site is shown in Figure 9A. The axonal projections were mostly ipsilateral and were restricted to the pontomedullary regions that contain the central respiratory pattern generator (Alheid and McCrimmon, 2008), namely, the entire ventrolateral medulla (Fig. 9B–D), the respiratory-related regions of the nucleus of the solitary tract, namely, the lateral and ventrolateral nucleus, and to a small extent the commissural nucleus (Fig. 9B,C,E). The axons ascended in an approximately transverse plane from the RTN toward the dorsomedial tegmentum in which axonal branches were found throughout the length of the medulla oblongata (Fig. 9A–D, arrows). Finally, a dense terminal field was present in the dorsolateral pons, especially in the Kölliker–Fuse nucleus and the lateral parabrachial region (Fig. 9F). In this animal, the locus ceruleus and the midline raphe, which receive heavy projections from the C1 neurons (Card et al., 2006), were not labeled, confirming that very few of these catecholaminergic neurons had been transfected. A light axonal projection to the midline raphe was observed in the case with the least favorable noncatecholaminergic/catecholaminergic cell ratio, suggesting that this projection does indeed originate from the C1 neurons and not from the putative chemoreceptor neurons. The projections to the ventrolateral medulla included every segment of the ventral respiratory column and were clearly not limited to the region of the pre-Bötzinger complex, which is currently presumed to harbor the core of the inspiratory rhythm generating network (Feldman and Del Negro, 2006).
Figure 9.
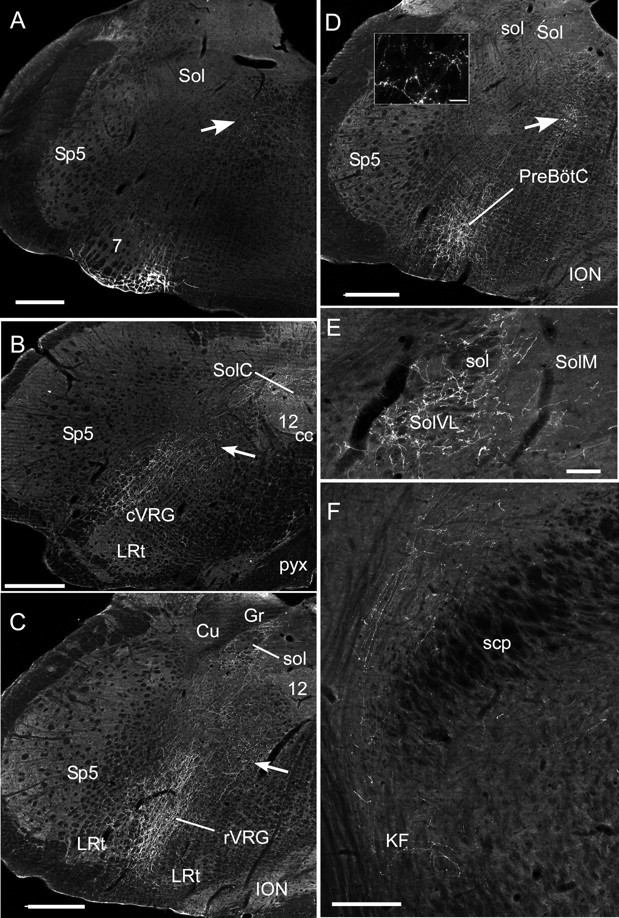
Anatomical projections of the RTN neurons. A, Injection site of PRSX8-ChR2-mCherry lentivirus in the ventrolateral medulla in a rat treated by anti-DBH-saporin to reduce the number of TH neurons that reside in the RTN region. Note that mCherry fluorescence is confined to neurons located just ventral and medial to the facial motor nucleus (7). The arrows in A–D point to transversely cut axons emanating from the labeled neurons. Sp5, Spinal trigeminal nucleus; Sol, nucleus of the solitary tract. Scale bar: A–D, 500 μm. B, Projections to the caudal medulla are confined to the cVRG (caudal ventral respiratory group), the nucleus of the solitary tract, and the region between these areas. 12, Hypoglossal nucleus; cc, central canal; LRt, lateral reticular nucleus; pyx, decussation of the pyramidal tract; SolC, commissural subnucleus of the solitary tract nucleus. Other abbreviations are as in A. C, Projection to the rostral ventral respiratory group (rVRG). Cu, Cuneate nucleus; Gr, gracile nucleus; ION, inferior olivary nucleus; sol, solitary tract. Other abbreviations are as in A and B. The lateral portion of the nucleus of the solitary tract is also heavily innervated. D, Heavy projections to the Pre-Bötzinger complex (PreBötC). The inset illustrates labeled boutons observed in the PreBötC. Scale bar: inset, 25 μm. Abbreviations are as above. E, Projections to the caudal portion of the solitary tract nucleus. Note that most of the boutons are in the interstitial and ventrolateral portions of the nucleus (SolVL) in which respiratory-related neurons reside. Scale bar, 100 μm. SolM, Medial subnucleus of Sol. Other abbreviations are as above. F, Projections to the parabrachial nucleus and Kölliker–Fuse (KF) nucleus. scp, Superior cerebellar peduncle. Scale bar, 250 μm.
Discussion
Selective photostimulation of a population of rostral medullary Phox2b-expressing noncatecholaminergic neurons that are activated by hypercapnia in vivo and by acidification in slices produces a long-lasting activation of the inspiratory motor outflow in vivo. These particular neurons innervate selectively the pontomedullary regions that harbor the respiratory pattern generator. We conclude that these neurons have the anatomical and physiological properties expected of central respiratory chemoreceptors.
Selectivity of transgene expression after injection of PRSx8-ChR2-mCherry lentivirus into the RTN region
After virus injection into the RTN region, the ChR2-mCherry fusion protein was detected overwhelmingly in Phox2b-expressing neurons (>94%). Most transfected neurons were noncatecholaminergic and noncholinergic and therefore belonged to a cell group that is strongly activated by hypercapnia in vivo and by acidification in vitro (Mulkey et al., 2004, 2007; Stornetta et al., 2006; Onimaru et al., 2008). Importantly, no ChR2-mCherry-positive neuron was detected within the more caudal regions of the ventrolateral medulla that contain the respiratory pattern generator (Rybak et al., 2004; Alheid and McCrimmon, 2008) nor in the immediately overlying facial motor nucleus (Figs. 1A, 9A).
Approximately 40% of the ChR2-expressing neurons were C1 neurons consistent with the known ability of PRSx8 to drive transgene expression in brainstem catecholaminergic neurons (Card et al., 2006; Duale et al., 2007). We also confirm that PRSx8-containing lentiviral vectors cause transgene expression in small subsets of cholinergic neurons, probably autonomic preganglionic neurons (Card et al., 2006; Duale et al., 2007).
Injection of PRSx8-containing lentivirus into the solitary tract nucleus produces transgene expression almost exclusively in catecholaminergic neurons (Duale et al., 2007), although this structure contains vastly larger numbers of noncatecholaminergic Phox2b-expressing neurons (Stornetta et al., 2006). Therefore, Phox2 proteins appear necessary but not sufficient for efficient transgene expression by PRSx8-based lentiviral vectors.
The cardiorespiratory effects produced by photostimulation of the ventrolateral medulla are mediated by ChR2 activation
This interpretation derives from the following evidence: ChR2 was only expressed by neurons; pulsed laser light produced no effect when directed to areas that did not contain ChR2-expressing neurons; RTN photostimulation was ineffective in rats in which the same neurons expressed a light-insensitive transgene, the allatostatin receptor (Tan et al., 2006); the physiological response to photostimulation was reproducible over time; and, finally, the region that contained the transfected neurons lacked histological evidence of heat-induced coagulation. In brief, our results confirm that ChR2-expressing neurons can be reliably and selectively activated by photostimulation in vivo (Adamantidis et al., 2007).
The noncatecholaminergic noncholinergic Phox2b-expressing neurons of the RTN innervate selectively the central respiratory rhythm/pattern generator
Using conventional tract-tracing methodology, we showed previously that the RTN region innervates predominantly the ventrolateral medulla, the dorsolateral pons, and selected lateral and caudal subregions of the solitary tract nucleus (Rosin et al., 2006). In rats with depleted C1 neurons, the terminal fields that originated from ChR2-mCherry-positive neurons were restricted to the above list of structures. Thus, unlike other putative central chemoreceptors (locus ceruleus, serotonergic system), RTN neurons target selectively the regions that contain the core components of the central respiratory pattern generator (Rybak et al., 2007; Alheid and McCrimmon, 2008) including the rhythm-regulating pre-Bötzinger complex and areas that regulate the amplitude and timing of inspiratory and expiratory motor activities (Chamberlin and Saper, 1994; Chamberlin, 2004; Rybak et al., 2007; Alheid and McCrimmon, 2008).
The breathing response is attributable to photoactivation of the noncatecholaminergic noncholinergic Phox2b-expressing neurons
Photostimulation of the ChR2-expressing neurons activated the PND and raised blood pressure and sympathetic nerve activity. The few transfected cholinergic neurons (∼13 per rat) could not have contributed to these cardiorespiratory effects because no known connection exists between these neurons and the diaphragm or sympathetic vasomotor efferents. The cardiovascular component of the response must have resulted from the activation of ChR2-transfected C1 neurons because it was absent in rats treated with anti-DBH-saporin in which 60% fewer such neurons expressed ChR2. This interpretation agrees with the widely accepted notion that the C1 neurons drive the sympathetic tone to the heart and blood vessels (Guyenet, 2006).
By exclusion, the noncholinergic, noncatecholaminergic, and Phox2b-expressing neurons must have been the neurons responsible for the light-induced increase in PND. This interpretation agrees with the following additional evidence. As mentioned above, this cell type targets selectively the regions that contain the respiratory network. Second, photostimulation activated the CO2-sensitive RTN neurons, which are noncholinergic, noncatecholaminergic, and express Phox2b (Stornetta et al., 2006). Finally, the pulse-by-pulse entrainment found in four of the CO2-sensitive RTN neurons is a hallmark of the direct photoactivation of ChR2-transfected neurons by laser light (Adamantidis et al., 2007; Arenkiel et al., 2007; Gradinaru et al., 2007). Consistent with this interpretation, we did not observe pulse-by-pulse entrainment of the Bötzinger region respiratory neurons. These neurons did not contain ChR2 and their activation was presumably related to the generalized stimulation of the central respiratory network elicited by photostimulation of the RTN neurons.
The noncatecholaminergic Phox2b-expressing neurons of the RTN region are central respiratory chemoreceptors
The noncatecholaminergic Phox2b-expressing cells of the RTN have all the properties expected of central respiratory chemoreceptors (i.e., neurons that encode changes in brain pH to regulate breathing) (Feldman et al., 2003; Richerson et al., 2005; Guyenet et al., 2008). They are strongly activated by increasing arterial PCO2 in vivo, including under conditions of partial synaptic blockade, they are activated by acidification in slices under conditions of reduced or absent synaptic activity (Mulkey et al., 2004; Mulkey et al., 2007; Guyenet, 2008). Finally, as shown here, their activation in vivo produces a brisk stimulation of breathing.
All existing models assume that the phasically active respiratory neurons that generate the respiratory rhythm and the various respiratory outflows require tonic excitatory drives to be active (Bainton and Kirkwood, 1979; Duffin, 2004; Rybak et al., 2004). The most powerful of these tonic drives is presumed to be CO2/pH-regulated and to originate from the carotid bodies and a defined set of pH-sensitive CNS neurons called central respiratory chemoreceptors (Bainton and Kirkwood, 1979; Duffin, 2004; Rybak et al., 2004; Smith et al., 2006). Because RTN neurons are respiratory modulated to various degrees (Nattie et al., 1993; Guyenet et al., 2005; Moreira et al., 2007), these cells could only be a source of “tonic” drive to the pattern generating neurons if they signal via a postsynaptic mechanism that has a long half-life relative to the respiratory cycle duration (∼1 s in rats). The very slow relaxation of the breathing rate and amplitude (t1/2 = 11 s) that follows photostimulation of ChR2-expressing RTN neurons suggests that these neurons may conform to such a model. Because the cardiovascular autonomic response to photostimulation of the RTN region disappears within seconds, the long-lasting effect on breathing cannot be explained by arousal. Finally, the slow relaxation of the respiratory response must be attributable to the activation of the noncatecholaminergic neurons of the RTN because the response kinetics were unaffected by reducing the number of ChR2-expressing C1 neurons. The slow exponential decay of the respiratory response to RTN stimulation is reminiscent of the respiratory “after-discharge” (Eldridge, 1974; Eldridge et al., 1981; Millhorn et al., 1981). This after-discharge is unaffected by reducing serotonin, catecholaminergic or opioid transmission (Millhorn et al., 1981), and could therefore be mediated by the CO2-activated RTN neurons, which release none of these transmitters (Guyenet, 2008). Additionally, the after-discharge is greatly reduced at high levels of arterial PCO2 (Eldridge et al., 1981), as is the effect of RTN photostimulation. Finally, the after-discharge can be caused by carotid nerve stimulation, a procedure that excites RTN neurons vigorously (Eldridge, 1974; Takakura et al., 2006).
As observed with other neurons (Adamantidis et al., 2007; Arenkiel et al., 2007; Gradinaru et al., 2007), the activation of ChR2-transfected RTN neurons did not outlast the period of photostimulation (Fig. 5). The respiratory after-discharge elicited by stimulating RTN neurons must therefore be a property of the downstream respiratory circuitry. One possible explanation is that the postsynaptic signaling mechanism triggered by RTN neurons has a long time constant (11 s). Since RTN neurons are glutamatergic (Mulkey et al., 2004, 2007; Stornetta et al., 2006), this slow process could be mediated by group I metabotropic glutamatergic receptors (Pace et al., 2007).
In unanesthetized rodents, central chemoreceptor stimulation increases both the frequency and the amplitude of breathing (Coles et al., 2002; Oikawa et al., 2005; Hodges et al., 2008). In anesthetized subjects, breathing frequency increases variably depending on the species and the anesthetic (Eldridge et al., 1984; Song and Poon, 2009). In our model, as in many others (Simms et al., 2009), PND amplitude and frequency increase very steeply when brain CO2 is elevated and they reach maximum values after a relatively small increment of end-expiratory CO2 beyond the apneic threshold (Fig. 3). In other words, the sensitivity of the chemoreflex measured as the increase in PND in response to a given increment of CO2 is maximal close to the apneic threshold and rapidly decays to zero with additional increases in CO2. RTN stimulation likewise produced its maximum effect close to the apneic threshold, consistent with the possibility that, in our preparation, CO2 activates breathing by stimulating RTN neurons.
Each side of the brain contains ∼1000 RTN neurons (Takakura et al., 2008). The subset that was photostimulated in the present experiments may not be perfectly representative of this neuronal group. For example, the RTN region of the neonate allegedly regulates primarily the respiratory rhythm (Onimaru and Homma, 2003), whereas rostral portions of the adult RTN (level of approximately bregma 10.5 mm) may control primarily breathing amplitude (Li et al., 1999), possibly via preferential activation of expiratory muscles (Janczewski and Feldman, 2006). These seemingly divergent results suggest that subsets of RTN neurons may control the respiratory rate and differentially regulate the various respiratory motor outflows.
In conclusion, the noncatecholaminergic Phox2b-expressing neurons of the RTN region have the properties expected from central respiratory chemoreceptors. These cells appear to conform to the simplest conceivable model, namely, a group of glutamatergic neurons that are activated by acidification and cause a powerful and long-lasting activation of the central respiratory pattern generator.
Footnotes
This work was supported by National Institutes of Health Grants HL74011 and HL28785 (P.G.G.).
References
- Adamantidis AR, Zhang F, Aravanis AM, Deisseroth K, de Lecea L. Neural substrates of awakening probed with optogenetic control of hypocretin neurons. Nature. 2007;450:420–424. doi: 10.1038/nature06310. [DOI] [PMC free article] [PubMed] [Google Scholar]
- Alheid GF, McCrimmon DR. The chemical neuroanatomy of breathing. Respir Physiol Neurobiol. 2008;164:3–11. doi: 10.1016/j.resp.2008.07.014. [DOI] [PMC free article] [PubMed] [Google Scholar]
- Arenkiel BR, Peca J, Davison IG, Feliciano C, Deisseroth K, Augustine GJ, Ehlers MD, Feng G. In vivo light-induced activation of neural circuitry in transgenic mice expressing channelrhodopsin-2. Neuron. 2007;54:205–218. doi: 10.1016/j.neuron.2007.03.005. [DOI] [PMC free article] [PubMed] [Google Scholar]
- Bainton CR, Kirkwood PA. The effect of carbon dioxide on the tonic and the rhythmic discharges of expiratory bulbospinal neurones. J Physiol. 1979;296:291–314. doi: 10.1113/jphysiol.1979.sp013006. [DOI] [PMC free article] [PubMed] [Google Scholar]
- Boyden ES, Zhang F, Bamberg E, Nagel G, Deisseroth K. Millisecond-timescale, genetically targeted optical control of neural activity. Nat Neurosci. 2005;8:1263–1268. doi: 10.1038/nn1525. [DOI] [PubMed] [Google Scholar]
- Card JP, Sved JC, Craig B, Raizada M, Vazquez J, Sved AF. Efferent projections of rat rostroventrolateral medulla C1 catecholamine neurons: implications for the central control of cardiovascular regulation. J Comp Neurol. 2006;499:840–859. doi: 10.1002/cne.21140. [DOI] [PubMed] [Google Scholar]
- Chamberlin NL. Functional organization of the parabrachial complex and intertrigeminal region in the control of breathing. Respir Physiol Neurobiol. 2004;143:115–125. doi: 10.1016/j.resp.2004.03.015. [DOI] [PubMed] [Google Scholar]
- Chamberlin NL, Saper CB. Topographic organization of respiratory responses to glutamate microstimulation of the parabrachial nucleus in the rat. J Neurosci. 1994;14:6500–6510. doi: 10.1523/JNEUROSCI.14-11-06500.1994. [DOI] [PMC free article] [PubMed] [Google Scholar]
- Coles SK, Miller R, Huela J, Wolken P, Schlenker E. Frequency responses to hypoxia and hypercapnia in carotid body-denervated conscious rats. Respir Physiol Neurobiol. 2002;130:113–120. doi: 10.1016/s0034-5687(02)00005-1. [DOI] [PubMed] [Google Scholar]
- Cream C, Nattie E, Li A. TRH microdialysis into the RTN of the conscious rat increases breathing, metabolism, and temperature. J Appl Physiol. 1999;87:673–682. doi: 10.1152/jappl.1999.87.2.673. [DOI] [PubMed] [Google Scholar]
- Cream C, Li A, Nattie E. The retrotrapezoid nucleus (RTN): local cytoarchitecture and afferent connections. Respir Physiol Neurobiol. 2002;130:121–137. doi: 10.1016/s0034-5687(01)00338-3. [DOI] [PubMed] [Google Scholar]
- Duale H, Waki H, Howorth P, Kasparov S, Teschemacher AG, Paton JF. Restraining influence of A2 neurons in chronic control of arterial pressure in spontaneously hypertensive rats. Cardiovasc Res. 2007;76:184–193. doi: 10.1016/j.cardiores.2007.06.018. [DOI] [PubMed] [Google Scholar]
- Dubreuil V, Ramanantsoa N, Trochet D, Vaubourg V, Amiel J, Gallego J, Brunet JF, Goridis C. A human mutation in Phox2b causes lack of CO2 chemosensitivity, fatal central apnea, and specific loss of parafacial neurons. Proc Natl Acad Sci U S A. 2008;105:1067–1072. doi: 10.1073/pnas.0709115105. [DOI] [PMC free article] [PubMed] [Google Scholar]
- Duffin J. Functional organization of respiratory neurones: a brief review of current questions and speculations. Exp Physiol. 2004;89:517–529. doi: 10.1113/expphysiol.2004.028027. [DOI] [PubMed] [Google Scholar]
- Eldridge FL. Central neural respiratory stimulatory effect of active respiration. J Appl Physiol. 1974;37:723–735. doi: 10.1152/jappl.1974.37.5.723. [DOI] [PubMed] [Google Scholar]
- Eldridge FL, Gill-Kumar P, Millhorn DE. Input-output relationships of central neural circuits involved in respiration in cats. J Physiol. 1981;311:81–95. doi: 10.1113/jphysiol.1981.sp013574. [DOI] [PMC free article] [PubMed] [Google Scholar]
- Eldridge FL, Kiley JP, Millhorn DE. Respiratory effects of carbon dioxide-induced changes of medullary extracellular fluid pH in cats. J Physiol. 1984;355:177–189. doi: 10.1113/jphysiol.1984.sp015413. [DOI] [PMC free article] [PubMed] [Google Scholar]
- Feldman JL, Del Negro CA. Looking for inspiration: new perspectives on respiratory rhythm. Nat Rev Neurosci. 2006;7:232–242. doi: 10.1038/nrn1871. [DOI] [PMC free article] [PubMed] [Google Scholar]
- Feldman JL, Mitchell GS, Nattie EE. Breathing: rhythmicity, plasticity, chemosensitivity. Annu Rev Neurosci. 2003;26:239–266. doi: 10.1146/annurev.neuro.26.041002.131103. [DOI] [PMC free article] [PubMed] [Google Scholar]
- Gradinaru V, Thompson KR, Zhang F, Mogri M, Kay K, Schneider MB, Deisseroth K. Targeting and readout strategies for fast optical neural control in vitro and in vivo. J Neurosci. 2007;27:14231–14238. doi: 10.1523/JNEUROSCI.3578-07.2007. [DOI] [PMC free article] [PubMed] [Google Scholar]
- Guyenet PG. The sympathetic control of blood pressure. Nat Rev Neurosci. 2006;7:335–346. doi: 10.1038/nrn1902. [DOI] [PubMed] [Google Scholar]
- Guyenet PG. The 2008 Carl Ludwig Lecture: retrotrapezoid nucleus, CO2 homeostasis, and breathing automaticity. J Appl Physiol. 2008;105:404–416. doi: 10.1152/japplphysiol.90452.2008. [DOI] [PMC free article] [PubMed] [Google Scholar]
- Guyenet PG, Mulkey DK, Stornetta RL, Bayliss DA. Regulation of ventral surface chemoreceptors by the central respiratory pattern generator. J Neurosci. 2005;25:8938–8947. doi: 10.1523/JNEUROSCI.2415-05.2005. [DOI] [PMC free article] [PubMed] [Google Scholar]
- Guyenet PG, Stornetta RL, Bayliss DA. Retrotrapezoid nucleus and central chemoreception. J Physiol. 2008;586:2043–2048. doi: 10.1113/jphysiol.2008.150870. [DOI] [PMC free article] [PubMed] [Google Scholar]
- Hodges MR, Tattersall GJ, Harris MB, McEvoy SD, Richerson DN, Deneris ES, Johnson RL, Chen ZF, Richerson GB. Defects in breathing and thermoregulation in mice with near-complete absence of central serotonin neurons. J Neurosci. 2008;28:2495–2505. doi: 10.1523/JNEUROSCI.4729-07.2008. [DOI] [PMC free article] [PubMed] [Google Scholar]
- Hwang DY, Carlezon WA, Jr, Isacson O, Kim KS. A high-efficiency synthetic promoter that drives transgene expression selectively in noradrenergic neurons. Hum Gene Ther. 2001;12:1731–1740. doi: 10.1089/104303401750476230. [DOI] [PubMed] [Google Scholar]
- Janczewski WA, Feldman JL. Distinct rhythm generators for inspiration and expiration in the juvenile rat. J Physiol. 2006;570:407–420. doi: 10.1113/jphysiol.2005.098848. [DOI] [PMC free article] [PubMed] [Google Scholar]
- Kang BJ, Chang DA, Mackay DD, West GH, Moreira TS, Takakura AC, Gwilt JM, Guyenet PG, Stornetta RL. Central nervous system distribution of the transcription factor Phox2b in the adult rat. J Comp Neurol. 2007;503:627–641. doi: 10.1002/cne.21409. [DOI] [PubMed] [Google Scholar]
- Li A, Nattie E. CO2 dialysis in one chemoreceptor site, the RTN: stimulus intensity and sensitivity in the awake rat. Respir Physiol Neurobiol. 2002;133:11–22. doi: 10.1016/s1569-9048(02)00134-9. [DOI] [PubMed] [Google Scholar]
- Li A, Randall M, Nattie EE. CO2 microdialysis in retrotrapezoid nucleus of the rat increases breathing in wakefulness but not in sleep. J Appl Physiol. 1999;87:910–919. doi: 10.1152/jappl.1999.87.3.910. [DOI] [PubMed] [Google Scholar]
- Millhorn DE, Eldridge FL, Waldrop TG. Pharmacologic study of respiratory afterdischarge. J Appl Physiol. 1981;50:239–244. doi: 10.1152/jappl.1981.50.2.239. [DOI] [PubMed] [Google Scholar]
- Moreira TS, Takakura AC, Colombari E, West GH, Guyenet PG. Inhibitory input from slowly adapting lung stretch receptors to retrotrapezoid nucleus chemoreceptors. J Physiol. 2007;580:285–300. doi: 10.1113/jphysiol.2006.125336. [DOI] [PMC free article] [PubMed] [Google Scholar]
- Mulkey DK, Stornetta RL, Weston MC, Simmons JR, Parker A, Bayliss DA, Guyenet PG. Respiratory control by ventral surface chemoreceptor neurons in rats. Nat Neurosci. 2004;7:1360–1369. doi: 10.1038/nn1357. [DOI] [PubMed] [Google Scholar]
- Mulkey DK, Talley EM, Stornetta RL, Siegel AR, West GH, Chen X, Sen N, Mistry AM, Guyenet PG, Bayliss DA. TASK channels determine pH sensitivity in select respiratory neurons but do not contribute to central respiratory chemosensitivity. J Neurosci. 2007;27:14049–14058. doi: 10.1523/JNEUROSCI.4254-07.2007. [DOI] [PMC free article] [PubMed] [Google Scholar]
- Nagel G, Szellas T, Huhn W, Kateriya S, Adeishvili N, Berthold P, Ollig D, Hegemann P, Bamberg E. Channelrhodopsin-2, a directly light-gated cation-selective membrane channel. Proc Natl Acad Sci U S A. 2003;100:13940–13945. doi: 10.1073/pnas.1936192100. [DOI] [PMC free article] [PubMed] [Google Scholar]
- Nattie E, Shi J, Li A. Bicuculline dialysis in the retrotrapezoid nucleus (RTN) region stimulates breathing in the awake rat. Resp Physiol. 2001;124:179–193. doi: 10.1016/s0034-5687(00)00212-7. [DOI] [PubMed] [Google Scholar]
- Nattie EE, Fung ML, Li A, St John WM. Responses of respiratory modulated and tonic units in the retrotrapezoid nucleus to CO2. Resp Physiol. 1993;94:35–50. doi: 10.1016/0034-5687(93)90055-f. [DOI] [PubMed] [Google Scholar]
- Oikawa S, Hirakawa H, Kusakabe T, Nakashima Y, Hayashida Y. Autonomic cardiovascular responses to hypercapnia in conscious rats: the roles of the chemo- and baroreceptors. Auton Neurosci. 2005;117:105–114. doi: 10.1016/j.autneu.2004.11.009. [DOI] [PubMed] [Google Scholar]
- Onimaru H, Homma I. A novel functional neuron group for respiratory rhythm generation in the ventral medulla. J Neurosci. 2003;23:1478–1486. doi: 10.1523/JNEUROSCI.23-04-01478.2003. [DOI] [PMC free article] [PubMed] [Google Scholar]
- Onimaru H, Ikeda K, Kawakami K. CO2-sensitive preinspiratory neurons of the parafacial respiratory group express Phox2b in the neonatal rat. J Neurosci. 2008;28:12845–12850. doi: 10.1523/JNEUROSCI.3625-08.2008. [DOI] [PMC free article] [PubMed] [Google Scholar]
- Pace RW, Mackay DD, Feldman JL, Del Negro CA. Inspiratory bursts in the preBotzinger complex depend on a calcium-activated non-specific cation current linked to glutamate receptors in neonatal mice. J Physiol. 2007;582:113–125. doi: 10.1113/jphysiol.2007.133660. [DOI] [PMC free article] [PubMed] [Google Scholar]
- Pagliardini S, Ren J, Gray PA, Vandunk C, Gross M, Goulding M, Greer JJ. Central respiratory rhythmogenesis is abnormal in lbx1-deficient mice. J Neurosci. 2008;28:11030–11041. doi: 10.1523/JNEUROSCI.1648-08.2008. [DOI] [PMC free article] [PubMed] [Google Scholar]
- Paxinos G, Watson C. The rat brain in stereotaxic coordinates. San Diego: Elsevier Academic; 2005. [Google Scholar]
- Richerson GB, Wang W, Hodges MR, Dohle CI, Diez-Sampedro A. Homing in on the specific phenotype(s) of central respiratory chemoreceptors. Exp Physiol. 2005;90:259–266. doi: 10.1113/expphysiol.2005.029843. discussion 266–269. [DOI] [PubMed] [Google Scholar]
- Rosin DL, Chang DA, Guyenet PG. Afferent and efferent connections of the rat retrotrapezoid nucleus. J Comp Neurol. 2006;499:64–89. doi: 10.1002/cne.21105. [DOI] [PubMed] [Google Scholar]
- Rybak IA, Shevtsova NA, Paton JF, Dick TE, St-John WM, Mörschel M, Dutschmann M. Modeling the ponto-medullary respiratory network. Respir Physiol Neurobiol. 2004;143:307–319. doi: 10.1016/j.resp.2004.03.020. [DOI] [PubMed] [Google Scholar]
- Rybak IA, Abdala AP, Markin SN, Paton JF, Smith JC. Spatial organization and state-dependent mechanisms for respiratory rhythm and pattern generation. Prog Brain Res. 2007;165:201–220. doi: 10.1016/S0079-6123(06)65013-9. [DOI] [PMC free article] [PubMed] [Google Scholar]
- Schreihofer AM, Stornetta RL, Guyenet PG. Regulation of sympathetic tone and arterial pressure by rostral ventrolateral medulla after depletion of C1 cells in rat. J Physiol. 2000:221–236. doi: 10.1111/j.1469-7793.2000.00221.x. [DOI] [PMC free article] [PubMed] [Google Scholar]
- Sena-Esteves M, Tebbets JC, Steffens S, Crombleholme T, Flake AW. Optimized large-scale production of high titer lentivirus vector pseudotypes. J Virol Methods. 2004;122:131–139. doi: 10.1016/j.jviromet.2004.08.017. [DOI] [PubMed] [Google Scholar]
- Simms AE, Paton JF, Pickering AE, Allen AM. Amplified respiratory-sympathetic coupling in the spontaneously hypertensive rat: does it contribute to hypertension? J Physiol. 2009;587:597–610. doi: 10.1113/jphysiol.2008.165902. [DOI] [PMC free article] [PubMed] [Google Scholar]
- Smith CA, Rodman JR, Chenuel BJ, Henderson KS, Dempsey JA. Response time and sensitivity of the ventilatory response to CO2 in unanesthetized intact dogs: central vs. peripheral chemoreceptors. J Appl Physiol. 2006;100:13–19. doi: 10.1152/japplphysiol.00926.2005. [DOI] [PubMed] [Google Scholar]
- Smith JC, Morrison DE, Ellenberger HH, Otto MR, Feldman JL. Brainstem projections to the major respiratory neuron populations in the medulla of the cat. J Comp Neurol. 1989;281:69–96. doi: 10.1002/cne.902810107. [DOI] [PubMed] [Google Scholar]
- Song G, Poon CS. Lateral parabrachial nucleus mediates shortening of expiration and increase of inspiratory drive during hypercapnia. Respir Physiol Neurobiol. 2009;165:9–12. doi: 10.1016/j.resp.2008.10.009. [DOI] [PMC free article] [PubMed] [Google Scholar]
- Stornetta RL, Sevigny CP, Guyenet PG. Vesicular glutamate transporter DNPI/VGLUT2 mRNA is present in C1 and several other groups of brainstem catecholaminergic neurons. J Comp Neurol. 2002;444:191–206. doi: 10.1002/cne.10141. [DOI] [PubMed] [Google Scholar]
- Stornetta RL, Moreira TS, Takakura AC, Kang BJ, Chang DA, West GH, Brunet JF, Mulkey DK, Bayliss DA, Guyenet PG. Expression of Phox2b by brainstem neurons involved in chemosensory integration in the adult rat. J Neurosci. 2006;26:10305–10314. doi: 10.1523/JNEUROSCI.2917-06.2006. [DOI] [PMC free article] [PubMed] [Google Scholar]
- Takakura AC, Moreira TS, Colombari E, West GH, Stornetta RL, Guyenet PG. Peripheral chemoreceptor inputs to retrotrapezoid nucleus (RTN) CO2-sensitive neurons in rats. J Physiol. 2006;572:503–523. doi: 10.1113/jphysiol.2005.103788. [DOI] [PMC free article] [PubMed] [Google Scholar]
- Takakura AC, Moreira TS, Stornetta RL, West GH, Gwilt JM, Guyenet PG. Selective lesion of retrotrapezoid Phox2b-expressing neurons raises the apnoeic threshold in rats. J Physiol. 2008;586:2975–2991. doi: 10.1113/jphysiol.2008.153163. [DOI] [PMC free article] [PubMed] [Google Scholar]
- Tan EM, Yamaguchi Y, Horwitz GD, Gosgnach S, Lein ES, Goulding M, Albright TD, Callaway EM. Selective and quickly reversible inactivation of mammalian neurons in vivo using the Drosophila allatostatin receptor. Neuron. 2006;51:157–170. doi: 10.1016/j.neuron.2006.06.018. [DOI] [PubMed] [Google Scholar]
- Wiley RG, Kline RH., IV Neuronal lesioning with axonally transported toxins. J Neurosci Methods. 2000;103:73–82. doi: 10.1016/s0165-0270(00)00297-1. [DOI] [PubMed] [Google Scholar]