Abstract
Atherosclerotic lesions are non-uniformly distributed at arterial bends and branch sites, suggesting an important role for haemodynamic factors, particularly wall shear stress (WSS), in their development. The pattern of lesions at aortic branch sites depends on age and species. Using computational flow simulations in an idealized model of an intercostal artery emerging perpendicularly from the thoracic aorta, we studied the effects of Reynolds number and flow division under steady conditions. Patterns of flow and WSS were strikingly dependent on these haemodynamic parameters. With increasing Reynolds number, WSS, normalized by the fully developed aortic value, was lowered at the sides of the ostium and increased upstream and downstream of it. Increasing flow into the side branch exacerbated these patterns and gave rise to a reversing flow region downstream of the ostium. Incorporation of more realistic geometric features had only minor effects and patterns of mean WSS under pulsatile conditions were similar to the steady flow results. Aspects of the observed WSS patterns correlate with, and may explain, some but not all of the lesion patterns in human, rabbit and mouse aortas.
Keywords: haemodynamics, atherosclerosis, wall shear stress, arterial branches, aorta
1. Introduction
Atherosclerosis, the disease underlying most heart attacks and strokes, is characterized by the focal accumulation of lipid, cells and connective tissue components within the arterial wall. The non-uniform distribution of these lesions in areas of branching and curvature is consistent with a controlling influence of stresses imposed on the wall by the flow of blood. The current consensus is that lesions occur most frequently in regions of low and fluctuating haemodynamic wall shear stress (WSS). However, there are differences in the distribution of lesions between species, and between ages within a species, that challenge this consensus. Here we report an investigation of whether the pattern of WSS is sensitive to factors such as Reynolds number (Re) and flow division and hence could vary with species and age, or whether it is invariant, implying that the consensus may not apply to all the observed lesion distributions.
Differences in the distribution of lesions between species and ages have been most completely documented for the origins of intercostal arteries within the descending thoracic aorta (Weinberg 2002). In human foetuses, neonates and infants, fatty streaks occur around the downstream margins of these branch ostia (Sinzinger et al. 1980). At later ages, however, they occur at the lateral and then the upstream margins (Sloop et al. 1998), while advanced disease tends to completely surround the ostium (Mitchell & Schwartz 1965). Spontaneous and diet-induced lesions in immature and mature rabbits show the first two patterns (Barnes & Weinberg 1998, 1999) whereas lesions completely surround intercostal ostia regardless of age in knockout mice lacking the low-density lipoprotein receptor and apolipoprotein E (McGillicuddy et al. 2001).
Numerous previous studies using analytical techniques, physical models or computational methods have investigated patterns of flow or WSS in the vicinity of arterial branch points. More recently, allometric studies have examined variations in WSS between species, proposing various scaling laws (Greve et al. 2006; Cheng et al. 2007; Weinberg & Ethier 2007). However, only a few have systematically studied the effects on WSS of varying Re or flow division between parent and daughter vessel (Cheer et al. 1998) and we are not aware of any that have attempted to explain the age- and species-dependent differences in lesion pattern.
This study used high-order spectral/hp element methods (Karniadakis & Sherwin 2005) to compute flow fields and WSSs in the vicinity of model intercostal branch ostia using a range of these parameters. The range includes values appropriate for human subjects and for the smaller animals that are widely used as models of the human disease. For the majority of computations, a number of simplifying assumptions were made, most importantly that of steady flow, but the work nevertheless gives insight into the patterns of WSS to be expected in vivo, the flow fields that explain them, and the possibility that changes in these parameters might account for different patterns of disease.
2. Methods
2.1 Geometry
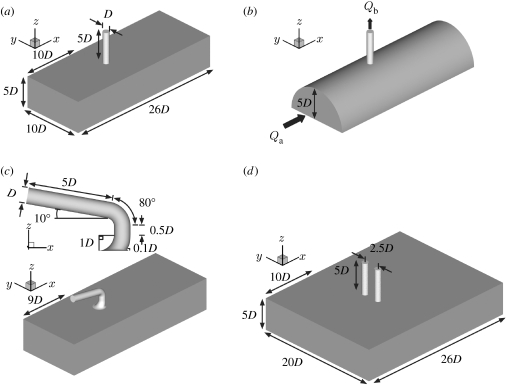
In people, rabbits and mice, intercostal arteries originate from the dorsal surface of the descending thoracic aorta in pairs. Effects of varying Re and flow division were first examined on a single branch and subsequently on a pair of branches. For most computations, the geometry of the single branch was approximated as a cylindrical tube, representing the intercostal artery, emerging perpendicularly from a flat surface, representing the dorsal wall of the descending thoracic aorta (figure 1a); similar models of intercostal branches have previously been used by Sobey (1977a,b) and Tutty (1988). The assumption of a flat aortic wall is justified because the diameter of the intercostal artery (Db) is substantially smaller than that of the thoracic aorta (Da). Based on previous estimates (Sobey 1977a,b; Pedley 1980; Tutty 1988) and in vivo measurements (Cornhill & Roach 1976; Caro et al. 1978; Nichols & O'Rourke 1998), Db : Da was assumed to equal 0.1.
Figure 1.
Computational domains representing intercostal arteries branching from the thoracic aorta: (a) simple model of one intercostal artery emerging perpendicularly from the thoracic aorta, (b) more realistic aortic geometry, (c) more realistic geometry of the aorto-intercostal junction, and (d) pair of branches at the same streamwise position. Dimensions in (b) and (c), other than those shown, are the same as in (a). The unit of length, D, is the diameter of the intercostal artery. The flow direction is shown in (b) and is the same for all models.
Taking Db (hereafter D) as the unit of length, a segment of aortic wall near the branch was approximated by a rectangular channel 26D long in the axial (x) direction, 10D wide in the crossflow (y) direction and 5D high in the z direction (figure 1a). The cylindrical tube representing the intercostal artery had length 5D. It was located on the longitudinal centreline of the aortic wall segment and its upstream lip was 10D from the upstream edge of the aortic segment.
In studies to assess the sensitivity of the solution to geometric assumptions, the width of the aortic channel was doubled and the sharp edge of the aorto-intercostal junction was replaced with a rounded lip with radius of curvature 0.1D. In a further study, the aorta was modelled as a half cylinder of 10D and the branch junction as the intersection of two perpendicular cylinders (figure 1b). Flow was also computed for a more realistic model (figure 1c) in which the inflow tract and flow divider had geometries approximating those seen in histological sections (e.g. Sebkhi & Weinberg 1994, 1996) and the side branch curved back towards the heart, as observed in corrosion casts (Abrahams 2001; B. A. Nier & P. D. Weinberg 2005, unpublished data). The aim was neither to reconstruct an actual branch nor to define an average geometry but to determine whether the patterns of WSS seen in the simpler model are likely also to apply to geometries of the broad type seen in vivo.
For the case of a pair of intercostal arteries, the width of the domain was again doubled to 20D and two cylindrical tubes of the radius and height used previously were symmetrically situated about the longitudinal centreline with a centre-to-centre separation of 2.5D and were (i) both positioned with their upstream lips 10D from the upstream edge of the domain (figure 1d) or (ii) staggered in the axial direction, their upstream lips being 10D and 11D from the upstream edge. The separation approximates the minimum observed in en face images of rabbit aortas fixed in situ at physiological pressure (A. R. Bond 2005, personal communication). Both unstaggered and staggered geometries were used since stagger tends to increase with distance down the aorta. In all cases, walls were assumed to be rigid.
2.2 Governing equations and boundary conditions
The flow was assumed to be governed by the Newtonian incompressible Navier–Stokes equations
where u=[u,v,w] is the velocity vector; ρ is the fluid density; p is the static pressure; and μ is the dynamic viscosity. The flow is characterized by the Reynolds number defined as , where is the average velocity of the fluid in the aorta of diameter Da=10D.
Since the near branch region was approximated as a channel rather than a pipe, the velocity profile imposed at the upstream end of the computational domain was assumed to be parabolic in the z direction. Furthermore, as the computational domain was defined over only half the aortic diameter, i.e. 5D, the peak of the parabolic velocity was imposed at the surface of the computational domain opposite to the aortic wall (the bottom plane of the computational domains shown in figure 1a,c,d). The only non-zero aortic inflow velocity component was therefore ua=ua(z), which in non-dimensional form can be written (assuming z=0 is the channel centreline) as
For the geometry of figure 1b, the fully developed pipe flow condition was considered, which in non-dimensional form can be expressed as
where ya0=5D.
The aortic flow rate, Qa, was defined as
where Aa is the full height channel inflow area 100D2. Clearly, if the aorta had been modelled as a pipe the cross-sectional area would have been and so the equivalent pipe flow rate is 80 per cent of that considered in the following.
The outflow velocity, wb(x, y), at the side branch (where ub=vb=0) can be written in non-dimensional form as
where is the side branch average velocity; Ab is the branch cross-sectional area; and x0=10.5D, y0=5D. Finally, the side branch pipe flow rate, Qb, is defined as
2.3 Computational methods
Non-proprietary software was used to create a hybrid mesh of body-conforming prismatic and unstructured tetrahedral elements (Peiró et al. 2002; Sherwin & Peiró 2002). A prismatic boundary-layer mesh was used at the wall to enhance the modelling of viscous flows (Papaharilaou et al. 2002); in all cases, it had a thickness of 0.3D. For the simple, single-branch geometry, a mesh of 452 prismatic and 2116 tetrahedral elements was generated. To test that this was sufficient, a mesh with 908 prismatic and 6536 tetrahedral elements was also created. The increase in the total number of mesh elements from 2568 to 7444 changed the streamwise force on the aortic wall by less than 0.01 per cent. The mesh for the more realistic geometry contained 25 391 elements (1950 prisms and 23 441 tetrahedra), while those for the staggered and unstaggered pairs of branches contained 13 446 (1668 prisms, 11 778 tetrahedra) and 13 523 (1664 prisms, 11 859 tetrahedra) elements, respectively. Finally, for the geometry of figure 1b a mesh of 7034 elements (902 prisms, 6132 tetrahedra) was used.
The solution was computed using a spectral/hp element method described by Karniadakis & Sherwin (2005). The code has previously been used in various applications (Sherwin et al. 2000; Giordana et al. 2005). An increase of the order of the polynomial expansion within each element from four to six produced an approximately 2 per cent decrease in the streamwise force. Hence, the computations were performed at a polynomial order of six, which for the main mesh of the simple geometry (figure 1a) corresponds to 266 336 local degrees of freedom per variable.
3. Results
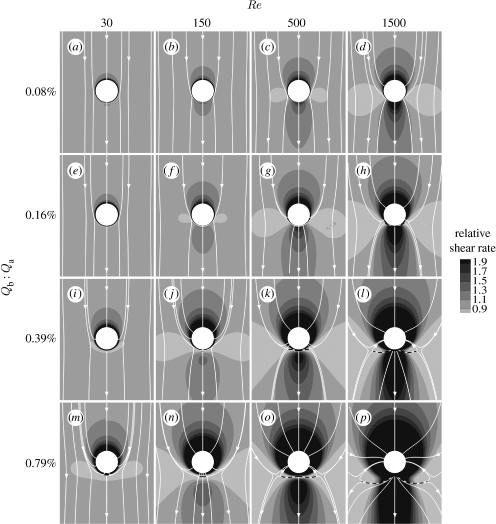
The main results of our study are summarized in figure 2, which shows aortic WSS magnitude around the ostium of the simple model for a range of Re and flow divisions (Qb : Qa). Surface streamlines indicating flow direction immediately above the wall are also shown. WSS was normalized by the inflow WSS (equivalent to the local shear rate relative to the inflow shear rate). Effects of holding Qb : Qa at its lowest value and varying Re (figure 2a–d) are considered first, effects of varying Qb : Qa at the lowest value of Re (figure 2a,e,i,m) are considered next, and lastly effects of changing Re and Qb :Qa together are described.
Figure 2.
Magnitude and direction of non-dimensionalized aortic WSS around the ostium of the simple intercostal junction of figure 1a. (a–p) Mean aortic flow is from top to bottom. The simulations were performed at a range of Re and flow partitions to account for different species and ages within a species. Dashed lines indicate flow attachment.
3.1 Effect of Re at constant flow partition
Figure 2a–d shows results for Qb : Qa held at 0.08 per cent. At Re=30, the lowest value examined, normalized WSS (WSSn) was comparatively uniform around the ostium, with only slightly elevated values on the ostial lip, and the surface streamlines were everywhere almost parallel to the longitudinal axis. At Re=150, WSSn was slightly elevated immediately upstream and downstream of the branch orifice and the upstream streamtraces converged towards the ostium. As Re was further increased to 500, the upstream and downstream regions of high WSSn enlarged, the downstream region taking on the shape of a streak, and WSSn decreased at the lateral margins of the orifice. These trends in WSSn were exaggerated when Re was at its maximum of 1500. Streamlines in the upstream region converged more sharply towards the orifice (suggesting local acceleration of fluid particles) and diverged in the downstream region (suggesting local deceleration). In all cases, the streamlines were symmetrical about the centreline although this was not explicitly imposed by the numerical algorithm (see §4 and figures 5a and 6a for an analysis of the flow features underlying these patterns).
Figure 5.
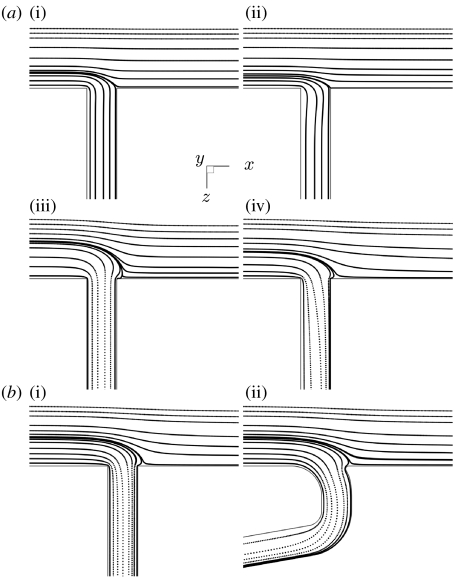
Streamlines along the mid-plane of the domain. (a) Streamlines for the simple model of figure 1a; (a(i)–(iv)) correspond to the four combinations (Re=30, 1500, 30, 1500, respectively, and Qb : Qa=0.08, 0.08, 0.79, 0.79%, respectively) of highest and lowest Re and Qb : Qa in figure 2. (b) Streamlines in (i) the simple model and (ii) the more realistic model of figure 1c at Re=500 and Qb : Qa=0.79%. Mean aortic flow is from left to right in all cases.
Figure 6.
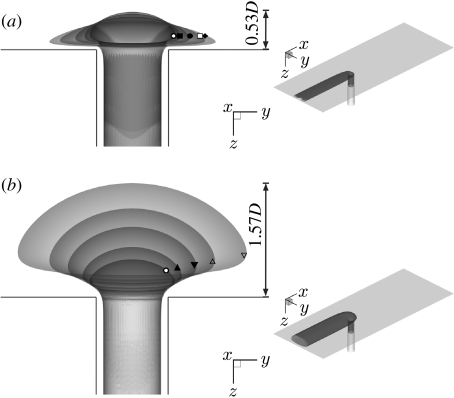
Computed streamtubes of fluid entering the branch. (a) Effect of increasing Re at Qb : Qa=0.08% (Re: open circle, 30; filled square, 150; filled circle, 500; open square, 1500; filled diamond, 2500). (b) Effect of increasing Qb : Qa at Re=30 (Qb : Qa: open circle, 0.08%; filled uptriangle, 0.16%; filled downtriangle, 0.39%: open uptriangle, 0.79%; open downtriangle, 1.73%). Perspective views of the streamtubes are shown on the right.
3.2 Effect of flow partition at constant Re
Figure 2a,e,i,m shows WSSn patterns and surface streamlines calculated for Re=30. At the lowest side branch flow partition (Qb : Qa=0.08%), WSSn was almost uniform except for slightly increased values on the ostial lip, and the streamlines were almost straight, as noted above. As Qb : Qa increased, a region of higher WSSn developed upstream of the ostium, where the surface streamlines converged towards the branch, suggesting acceleration of the near-wall fluid. Increases in Qb : Qa also reduced WSSn in a circumscribed region immediately downstream of the branch, except on the lip itself where it remained elevated. Streamlines diverged in this area. (Effects of increasing flow partition on the flow field underlying these patterns are presented in §4 and figures 5a and 6b.)
3.3 Effects of changing Re and Qb : Qa together
The remainder of figure 2 shows WSSn patterns and surface streamlines for other combinations of these values of Re and Qb : Qa. In all rows, increasing Re led to a decrease of WSSn at the sides of the branch and an increase upstream and downstream. In all columns, increasing Qb : Qa enlarged the areas where WSSn was altered and intensified the differences in its magnitude. It also moved the low-shear side lobes downstream and extended the downstream region of reversed flow. In every case, the upstream region was characterized by elevated WSSn; this region extended further upstream and around the orifice at higher Re and Qb : Qa. At these higher values, attachment lines were observed downstream of the branch ostium, and they enlarged with increasing Re and Qb : Qa.
3.4 WSSn at paired intercostal branches
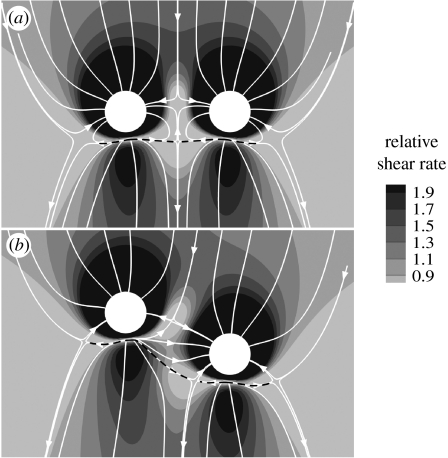
The two configurations for paired branches—ostia at the same and at staggered streamwise positions—were tested at Re=500 and Qb : Qa=0.79 per cent. In both cases (figure 3), the pattern of WSSn around each ostium was broadly similar to that observed for a single branch under the same conditions (figure 2o). Differences were restricted to the region between the two ostia, where the areas of low WSSn seen to the sides and slightly downstream of individual ostia were truncated and merged. The WSSn pattern was symmetrical about the axial midline when the ostia were at the same streamwise position, but not when they were staggered. Interestingly, no fluid flowing close to the wall between the two ostia appeared able to move downstream of the ostia; rather, the flow turned towards one or other of them. In the staggered case, there was a more complex pattern that maintained many of the topological features of the unstaggered case. However, the downstream centreline stagnation point in the unstaggered case split into two stagnation points in the staggered configuration.
Figure 3.
Magnitude and direction of non-dimensionalized aortic WSS around a pair of intercostal ostia at (a) the same streamwise position and (b) staggered positions. Mean aortic flow is from top to bottom. The simulations were performed for Re=500 and Qb : Qa=0.79%. Dashed lines indicate flow attachment.
3.5 Effects of geometric assumptions
To test the possibility that the side boundary conditions affected the results, WSSn and surface streamlines were examined after the aortic channel had been doubled in width. At Re=500 and Qb : Qa=0.79 per cent, there was an approximately 3 per cent increase in the mean WSS in a square region of size 3D centred around the branch ostium.
The effect of rounding the sharp edges of the aorto-intercostal junction was also investigated at Re=500 and Qb : Qa=0.79 per cent. There was an approximately 1.7 per cent decrease in the streamwise-acting force.
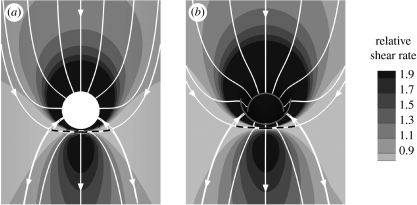
Modelling the aorta as a half cylinder (figure 1b), with the junction being the intersection between two perpendicular cylinders, did not qualitatively alter the pattern of WSS around the branch ostium at Re=500 and Qb : Qa=0.79 per cent (figure 4a). The high WSSn region upstream and around the ostial lip was reduced slightly in magnitude.
Figure 4.
Magnitude and direction of non-dimensionalized aortic WSS around the ostium of (a) the aortic model of figure 1b and (b) the realistic aorto-intercostal junction of figure 1c. Mean aortic flow is from top to bottom. The simulations were performed for Re=500 and Qb : Qa=0.79%. Dashed lines indicate flow attachment.
Finally, using the more realistic geometry of figure 1c, again at Re=500 and Qb : Qa=0.79 per cent, the WSSn pattern (figure 4b) appeared nearly identical in character to the equivalent obtained for the simple geometry. WSSn remained elevated upstream of the ostium despite the gently curving inflow tract.
4. Discussion
We used computational fluid dynamic techniques to examine the effect of Reynolds number, Re, and flow partition, Qb : Qa, on aortic WSS around the origins of intercostal arteries. The study was motivated by the observation that the pattern of atherosclerosis, putatively a shear-dependent disease, varies between species and with age at this site. We wished to determine whether patterns of WSS can also vary. The values of Re that we studied are appropriate for species ranging from mice to people (Buchanan et al. 1999; Shahcheraghi et al. 2002; Feintuch et al. 2007). Flow partitions have not been measured accurately at intercostal branch sites in any species. Furthermore, there is disagreement as to whether flow in general partitions according to the square or the cube of the ratio of vessel diameters (Cheng et al. 2007), which would correspond to Qb : Qa=1 per cent or 0.1 per cent, respectively, for the models examined in this study. Partitions will certainly vary with physiological demand and may also depend on species and age. We therefore investigated a wide range encompassing or closely approaching these values. Our main finding was that the pattern of WSS is highly dependent on Re and flow partition.
The fundamental features of the flow underlying the different patterns of WSSn shown in figure 2 can be elucidated by computing streamlines along the mid-plane of the aortic channel (figure 5) and by computing streamtubes of fluid moving into the branch (figure 6). To obtain the streamtubes, a ring of fluid particles at a distance 2D down the branch and with diameter 0.8D was traced backwards into the aorta to examine its origins (Coppola et al. 2001). Figure 6 includes simulations at higher values of Re and Qb : Qa than figure 2, to confirm the trend in their effects on the streamtube. Perspective views of the streamtube are shown in figure 6 (on the right).
These figures show that increasing Re causes fluid to enter the branch from regions closer to the aortic wall. For example, the streamline that divides the fluid entering the branch from that continuing down the aorta moves towards the aortic wall in figure 5a when Re is increased from 30 to 1500. At Re=1500, fluid flow in the mainstream has too much momentum to enter the branch; instead, fluid is drawn down the side branch from a wider area nearer the wall, where it is moving more slowly (figure 6a). This shift of the streamtube nearer to the wall leads to a greater influence of the branch on WSS around the ostium. The resulting divergence of surface streamlines lateral to the ostium (figure 2) leads to a reduction in WSS, as the flow slows down between them (providing that streamlines just above the surface remain parallel to the wall, as is the case). The inability of mainstream fluid to be drawn down the branch also provides an insight into why an attachment line develops downstream of the ostium at higher values of Re: a greater amount of slow moving, near-wall fluid is drawn down the branch, initially from lateral regions but then from downstream regions (figure 2i–p).
Increasing the flow partition Qb : Qa necessarily increases the cross-sectional area of the streamtube in the aorta. These streamtubes remain similar in shape to the ones seen at lower Qb : Qa (figure 6b), explaining why greater flow into the branch intensifies and enlarges some features of the WSS patterns (figure 2 a,e,i,m; b,f,j,n; c,g,k,o; d,h,l,p) but does not fundamentally alter the flow physics. However, at some value of Qb : Qa the need for more fluid to enter the branch requires fluid to be drawn from downstream of the ostium and so the streamlines along the mid-plane can be seen to overshoot the branch mouth before entering the branch (figure 5a). This mechanism explains why the attachment line (and by analogy the lateral areas of low WSSn) moves downstream as Qb : Qa increases (figure 2a,e,i,m; b,f,j,n; c,g,k,o; d,h,l,p). This property can lead to a shift from an increase to a decrease in WSSn in regions immediately downstream of the ostium. Finally, considering figure 2a,e,i,m; b,f,j,n; c,g,k,o; d,h,l,p, we observe that as Qb : Qa increases there is a reduction of WSSn lateral to the ostium. Again this correlates with a divergence of the surface streamlines. As noted above, this explanation assumes that streamlines above the surface remain parallel to the wall. In our data analysis, we observed some distortion of these streamlines with increasing Qb : Qa but not to an extent that could compensate for the lateral divergence of the surface streamlines; hence the average flow in this region is reduced, leading to a reduction in WSSn.
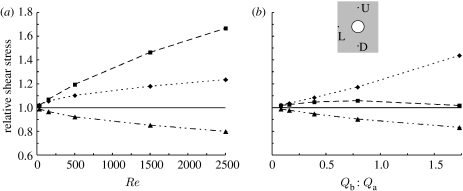
Figure 7 is a line graph showing the changes in WSSn observed with increasing Re at Qb : Qa=0.08 per cent (figure 7a), and with increasing Qb : Qa at Re=30 (figure 7b) in the simple geometry (figure 1a). Maps of WSSn contours shown for these conditions in figure 2a–d and a,e,i,m. In figure 7, WSSn is instead shown more precisely for three locations on the aortic wall: one side branch diameter (D) upstream of the ostial lip, 1D downstream of it, and 1D lateral to it. (Figure 7 also includes simulations at higher values of Re and Qb : Qa than in figure 2, to confirm the trend in their effects on the WSSn.) At the lowest Re and Qb : Qa, WSSn was almost uniform around the branch and had a magnitude close to the inflow normalized value of 1 at all three locations. WSSn rose more rapidly downstream than upstream with increasing Re, but the opposite was seen with increasing Qb : Qa, where values in the downstream region rose only slightly before falling again. Increasing either Re or Qb : Qa decreased WSSn lateral to the lip, as explained above.
Figure 7.
Change in WSSn with (a) Re (for Qb : Qa=0.08%) and (b) flow partition (for Re=30), measured at three locations on the aortic wall for the simple geometry of figure 1a: at distances 1D upstream (U) of the ostial lip, 1D downstream (D) of it and 1D lateral (L) to it (inset). Dotted line with diamond, U; dashed line with square, D; dot-dashed line with triangle, L.
4.1 Simplifying assumptions
Re and Qb : Qa were systematically varied in an idealization of the aorto-intercostal junction consisting of a cylindrical branch emerging from a flat plate. Using an idealized geometry can help elucidate underlying mechanisms that would be obscured or attributed to geometric features in a more complex model, but may also introduce artefacts or fail to replicate important facets of in vivo flows. The effects of the simplification were examined by computing flows at some combinations of Re and Qb : Qa after the idealized geometry had been modified by (i) incorporating a second branch to form an unstaggered or a staggered pair of branches, (ii) rounding the corners of the junction, (iii) introducing a curved aortic wall, or (iv) incorporating a realistically curved inflow tract, flow divider and daughter vessel. None of these modifications had a significant effect on the fundamental flow features or pattern of WSS. Additional evidence for this is provided in figure 5b, which shows that similar patterns of streamlines occur along the mid-plane of the aortic channel in the simplified and the more geometrically realistic model of a single branch. It therefore seems unlikely that the use of a real geometry would have altered the main conclusions.
The model was additionally simplified by assuming Newtonian rheology. This assumption is widely used and has only modest quantitative effects on patterns of WSS at branches of large arteries; qualitative features of the pattern and of the fundamental flow are not affected (Perktold et al. 1991). Secondary flows emerging from the left ventricle or arising from the curvature and branches of the aortic arch were also ignored; they will have only a minor effect in the descending aorta, most likely by slightly skewing the branch-dependent effects.
The most important simplification was the assumption of steady flow. Some effects of unsteadiness are not considered significant. First, owing to the long wavelength of pressure waves within the aorta (5–10 m; Milnor 1979) and the small deformation of the aortic wall over each cardiac cycle (less than 10% change of aortic diameter), the velocity of radial wall motion is small compared with the radial flow components caused by the branch, and can be ignored. (This may be particularly true for intercostal branch points since they are situated in the dorsal thoracic aorta, which is tethered to the posterior chest wall.) Second, changes in mean velocity during the cardiac cycle are sufficiently slow that the flow can be considered quasi-steady at each time point. This is best understood by using the Strouhal number, St, or its reciprocal, the reduced velocity parameter, Ured (Sherwin & Blackburn 2005)
where U is the velocity scale and T is the pulse duration. Reduced velocity can be interpreted as the distance (in diameters) that the mean flow covers within one pulse. It is related to the Womersley number, α, and Re according to
For people (Re≈1500, α≈15) and rabbits (Re≈500, α≈8), Ured is equivalent to approximately 10 aortic diameters, or approximately 100 intercostal branch diameters. Hence, flow near the branch is not dominated by unsteady phenomena and its character can be approximated by the steady flow result obtained at a value of Re appropriate for each part of the cardiac cycle.
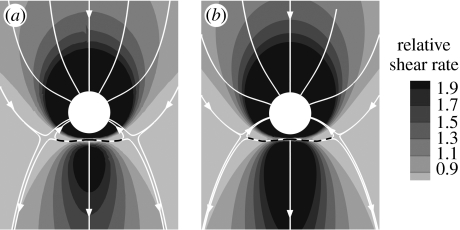
However, some effects of unsteadiness could be significant. For example, the inlet velocities should be spatially distributed with a time-varying Womersley profile rather than the Poiseuille profile appropriate for fully developed steady flow. The different distributions of inertia would affect the origin of the streamtube flowing into the branch. We therefore conducted a preliminary investigation of unsteady flow in the simple model geometry of figure 1a. A Womersley-type solution for two-dimensional flow driven between two parallel plates by a pulsating pressure gradient (Landau & Lifshitz 1959; Loudon & Tordesillas 1998) was applied as inlet velocity profile. The temporal waveform of the sectionally averaged inflow was described by a steady component plus a single sinusoidal harmonic giving a peak-to-mean flow ratio of approximately 1.5. Mean Re was taken to be 500 and Ured was 4 (equivalent to St=0.25). A similar waveform, in phase with the aortic inflow waveform and again with a peak-to-mean ratio of 1.5, was imposed on the branch outflow. Mean Qb : Qa was 0.79 per cent. Figure 8 compares the pattern of time-averaged WSSn under these conditions with the steady-flow WSSn pattern for the same Re and Qb : Qa (also shown as figure 2o). The two WSSn patterns are very similar in character, with only slightly more extended regions of high WSSn upstream and downstream of the branch in the unsteady case; the streamline patterns are indistinguishable.
Figure 8.
(a) Steady flow WSSn pattern for Re=500, Qb: Qa=0.79%. (b) Normalized time-averaged wall shear stress (WSSn) pattern under unsteady flow conditions, for Rem=500, Qb: Qa =0.79% and Ured = 4 (equivalent to St=0.25). Mean aortic flow is from top to bottom. Dashed lines indicate flow attachment.
This preliminary investigation demonstrated that, despite alterations in the pattern of WSS during the cardiac cycle, mean WSSn patterns are not significantly affected by the assumption of steady flow, at least for Ured=4 (physically interpreted as the mean flow moving 40 intercostal diameters during one cardiac cycle, and equivalent to a Womersley parameter value of 14). These values represent an upper bound of unsteadiness for the species and ages considered here. Of course, endothelial cells may respond not only to mean WSS but also to derivatives of WSS and further investigation of the effect of Re and Qb : Qa on spatial patterns of such derivatives is required. Several parameters of potential importance have been proposed, including the oscillatory shear index (OSI) and WSS (spatial) gradient (Buchanan et al. 1999).
4.2 Comparison with other studies
A number of authors, in seeking to explain the particularly frequent occurrence of lesions downstream of aortic side branches in cholesterol-fed animals (Fry 1969; Cornhill & Roach 1976), or the low frequency of human atherosclerosis at these locations (Caro et al. 1971), have speculated that this is an area of particularly high WSS. However, Sobey (1977a,b) and Tutty (1988), under the assumption of Stokes flow, showed for the two- and three-dimensional case, respectively, that WSS is elevated upstream of small branch orifices as well as downstream of them. Our results are in good agreement with their analyses at similar values of Re and Qb : Qa but at other values we found different patterns, involving the occurrence of relatively low WSS at the sides of branches when Re is elevated and downstream of branches when Qb : Qa is elevated.
WSS has also been computed in models of the origin of the coeliac artery (Cheer et al. 1998; Buchanan et al. 1999). This branch is not strictly analogous to the one studied here, since the daughter vessel is comparable in size to the aorta (with a flow partition approaching 50%) and does not form part of a pair. Furthermore, although effects of Re and Qb : Qa have been investigated individually (Cheer et al. 1998), their interactions have not been studied. Nevertheless, a number of the features and trends we identified can be discerned in the maps they present for this site.
4.3 Physiological and pathological relevance
This study is part of a larger research programme to determine whether the differences in lesion distribution that occur between species and between ages within a species can be explained by differences in the pattern of WSS. Evidence for age- and species-related differences in WSS patterns has been obtained by examining endothelial morphology around branches. Endothelial cells and their nuclei align with the predominant flow direction and elongate with increasing shear. In young rabbits, endothelial nuclei are more elongated downstream of branches than upstream, but the reverse pattern is seen in mature rabbits (Al-Musawi et al. 2004). Nuclear shape is approximately the same upstream and downstream of branches in both immature and mature mice (Bond & Weinberg 2006).
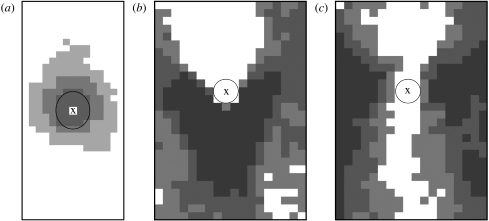
Figure 9a–c shows the patterns of aortic lesion frequency around intercostal ostia in apolipoprotein E/low-density lipoprotein receptor double knockout mice (McGillicuddy et al. 2001), immature cholesterol-fed rabbits and mature cholesterol-fed rabbits (Barnes & Weinberg 1999), respectively. The comparatively uniform pattern of WSSn we found for the lowest values of Re and Qb : Qa (figure 2a) correlates with the approximate circumferential uniformity of lesion frequency seen in mice of all ages (figure 9a). Similarly, the WSSn pattern found at relatively high values of Reynolds and flow rate partition (e.g. for Re=500, Qb : Qa=0.79 per cent in figure 2) correlates with some features of the lesion pattern observed in mature rabbits (figure 9c). In both cases, however, other features do not correlate, and we failed to find a pattern of WSSn that correlates even superficially with the downstream pattern of lesions seen in immature rabbits (figure 9b). Despite an apparent consensus, this work showed that many aspects of the relation between WSS and lesion occurrence remain obscure. An examination of spatial and temporal derivatives of WSS under pulsatile flow may help resolve these difficulties.
Figure 9.
Patterns of lesion frequency around intercostal ostia (a) from six mice aged 16–20 weeks (after McGillicuddy et al. 2001), (b) from six young rabbits, six weeks old, and (c) from five mature rabbits of average age 27 months (after Barnes & Weinberg 1999). Frequency increases with shading. Mean aortic flow is from top to bottom and X marks the centre of the ostium.
Acknowledgments
This work was funded by the Institute of Biomedical Engineering, Imperial College London, and the Public Benefit Foundation Alexander S. Onassis. S.J.S. would also like to acknowledge partial support through an EPSRC Advanced Research Fellowship.
References
- Abrahams P.H. Mosby; London, UK: 2001. McMinn's interactive clinical anatomy. [Google Scholar]
- Al-Musawi S.L., Bishton J., Dean J., Williams S., Cremers S.G., Weinberg P.D. Evidence for a reversal with age in the pattern of near-wall blood flow around aortic branches. Atherosclerosis. 2004;172:79–84. doi: 10.1016/j.atherosclerosis.2003.09.028. [DOI] [PubMed] [Google Scholar]
- Barnes S.E., Weinberg P.D. Contrasting patterns of spontaneous aortic disease in young and old rabbits. Arterioscler. Thromb. Vasc. Biol. 1998;18:300–308. doi: 10.1161/01.atv.18.2.300. [DOI] [PubMed] [Google Scholar]
- Barnes S.E., Weinberg P.D. Two patterns of lipid deposition in the cholesterol-fed rabbit. Arterioscler. Thromb. Vasc. Biol. 1999;19:2376–2386. doi: 10.1161/01.atv.19.10.2376. [DOI] [PubMed] [Google Scholar]
- Bond A.R., Weinberg P.D. Haemodynamic stresses and wall structure can account for the pattern of lipid deposition around aortic branches in mice. Atherosclerosis. 2006;7(Suppl.):200. doi: 10.1016/S1567-5688(06)80777-4. [DOI] [Google Scholar]
- Buchanan J.R., Jr, Kleinstreuer C., Truskey G.A., Lei M. Relation between non-uniform hemodynamics and sites of altered permeability and lesion growth at the rabbit aorto-celiac junction. Atherosclerosis. 1999;143:27–40. doi: 10.1016/S0021-9150(98)00264-0. [DOI] [PubMed] [Google Scholar]
- Caro C.G., Fitz-Gerald J.M., Schroter R. Atheroma and arterial wall shear observation, correlation and proposal of a shear dependent mass transfer mechanism for atherogenesis. Proc. R. Soc. Lond. B. 1971;177:109–159. doi: 10.1098/rspb.1971.0019. [DOI] [PubMed] [Google Scholar]
- Caro C.G., Pedley T.J., Schroter R.C., Seed W.A. Oxford University Press; Oxford, UK: 1978. The mechanics of the circulation. [Google Scholar]
- Cheer A.Y., Dwyer H.A., Barakat A.I., Sy E., Bice M. Computational study of the effect of geometric and flow parameters on the steady flow field at the rabbit aorto-celiac bifurcation. Biorheology. 1998;35:415–435. doi: 10.1016/S0006-355X(99)80020-1. [DOI] [PubMed] [Google Scholar]
- Cheng C., et al. Large variations in absolute wall shear stress levels within one species and between species. Atherosclerosis. 2007;195:225–235. doi: 10.1016/j.atherosclerosis.2006.11.019. [DOI] [PubMed] [Google Scholar]
- Coppola G., Sherwin S.J., Peiró J. Nonlinear particle tracking for high-order elements. J. Comput. Phys. 2001;172:356–386. doi: 10.1006/jcph.2001.6829. [DOI] [Google Scholar]
- Cornhill J.F., Roach M.R. A quantitative study of the localization of atherosclerotic lesions in the rabbit aorta. Atherosclerosis. 1976;23:489–501. doi: 10.1016/0021-9150(76)90009-5. [DOI] [PubMed] [Google Scholar]
- Feintuch A., et al. Hemodynamics in the mouse aortic arch as assessed by MRI, ultrasound, and numerical modeling. Am. J. Physiol. Heart Circ. Physiol. 2007;292:H884–H892. doi: 10.1152/ajpheart.00796.2006. [DOI] [PubMed] [Google Scholar]
- Fry D.L. Certain chemorheologic considerations regarding the blood vascular interface with particular reference to coronary artery disease. Circulation. 1969;40:38–57. [Google Scholar]
- Giordana S., Sherwin S.J., Peiró J., Doorly D.J., Crane J.S., Lee K.E., Cheshire N.J., Caro C.G. Local and global geometric influence on steady flow in distal anastomoses of peripheral by-pass grafts. J. Biomech. Eng. 2005;127:1087–1098. doi: 10.1115/1.2073507. [DOI] [PubMed] [Google Scholar]
- Greve J.M., Les A.S., Tang B.T., Draney Blomme M.T., Wilson N.M., Dalman R.L., Pelc N.J., Taylor C.A. Allometric scaling of wall shear stress from mice to humans: quantification using cine phase-contrast MRI and computational fluid dynamics. Am. J. Physiol. Heart Circ. Physiol. 2006;291:H1700–H1708. doi: 10.1152/ajpheart.00274.2006. [DOI] [PubMed] [Google Scholar]
- Karniadakis G., Sherwin S.J. 2nd edn. Oxford Science Publications; Oxford, UK: 2005. Spectral/hp element methods for computational fluid dynamics. [Google Scholar]
- Landau L.D., Lifshitz E.M. Pergamon Press; Oxford, UK: 1959. Fluid mechanics. [Google Scholar]
- Loudon C., Tordesillas A. The use of the dimensionless Womersley number to characterize the unsteady nature of internal flow. J. Theor. Biol. 1998;191:63–78. doi: 10.1006/jtbi.1997.0564. [DOI] [PubMed] [Google Scholar]
- McGillicuddy C.J., Carrier M.J., Weinberg P.D. Distribution of lipid deposits around aortic branches of mice lacking LDL receptors and apolipoprotein E. Arterioscler. Thromb. Vasc. Biol. 2001;21:1220–1225. doi: 10.1161/hq0701.091996. [DOI] [PubMed] [Google Scholar]
- Milnor W.R. Aortic wavelength as a determinant of the relation between heart rate and body size in mammals. Am. J. Physiol. Regul. Integr. Comp. Physiol. 1979;237:R3–R6. doi: 10.1152/ajpregu.1979.237.1.R3. [DOI] [PubMed] [Google Scholar]
- Mitchell J.R.A., Schwartz C.J. Blackwell; Oxford, UK: 1965. Arterial disease. [Google Scholar]
- Nichols W.W., O'Rourke M.F. 4th edn. Arnold; London, UK: 1998. McDonald's blood flow in arteries. Theoretical, experimental and clinical principles. [Google Scholar]
- Papaharilaou Y., Doorly D.J., Sherwin S.J. The influence of out-of-plane geometry on pulsatile flow within a distal end-to-side anastomosis. J. Biomech. 2002;35:1225–1239. doi: 10.1016/S0021-9290(02)00072-6. [DOI] [PubMed] [Google Scholar]
- Pedley T.J. Cambridge University Press; Cambridge, UK: 1980. The fluid mechanics of large blood vessels. [Google Scholar]
- Peiró J., Giordana S., Griffith C., Sherwin S.J. High-order algorithms for vascular flow modelling. Int. J. Numer. Meth. Fluids. 2002;40:137–151. doi: 10.1002/fld.270. [DOI] [Google Scholar]
- Perktold K., Resch M., Florian H. Pulsatile non-Newtonian flow characteristics in a three-dimensional human carotid bifurcation model. J. Biomech. Eng. 1991;113:464–475. doi: 10.1115/1.2895428. [DOI] [PubMed] [Google Scholar]
- Sebkhi A., Weinberg P.D. Age-related variations in transport properties of the rabbit arterial wall near branches. Atherosclerosis. 1994;106:1–8. doi: 10.1016/0021-9150(94)90077-9. [DOI] [PubMed] [Google Scholar]
- Sebkhi A., Weinberg P.D. Effect of age on the pattern of short-term albumin uptake by the rabbit aortic wall near intercostal branch ostia. Arterioscler. Thromb. Vasc. Biol. 1996;16:317–327. doi: 10.1161/01.atv.16.2.317. [DOI] [PubMed] [Google Scholar]
- Shahcheraghi N., Dwyer H.A., Cheer A.Y., Barakat A.I., Rutaganira T. Unsteady and three-dimensional simulation of blood flow in the human aortic arch. J. Biomech. Eng. 2002;124:378–387. doi: 10.1115/1.1487357. [DOI] [PubMed] [Google Scholar]
- Sherwin S.J., Blackburn H.M. Three-dimensional instabilities and transition of steady and pulsatile axisymmetric stenotic flows. J. Fluid Mech. 2005;533:297–327. doi: 10.1017/S0022112005004271. [DOI] [Google Scholar]
- Sherwin S.J., Peiró J. Mesh generation in curvilinear domains using high-order elements. Int. J. Numer. Meth. Eng. 2002;53:207–223. doi: 10.1002/nme.397. [DOI] [Google Scholar]
- Sherwin S.J., Shah O., Doorly D.J., Peiró J., Papaharilaou Y., Watkins N., Caro C.G., Dumoulin C.L. The influence of out-of-plane geometry on the flow within a distal end-to-side anastomosis. J. Biomech. Eng. 2000;122:86–95. doi: 10.1115/1.429630. [DOI] [PubMed] [Google Scholar]
- Sinzinger H., Silberbauer K., Auerswald W. Quantitative investigation of sudanophilic lesions around the aortic ostia of human fetuses, newborn and children. Blood Vessels. 1980;17:44–52. doi: 10.1159/000158233. [DOI] [PubMed] [Google Scholar]
- Sloop G., Perret R., Brahney J., Oalmann M. A description of two morphologic patterns of aortic fatty streaks, and a hypothesis of their pathogenesis. Atherosclerosis. 1998;141:153–160. doi: 10.1016/S0021-9150(98)00167-1. [DOI] [PubMed] [Google Scholar]
- Sobey, I. J. 1977a Bio-fluid dynamics of bifurcations. PhD thesis, University of Cambridge, Cambridge, UK.
- Sobey I.J. Laminar boundary-layer flow past a two-dimensional slot. J. Fluid Mech. 1977b;83:33–47. doi: 10.1017/S0022112077001025. [DOI] [Google Scholar]
- Tutty O.R. Flow in a tube with a small side branch. J. Fluid Mech. 1988;191:79–109. doi: 10.1017/S0022112088001521. [DOI] [Google Scholar]
- Weinberg P.D. Disease patterns at arterial branches and their relation to flow. Biorheology. 2002;39:533–537. [PubMed] [Google Scholar]
- Weinberg P.D., Ethier C.R. Twenty-fold difference in hemodynamic wall shear stress between murine and human aortas. J. Biomech. 2007;40:1594–1598. doi: 10.1016/j.jbiomech.2006.07.020. [DOI] [PubMed] [Google Scholar]


