

Abstract
A fast and simple, solvent-free matrix deposition protocol was developed for positive ionization mode phospholipid analysis in tissues. Finely ground 2,5-dihydroxybenzoic acid was deposited onto sagittal mouse brain sections using a dry-coating technique, in which solid matrix particles were filtered directly onto the tissue through a 20 μm stainless steel sieve. Phospholipid signals were obtained directly off these sections, allowing acquisition of high resolution MS images. These images were compared to those from serial sections that were spray-coated with a thin-layer chromatography (TLC) reagent sprayer. Signals obtained from the dry matrix deposition method were comparable to those from spray-coated sections, producing identical localization patterns with a simpler and faster sample preparation with virtually no analyte delocalization. This approach was found to yield highly reproducible results, eliminating much of the variance caused by operator differences, and making it an attractive alternative to the currently used matrix application methods.
Introduction
Matrix-assisted laser desorption/ionization imaging mass spectrometry (MALDI IMS) is a powerful technique for analyzing the spatial distribution of a wide range of biomolecules [1–3]. Phospholipids are integral structural and regulatory components of biological membranes, important in cell signaling pathways, and they serve as precursors to many active biomolecules [4–7]. Recently, analysis of phospholipids (PL) by imaging mass spectrometry (IMS) has been reported [8–15]. The study of the distribution of these biomolecules can provide critical insight into relevant biological processes in healthy as well as diseased tissue samples.
Common methods of depositing matrix for MALDI imaging include robotic spotting [16], electrospray deposition [17], and spray-coating with an airbrush [18]. Robotic spotting usually yields high signal quality and very reproducible results, but the image resolution is limited to the size and spacing of the matrix spots. Washing the tissue with ethanol helps to prevent the spreading of the matrix spots, but such a wash cannot be utilized when analyzing phospholipids. Spray-coating can cause analyte delocalization if the tissue becomes too wet during the application. Also, the matrix crystal size and the homogeneity of the coating can vary significantly from operator to operator. Recently, a protocol using sublimation for matrix deposition has been reported [19] that gives a homogeneous coating of matrix essential for obtaining high resolution phospholipid images from tissue. The sublimation apparatus is relatively simple and is commercially available.
We describe a new procedure that involves dry-coating matrix on a tissue section using finely ground crystals of 2,5-dihydroxybenzoic acid (DHB) filtered through a 20 μm sieve. Positive ionization mode ion images were acquired at 30–100 μm lateral resolution using a MALDI TOF mass spectrometer. The results show that the dry matrix deposition protocol allows reproducible high resolution phospholipid images to be obtained.
Methods
2,5-Dihydroxybenzoic acid was purchased from Acros Organics (Morris Plains, NJ) and ground for 15 minutes using a mortar and a pestle, yielding crystals between 1 and 40 μm in diameter. The DHB solution used for the spray-coated comparison experiments was prepared at a concentration of 40 mg/mL using 1:1 ethanol:water solvent. The ethanol was HPLC grade and purchased from Fisher Scientific (Fairlawn, NJ).
Fresh frozen mouse brain samples were used for the imaging experiments. The tissue samples were cut into 12 μm thick sagittal sections using a cryostat (Leica CM3050 S) and then thaw-mounted onto gold-coated MALDI plates. The sections were allowed to dry in a vacuum desiccator for 10 minutes before matrix application. A serial section was cut and mounted on a glass slide and stained with hematoxylin and eosin for anatomical visualization. A 20 μm stainless steel sieve, a full height sieve receiving pan, and a sieve cover were purchased from Hogentogler & Co., Inc. (Columbia, MD). The MALDI plate was attached to the bottom of the receiving pan with double-sided tape. A layer of the finely ground DHB was then disbursed over the sieve mesh using a small brush. The sieve was covered and shaken until a uniform DHB layer was deposited over the tissue sections. Excess matrix was removed by briefly directing a burst of clean compressed gas (MicroDuster III, CleanTex, Nanuet, NY) towards the plate from a distance of 20 cm. The matrix application process was repeated three times for optimal coverage and homogeneity. The matrix coverage and crystals sizes were measured with an Olympus BX50 microscope.
For comparison, serial sections were prepared using a manual spray-coating technique. A TLC nebulizer (Kontes, Vineland, NJ) with nitrogen gas at 3 psi was used to spray-coat the tissue sections. The DHB solution was repetitively sprayed across the MALDI plate from a distance of 20 cm, allowing 45 seconds of drying time between the passes, until a uniform matrix coating was achieved on the tissue section.
Mouse brain tissue sections were imaged in the positive ionization mode with an UltraFlex II MALDI TOF-TOF instrument (Bruker Daltonics, Bremen, Germany) in reflector mode, accumulating 150 laser shots per position at a 100 Hz laser frequency over m/z range of 420–1200. The dry-coated images were acquired at 100 × 100 μm, 40 × 50 μm, and 30 × 35 μm raster step sizes using the over-sampling technique [17]. The spray-coated sections were imaged at a 100 μm step size. The laser intensity was adjusted before each imaging experiment to yield optimal results; generally the dry-coated sections required 15–30% greater laser fluence than the spray-coated sections. The images were created, normalized, and visualized using FlexImaging software.
Results and discussion
We have assessed the effectiveness of the solvent-free matrix dry-coating procedure for applications involving phospholipid imaging. The DHB crystal size and homogeneity of the matrix coverage were determined by optical microscopy. To control the crystal size deposited onto the tissue sections, we used a 20 μm sieve filter resulting in a matrix coating consisting of crystals of 1–20 μm in length. The crystal size distribution did not vary much between operators. Figure 1 shows a DHB coated sagittal mouse brain section and an optical microscope image of the matrix coating on tissue at a magnification of X4. The matrix coating is relatively uniform, with little clustering of the crystals.
Figure 1.
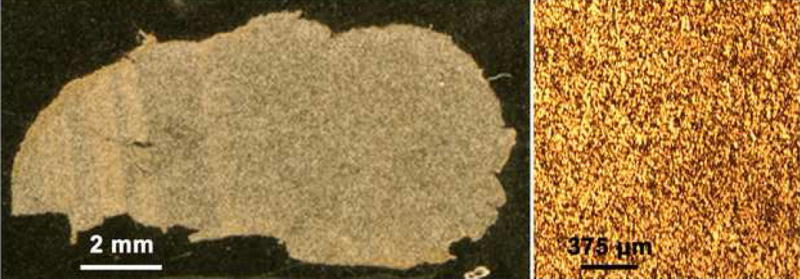
A scanned optical image (right) of a dry-coated sagittal mouse brain section on a MALDI plate and an optical microscope image (left) of the DHB layer on the tissue at a magnification of 4X.
Figure 2 shows a comparison between the solvent-free matrix dry-coating technique described here and a spray-coating method on serial sagittal mouse brain sections. Both sections were imaged at 100 μm lateral resolution. The average full scan phospholipid signal obtained with each method as well as over-laid ion images of the potassium salt of phosphatidylcholine (PC) 36:1 at m/z 826 and PC 40:6 at m/z 872 are shown as examples in Figure 2. The MS/MS spectrum of the m/z 826 peak, obtained directly from the dry-coated brain section, is also given. It shows the characteristic phosphocholine signal at m/z 184 and the neutral loss of the choline head group (−59 Da) as well as a potassium cyclophosphane peak at m/z 163. A consecutive MALDI spectrum acquired with a Fourier transform mass spectrometer (FTMS) showed a single peak at m/z 826.5723. The accurate mass obtained with the FTMS supports the identification of the species as PC 36:1 (calculated m/z 826.5728). While keeping the sample preparation steps simple and minimizing analyte delocalization, the dry-coating method produced high quality molecular images showing similar signal intensity and phospholipid localization to those obtained with the spray-coated tissue section.
Figure 2.
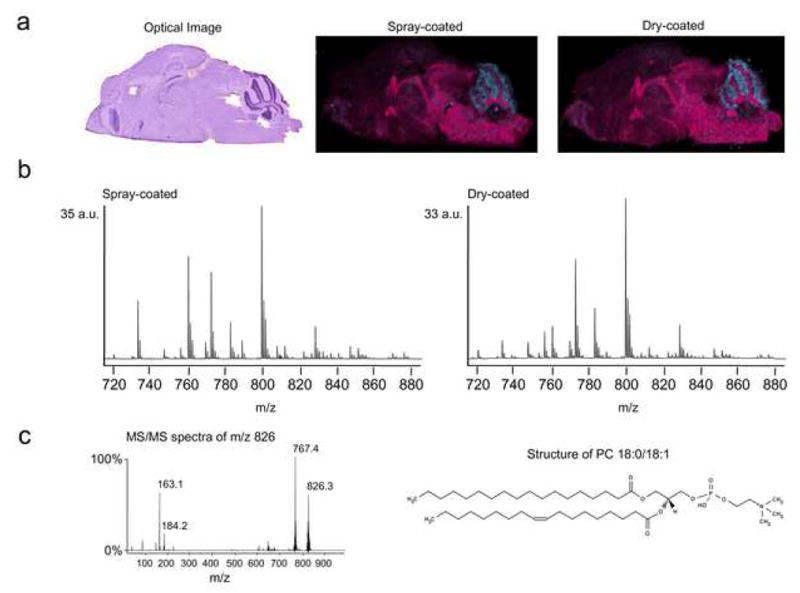
Comparison between dry-coated and spray-coated serial sagittal mouse brain sections. a) An optical image of hematoxylin and eosin stained serial section showing the brain anatomy highlighted by the over-laid phospholipid ion images of m/z 826 (pink) and m/z 872 (blue) from each experiment. b) Normalized total ion current spectra from the spray-coated and dry-coated imaging experiments. c) The MS/MS spectrum of m/z 826 from the dry-coated section shows the characteristic phosphocholine peak at m/z 184 and the neutral loss of trimethylamine from the choline head group (M+H−59 Da peak at m/z 767). According to accurate mass measurement by FTMS, the only species detected at this mass is PC 36:1. One of the possible PC 36:1 structures is also shown. PC = phosphatidylcholine.
From each dry-coated imaging experiment, dozens of ion images can be generated that clearly differentiate the anatomical structures of the brain. Several phospholipid images are shown in Figure 3. Some of the regions of the brain that were found to differentially express specific phospholipid distributions are identified in the hematoxylin and eosin stained serial section of the sagittal mouse brain. For example, the peak at m/z 741, which corresponds to potassium salt of sphingomyelin (SM 16:0), was found localized to the fourth and lateral ventricles. MS/MS analyses performed on the dry-coated sections supported the identifications of the phosphatidylcholine and sphingomyelin species indicated in Figure 3. The identifications were confirmed by accurate mass measurements using FTMS obtained directly from the dry-coated sections.
Figure 3.
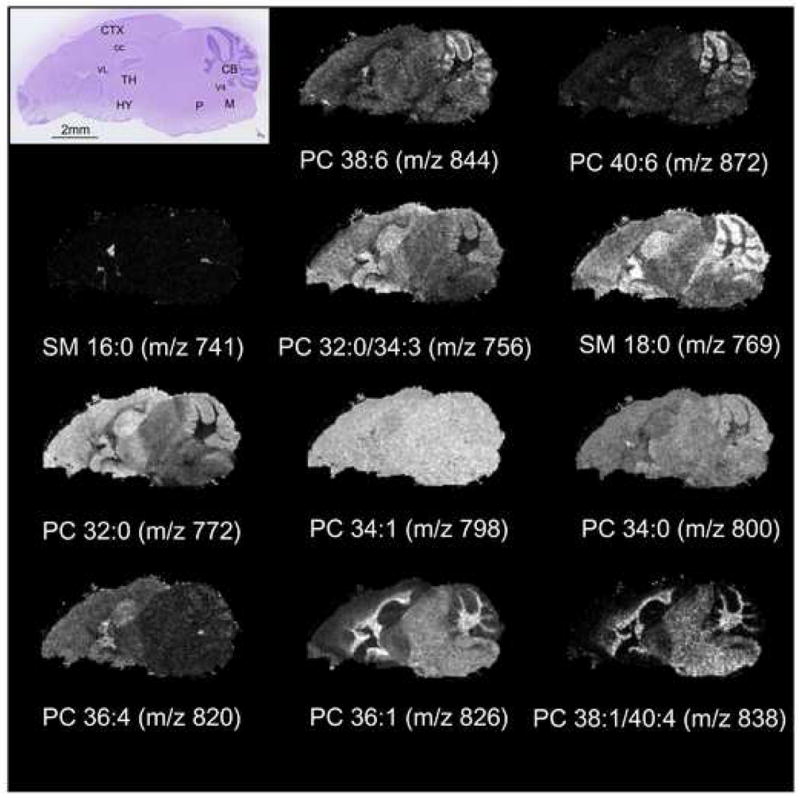
An optical image of hematoxylin and eosin stained sagittal mouse brain section showing the anatomy of the brain and selected ion images from a dry-coated serial sagittal section showing the phospholipid patterns in the brain. CB = cerebellum, CC = corpus callosum, CTX = cerebral cortex, HY = hypothalamus, M = medulla, P = pons, TH = thalamus, V4 = fourth ventricle, VL = lateral ventricle, PC = phosphatidylcholine, SM = sphingomyelin.
Dry-coating can be used for high resolution MALDI imaging, which is illustrated in figure 4. Two sagittal mouse brain sections were dry-coated and the cerebellum regions were imaged at 40 × 50 μm and 30 × 35 μm lateral resolutions. A serial section was stained with hematoxylin and eosin. The overlaid phospholipid images show the localization of PC 40:6 (m/z 872 in light blue), PC 36:1 and PC 38:4 (m/z 826 and 810 in red), and PC 38:6 (m/z 844 in green) in the cerebellar cortex, nucleus, and granule cell layer, respectively.
Figure 4.
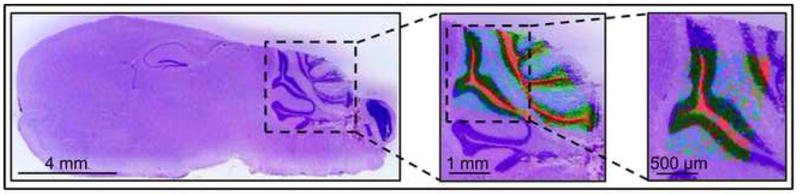
High resolution MALDI images of a mouse cerebellum. The left panel shows the hematoxylin and eosin (H&E) stained optical image of a mouse brain section. Two serial sections were dry-coated and parts of the cerebellums were imaged at 40 × 50 μm (middle panel) and 30 × 35 μm (right panel) lateral resolutions. The overlaid phospholipid images show the localization of PC 40:6 (m/z 872 in light blue) to the cerebellar cortex, PC 36:1 and PC 38:4 (m/z 826 in the middle and m/z 810 on the left in red) to the cerebellar nucleus, and PC 38:6 (m/z 844 in green) to the granule cell layer. The ion images are presented overlaid with a larger area of an H&E section to show the context.
In conclusion, the solvent-free matrix dry-coating approach for phospholipid analysis and imaging can be an attractive alternative to methods that require the matrix to be dissolved in a solvent. With the dry-coating method, there is no significant analyte delocalization. Optimal matrix coverage is achieved when the tissue section is dried in a desiccator for no more than ten to fifteen minutes before dry-coating, suggesting that some moisture on the tissue aids micro-scale dissolvation of the surface layers of the matrix crystals. The spatial resolution of the image is limited by the size of the focused laser spot, the size of the individual matrix crystals, and percent matrix coverage on tissue, which for the experiments reported here, was greater than 80%. The dry-coating procedure is a simple and fast method of producing a homogeneous matrix coating, which in turn can give high quality phospholipid molecular images.
Acknowledgments
The authors are grateful for the funding from DOD grant W81XWH-05-1-0179, NIH/NIHD grant 2T32 HD007043-31, and NIH/NIGMS grant ZR01 GM58008-09.
Footnotes
Publisher's Disclaimer: This is a PDF file of an unedited manuscript that has been accepted for publication. As a service to our customers we are providing this early version of the manuscript. The manuscript will undergo copyediting, typesetting, and review of the resulting proof before it is published in its final citable form. Please note that during the production process errors may be discovered which could affect the content, and all legal disclaimers that apply to the journal pertain.
References
- 1.Caprioli RM, Farmer TB, Gile J. Molecular imaging of biological samples: localization of peptides and proteins using MALDI-TOF MS. Anal Chem. 1997;69:4751. doi: 10.1021/ac970888i. [DOI] [PubMed] [Google Scholar]
- 2.Chaurand P, Caprioli RM. Direct profiling and imaging of peptides and proteins from mammalian cells and tissue sections by mass spectrometry. Electrophoresis. 2002;23:3125. doi: 10.1002/1522-2683(200209)23:18<3125::AID-ELPS3125>3.0.CO;2-#. [DOI] [PubMed] [Google Scholar]
- 3.Chaurand P, Schwartz SA, Caprioli RM. Profiling and imaging proteins in tissue sections by mass spectrometry. Anal Chem. 2004;76:86A. [PubMed] [Google Scholar]
- 4.Mills GB, Moolenaar WH. The emerging role of lysophosphatidic acid in cancer. Nature Reviews Cancer. 2003;8:582. doi: 10.1038/nrc1143. [DOI] [PubMed] [Google Scholar]
- 5.Nakamura S, Nishizuka Y. Lipid mediators and protein kinase C activation for the intracellular signaling network. J Biochem. 1994;115:1029. doi: 10.1093/oxfordjournals.jbchem.a124451. [DOI] [PubMed] [Google Scholar]
- 6.Khan WA, Blobe GC, Hannun YA. Arachidonic acid and free fatty acids as second messengers and the role of protein kinase C. Cell Sign. 1995;7:171. doi: 10.1016/0898-6568(94)00089-t. [DOI] [PubMed] [Google Scholar]
- 7.Berridge MJ, Irvine RF. Inositol triphosphate, a novel second messenger in cellular signal transduction. Nature. 1984;312:315. doi: 10.1038/312315a0. [DOI] [PubMed] [Google Scholar]
- 8.Rujoi M, Estrada R, Yappert MC. In situ MALDI-TOF MS regional analysis of neutral phospholipids in lens tissue. Anal Chem. 2004;76:1657. doi: 10.1021/ac0349680. [DOI] [PubMed] [Google Scholar]
- 9.Woods AS, Jackson SN. Brain tissue lipidomics: direct probing using matrix-assisted laser desorption/ionization mass spectrometry. The AAPS J. 2006;8:E391. doi: 10.1007/BF02854910. [DOI] [PMC free article] [PubMed] [Google Scholar]
- 10.Jackson SN, Wang H-YJ, Woods AS. In situ structural characterization of glycerophospholipids and sulfatides in brain tissue using MALDI-MS/MS. J Am Soc Mass Spectrom. 2007;18:17. doi: 10.1016/j.jasms.2006.08.015. [DOI] [PubMed] [Google Scholar]
- 11.Börner K, Malmberg P, Månsson J-E, Nygren H. Molecular imaging of lipids in cells and tissues. Intl J Mass Spectrom. 2007;260:128. [Google Scholar]
- 12.Sjövall P, Lausmaa J, Johansson B. Mass spectrometric imaging of lipids in brain tissue. Anal Chem. 2004;76:4271. doi: 10.1021/ac049389p. [DOI] [PubMed] [Google Scholar]
- 13.Touboul D, Roy S, Germain DP, Chaminade P, Brunelle A, Laprévote O. MALDI-TOF and cluster-TOF-SIMS imaging of Fabry disease biomarkers. Intl J Mass Spectrom. 2007;260:158. [Google Scholar]
- 14.Altelaar AFM, Klinkert I, Jalink K, de Lange RPJ, Adan RAH, Heeren RMA, Piersma SR. Gold-enhanced biomolecular surface imaging of cells and tissue by SIMS and MALDI mass spectrometry. Anal Chem. 2006;78:734. doi: 10.1021/ac0513111. [DOI] [PubMed] [Google Scholar]
- 15.Wiseman JM, Ifa DR, Song Q, Cooks RG. Tissue imaging at atmospheric pressure using desorption electrospray ionization (DESI) mass spectrometry. Angew Chem Int Ed. 2006;45:7188. doi: 10.1002/anie.200602449. [DOI] [PubMed] [Google Scholar]
- 16.Aerni H-R, Cornett DS, Caprioli RM. Automated acoustic matrix deposition for MALDI sample preparation. Anal Chem. 2006;78:827. doi: 10.1021/ac051534r. [DOI] [PubMed] [Google Scholar]
- 17.Jurchen JC, Rubakhin SS, Sweedler JV. MALDI-MS imaging of features smaller than the size of the laser beam. J Am Soc Mass Spectrom. 2005;16:1654. doi: 10.1016/j.jasms.2005.06.006. [DOI] [PubMed] [Google Scholar]
- 18.Garrett TJ, Prieto-Conaway MC, Kovtoun V, Bui H, Izgarian N, Stafford G, Yost RA. Imaging of small molecules in tissue sections with a new intermediate-pressure MALDI linear ion trap mass spectrometer. Intl J Mass Spectrom. 2007;260:166. [Google Scholar]
- 19.Hankin JA, Barkley RM, Murphy RC. Sublimation as a Method of Matrix Application for Mass Spectrometric Imaging. J Am Soc Mass Spectrom. 2007;18:1646. doi: 10.1016/j.jasms.2007.06.010. [DOI] [PMC free article] [PubMed] [Google Scholar]