Abstract
Novel ω-N-amino analogs of B13 (Class E) were designed, synthesized and tested as inhibitors of acid ceramidase (ACDase) and potential anticancer agents deprived of unwanted lysosomal destabilization and ACDase proteolytic degradation properties of LCL204 (Bioorg. Med. Chem. 2008:16,1015–1031).
Representative analog LCL464, (1R, 2R)-2-N- (12′-N, N-dimethylaminododecanoyl amino)-1-(4″-nitrophenyl)-1, 3-propandiol, inhibited ACDase activity in vitro, with a similar potency as B13 but higher than LCL204. LCL464 caused an early inhibition of this enzyme at a cellular level corresponding to decrease of sphingosine and specific increase of C14- and C16-ceramide. LCL464 did not induce lysosomal destabilization nor degradation of ACDase, showed increased cell death demonstrating inherent anticancer activity in a wide range of different cancer cell lines, and induction of apoptosis via executioner caspases activation. LCL464 represents a novel structural lead as chemotherapeutic agent acting via the inhibition of ACDase.
Keywords: ceramide, acid ceramidase, inhibitors, lysosomes, B13, LCL204, LCL464
1. Introduction
The stimulus-controlled pathways of sphingolipid (SPL) metabolism provide a rich network of bioactive molecules with pivotal roles in the regulation of diverse cell functions. SPL metabolites, namely ceramide (Cer) and sphingosine 1-phosphate (S1P), are increasingly being recognized for their important role as signaling molecules involved in regulation of survival, proliferation and cell death.1 Cer is known to be a key modulator of cancer cell growth and apoptosis. Conversely, S1P acts as an anti-apoptotic tumor protective agent.2 Acid ceramidase (ACDase), a lysosomal enzyme, causes degradation of Cer into sphingosine (Sph) and free fatty acids at pH optimum ~ 4.5, which distinguish it from other CDases. ACDase represents a new target for cancer therapy because of its importance in regulating the Cer-Sph-S1P inter-metabolism.3,4 Elevation of ACDase was shown in many tumor cell lines when compared to normal tissue.5 Recently we showed that inhibition of ACDase by B13, (1R, 2R)-2-N-(tetradecanoylamino)-1-(4′-nitrophenyl)-1, 3-propandiol, and its analogs induced apoptotic cell death.3 These and other data on ACDase inhibition indicate that it is a promising target in anticancer therapy because many analogs of B13 act as chemotherapeutic agents for several type of cancers.6,7
Previously, we synthesized a set of lipophilic N-acyl-amino-phenyl alcohols (aromatic analogs of Cer) acting as potent anticancer agents and confirmed that the active analogs increased endogenous Cer and inhibited CDases.8–12 B13, a potent and specific ACDase inhibitor in vitro, has been shown to induce apoptosis in many cancer cell lines.3,10–12 Tumor growth was prevented when nude mice were treated with B13 in two different aggressive human colon cancer cell lines that had metastasized to the liver without any toxicity to normal cells. 11 B13 has also been used in combination with other therapies to achieve tumors shrink in animal studies. 12 However, the inhibitory effect of B13 on ACDase cellular activity is questionable because B13, as a neutral lipophylic molecule may not specifically and efficiently reach and accumulate in the acidic compartment where its potential target is present. To improve B13 cellular targeting properties, we designed and synthesized several B13 lysosomotropic analogs with enhanced anticancer activity.7 LCL204, (1R, 2R)-2-N-(tetradecylamino)-1-(4′-nitrophenyl)-1, 3-propandiol hydrochloride, represented its closest analog. LCL204 specifically targeted lysosomes; however, it also caused induction of lysosomal destabilization and proteolytic degradation of ACDase very early in the process3,13 It can be assumed that this analog is also toxic to the normal tissues (data not published). Similar destructive effects on lysosomes and cellular ACDase were observed for D-e-Sph (data not shown).
To avoid these unwanted side effects, which were caused by the direct replacement of the N-amido group in the structure of B13 into the N-amino group in LCL204 (representing analog of N-myristyl-Sph), we developed a novel series of lysosomotropic inhibitors of ACDase without causing neither lysosomal destabilization nor degradation of ACDase.
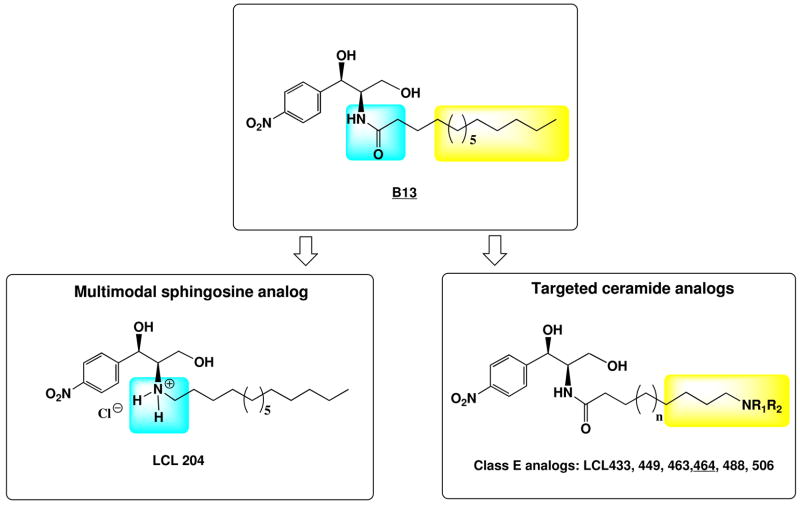
Based on the structures of the leading compounds, B13 and LCL204, and by combining structural elements of B13 (the amide bond) and LCL204 (the varied amino functions), we designed and synthesized several new analogs: LCL 433, 449, 463, 464, 488 and LCL506 (Scheme 1).
Scheme 1.
Design of the new lysosomotropic analogs of B13 and LCL204: Class E-analogs
2. Results and Discussion
2.1. Structure design and chemistry
Because the 3-dimensional structure of ACDase is not available, we developed a new class of compounds (Scheme 1) based on our extensive knowledge of molecular recognition of Cers and its analogs by CDases as their substrates.7,15,16 We proposed to synthesize a hybrid set of B13 and LCL204 analogs with the combined key structural elements of the N-amide group and the N-amino function, critical for effective molecular recognition by ACDase and targeting to lysosomal compartment.10,13 These analogs represent (1R, 2R) isomers and function differently from the primary, secondary, and tertiary amino groups introduced into the aliphatic, cyclic and heterocyclic systems: LCL463 with NH2 group representing primary amine; LCL506 and LCL488 with N-methyl and N-octyl groups respectively, representing secondary amines; and LCL464 with N,N-dimethyl group or LCL433 and LCL449 with N-imidazyl and N-morpholinyl groups respectively, representing tertiary amines. Synthetic outline for the preparation of Class E analogs is shown in Scheme 2. All synthesized model compounds were characterized by NMR, MS, confirming their structural homogeneity (listed in § Experimental).
Scheme 2.
Synthetic outline for the preparation of Class E analogs.
Reagents and conditions: (I) ω-Br-acyl chlorides, DIPEA, THF, rt; (ii) 2M ammonium in ethanol, 1.5 N NaOH, rt; (iii) methylamine, 33% in absolute ethanol, 1.5N NaOH, rt; (iv) 2M N,N-dimethylamine in THF, 1.5N NaOH, rt; (v) octylamine, THF, 1.5N NaOH, rt; (vi) imidazol, THF, 1.5 N NaOH, rt; (vii) morpholine, THF, 1.5N NaOH, rt.
2.2. Inhibitory effects on ACDase in vitro and at cellular level
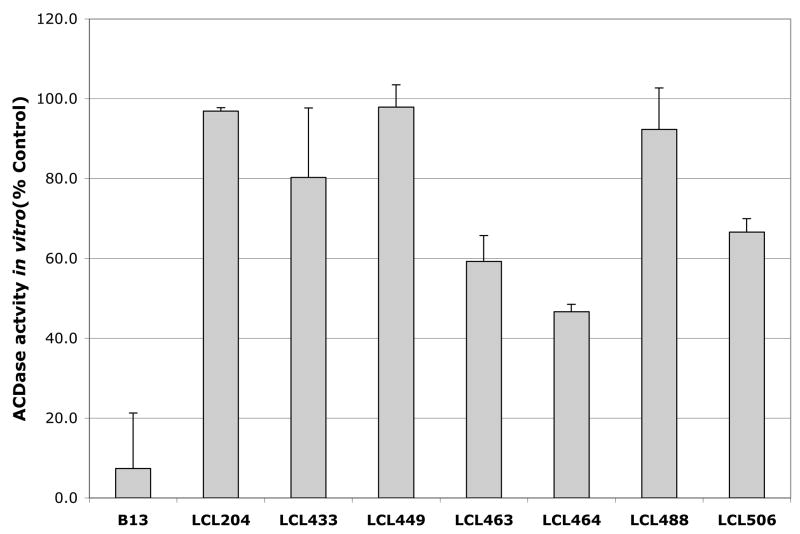
The inhibitory effects of all new analogs as compared to the action of B13 and LCL204 are shown in Fig. 1 and Fig. 2. Acidic MCF7 cell lysate was used as an enzymatic source of ACDase for the in vitro assays (listed in § Experimental). When in vitro ACDase inhibition was tested with 50μM LCL compounds (Fig.1), the highest effect was for unmodified B13 (~ 90% inhibition). Under identical conditions, LCL449 and LCL488 representing the new class E analogs similar to LCL204, showed only ~5% of inhibition. Other class E analogs inhibited ACDase efficiently with LCL464 showing the highest inhibition (55%).
Fig. 1.
Effects of 50μM Class E in comparison to B13 and LCL204 on ACDase activity in vitro. Results are presented as % Control (each dose was duplicated).
Fig. 2.
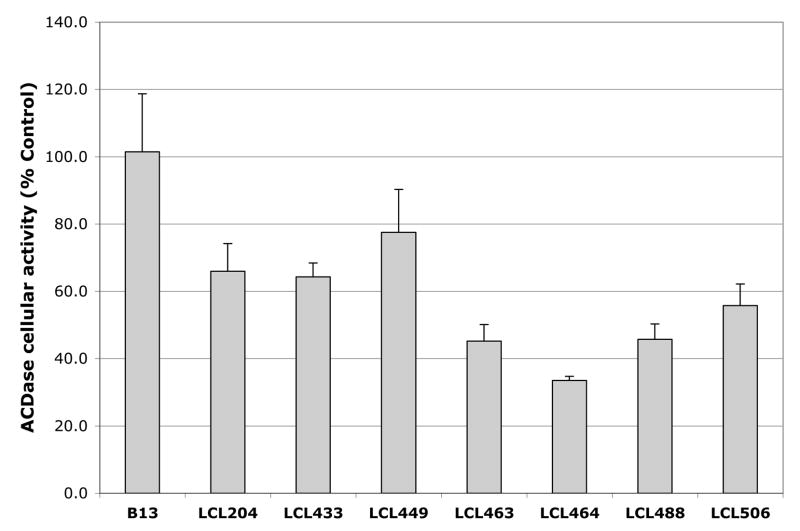
Effects of 10μM Class E, B13 and LCL204 on cellular activity of ACDase at 2 h of treatments. Results are presented as % Control (each dose was duplicated).
The effects of the LCL compounds on the cellular activity of ACDase were tested from the cells treated with the 10μM LCL analogs for 2h (listed in § Experimental). Results showed that all tested compounds had a higher potential for ACDase inhibition (Fig. 2) compared to the in vitro data (Fig.1). The highest inhibition (65%) was detected for LCL464. LCL204 caused ~ 35% inhibition. Interestingly, B13, the most potent inhibitor in vitro, did not show ACDase inhibition at the cellular level.
2.3. Corresponding effects of selected analogs on endogenous Cer species and Sph
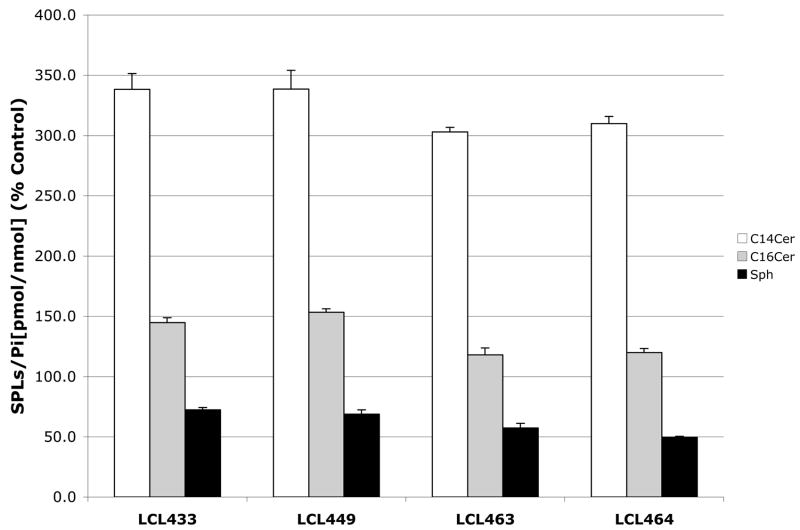
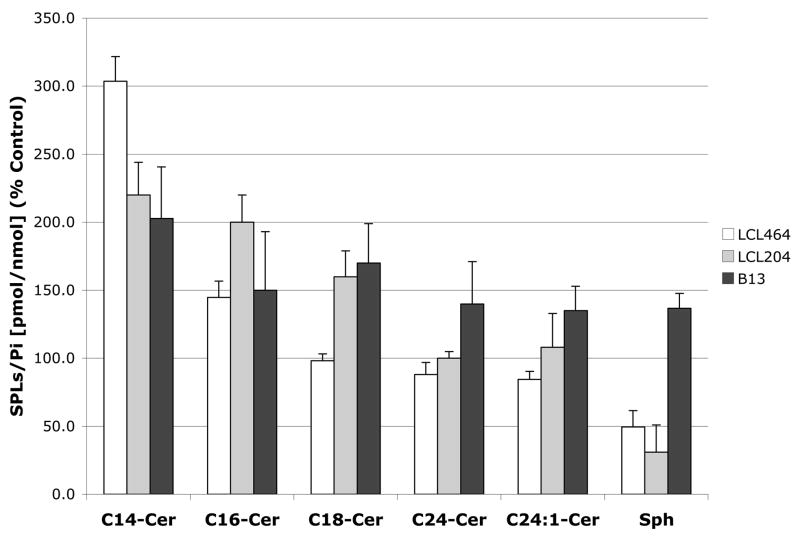
To connect the observed effects of compounds of interest on the cellular activity of ACDase to the cellular SPLs, we investigated the effects on endogenous Cer species (Cn-Cer) and Sph (a substrate and product of ACDase). The cells were treated with 10μM Class E analogs for 2h and showed only small effect on the total Cer (98%–104%, not shown). However, these analogs caused an expected decrease in Sph (50%–72%) and specific increase in C14-Cer (200%–400%) and C16-Cer (120%–150%), Fig. 3A.
Fig. 3.
Early effects of 10μM Class E analogs on Cer-Sph balance. A. Up-regulation of C14- and C16-Cer and down-regulation of Sph at 2h. B. Effect of 10μM LCL464, LCL204 and B13 on endogenous Cer species and Sph in MCF7 cells for 2 h treatment. Results are presented as % Control (each dose was duplicated).
The effects of 10μM LCL464, LCL204 and B13 treated for 2h on cellular, C14, C16, C18, C24, C24:1-Cer and Sph (Fig 3B) showed that LCL464 increased C14-Cer to 300%, C16-Cer to 143%, and decreased Sph to 50% of the control; and the amount of increase on these two Cers was balanced by a small decrease of C24- and C24:1-Cers, the major Cer component of MCF7 cells. 10μM LCL204 increased C14, C16 and C18-Cer to 220%, 200% and 160%, respectively, without changes for C24- and C24:1-Cers, and decreased Sph to 30% of the control. 10μM B13 increased all Cn-Cer to 135–200% range; interestingly, it also increased cellular level of Sph to ~ 140%.
2.4. Effects of selected analogs on lysosomal stability
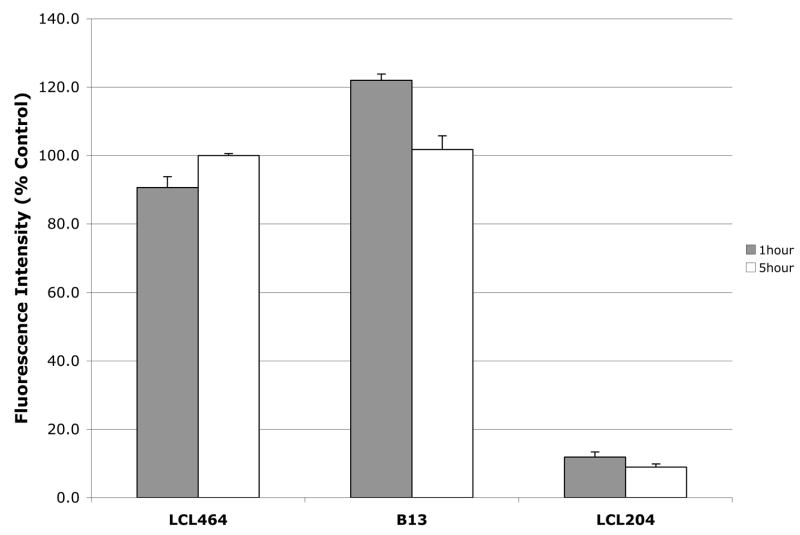
Lysosomal stability of selected compounds was shown in Fig. 4, only 10μM LCL204 caused lysosomal destabilization lowering its stability to ~ 90% when compared to the control. 10μM LCL464 had very little effect (~ 10%) on the early treatment and recovery as note in 5 h treatment. 10μM B13 did not cause lysosomal dysfunction. Although, as note for the higher concentration, LCL464 has the potential to destabilize the lysosomes; however, this dysfunction was recovered by the extended incubation time.
Fig. 4.
Effect of 10μM LCL464, B13 and LCL204 on lysosomal stability for 1 and 5h treatments.
2.5. Effects of selected analogs on acid ceramidase degradation
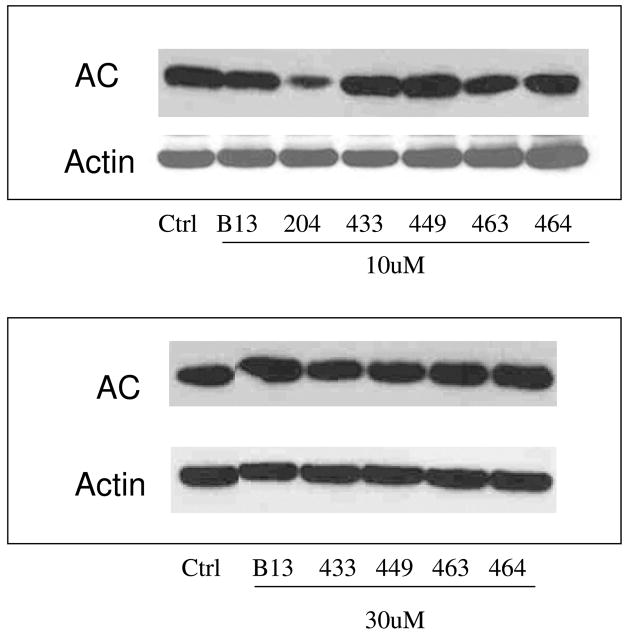
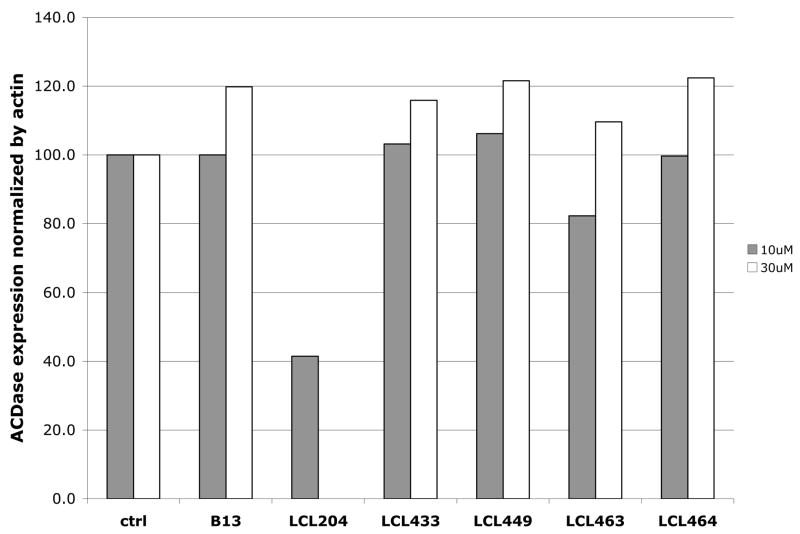
Effects of Class E analogs on ACDase expression in comparison to B13 and LCL204 were determined by Western blot (Fig. 5A) and were normalized by Actin (Fig. 5B). 10μM Class E analogs, similar to B13, did not degrade ACDase in 5hr treatments. This effect was observed only for LCL204 as previously reported.3 Furthermore, even if the concentration of Class E analogs was increased up to 50μM, the analogs still did not show any effects on ACDase degradation.
Fig. 5.
Effects of selected analogs on ACDase stability. A. Western blots of 10μM and 30μM treatments at 1h and 5h; B. Normalization by Actin.
2.6. Apoptotic effect of LCL464
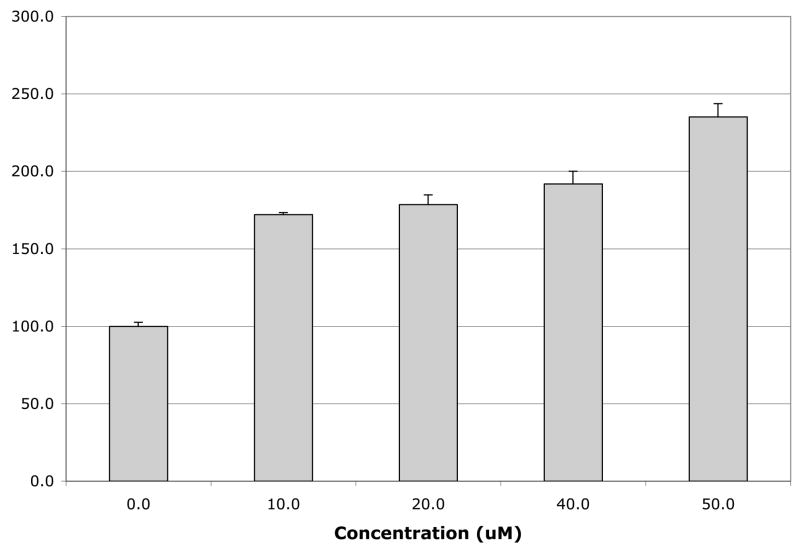
Apoptotic effect of LCL464 was investigated in MCF7 cells via its effect on Caspase 3/7, a group of cysteine proteases that mediate execution.19 Caspase 3/7 can be activated by apoptotic signals from both death receptors and intracellular/mitochondrial pathways.20 LCL464 caused a dose dependent induction of apoptosis for 24 h incubation, even increasing Caspase 3/7 activity to ~ 175% in the 10μM treatment (Fig. 6).
Fig. 6.
Effects of LCL464 on Caspase 3/7 activity at 24h.
2.7. Cellular concentration of the selected analogs
Cellular levels of the representative analogs in MCF7 cells were established by high-performance liquid chromatography-mass spectrometry (HPLC-MS) analysis.
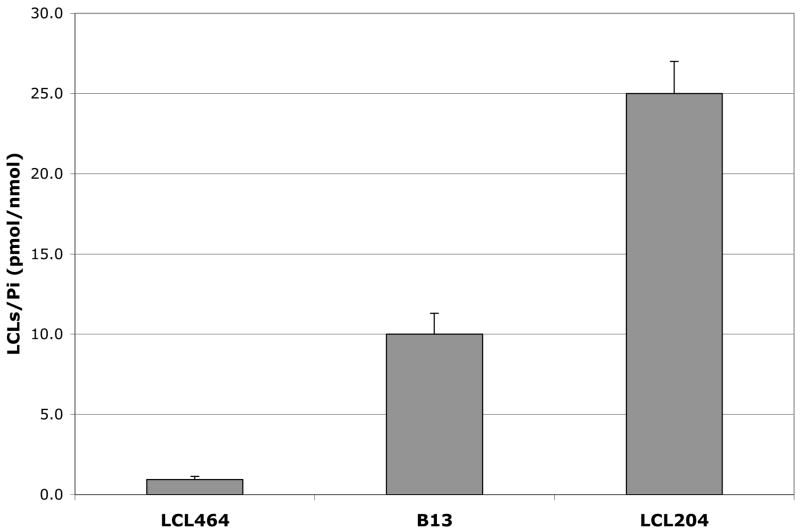
In general, cellular level of LCL464 represented only ~0.1% of the treatment applied and was much lower than the corresponding B13 and LCL204. Comparison results for 10μM treatments at 2h showed that the level of B13 was ~10x higher than LCL464, and level of LCL204 was ~ 25x higher than LCL464 (Fig.7). These differences were even more dramatic for the extended treatments when the level of LCL464 was decreased. Decrease on the cellular level of LCL464 from ~ 2–5h of treatments following its fast uptake was observed for all class E analogs, indicating on their strong binding to some receptors or, perhaps, metabolism. Some analogs, e.g. LCL463 containing the free NH2 group at ω-position, were present at a much lower levels than the corresponding LCL464 (data not shown). These results suggest that potency of LCL464 will be increased after improving its cellular delivery.
Fig. 7.
Cellular levels of 10μM LCL464, B13 and LCL204 at 2 h.
2.8. Inhibitory effects on cell growth
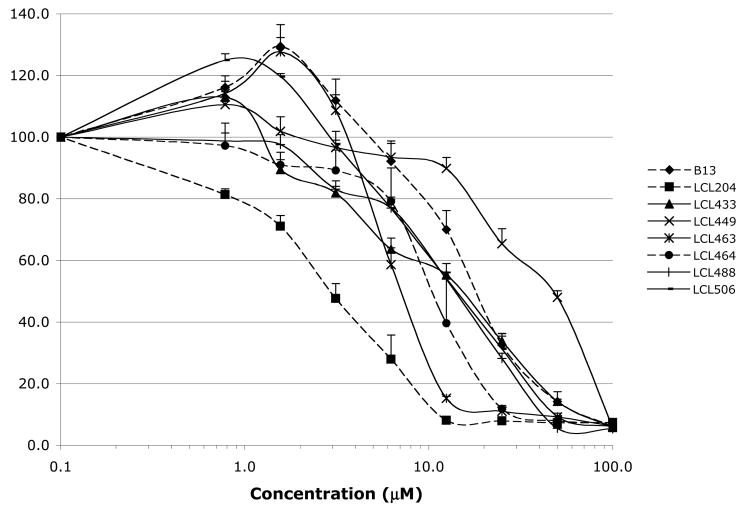
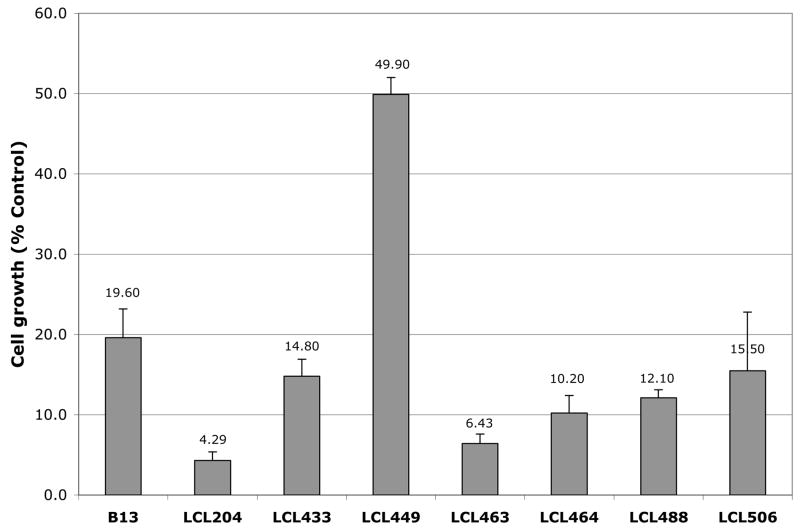
Effects of Class E analogs were examined in MCF7 breast carcinoma cells and compared to the activity of B13 and LCL204. IC50 values represent a drug concentration that reduces the cell number by 50% during incubation for 48 h, signifying the growth inhibitory power of the agents. 18 All tested analogs showed concentration-dependent cell growth inhibition shown in Fig.8A. Almost all Class E analogs, except LCL449, were more potent than B13 in tumor cells killing, but in general were less effective than LCL204. The most active analogs from Class E were LCL463 followed by LCL464. The IC50 values of Class E analogs ranged from ~6.0 – 15.5μM, except for LCL449 (49.9μM), Fig. 8B. The comparable results for LCL204 and B13 showed the following IC50 values: 4.3μM and 20.0μM, respectively.
Fig. 8.
Inhibitory effects of Class E analogs in comparison to B13 and LCL204 on MCF7 cell growth. A. Results from MTT assay at 48h. B. IC50 values at 48h.
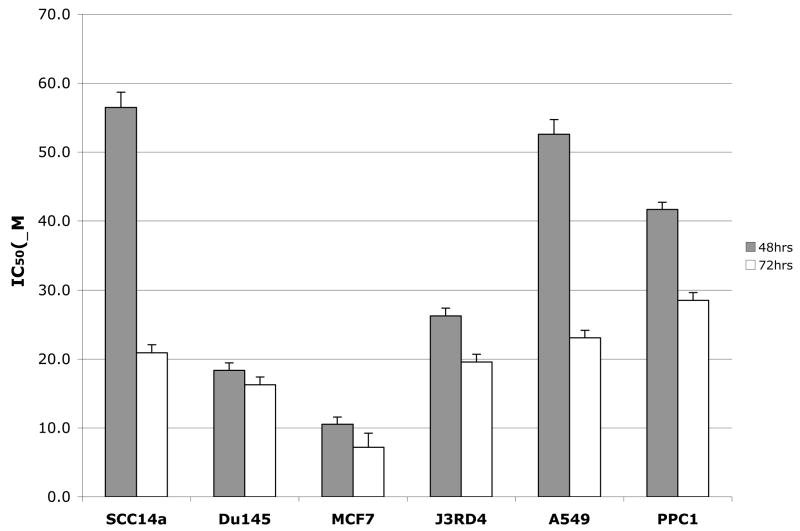
Anti-proliferate effect of LCL464 was also investigated in different tumor cell lines. When IC50 values for SCC14a (human head and neck squamous cell carcinoma) Dul45 (human prostate carcinoma, epithelial-like cell lines) J3DR4 (human melanoma), A549 (human alveolar epithelial cell), PPC1 (human prostate carcinoma) were compared to MCF7 cells (Fig 9), LCL464 showed the highest effect on growth of MCF7 cells (10.2μM and 7.2μM, respectively) for 48 and 72hr treatments. Coincidently, these effects corresponded to the levels of ACDase with the MCF7 cells having the highest ACDase protein expression detected in the same amount of the total protein (data not shown).
Fig. 9.
Inhibitory effects of LCL464 on different cancer cell lines. IC50 profile (48 and 72h).
Based on the in vitro and the cellular level results, LCL464 was selected as the most potent inhibitor of ACDase, a potent anticancer agent.
3. Summary and Conclusion
Results on B13 presented in this manuscript prove its high inhibitory effect on ACDase in vitro; however, at the cellular level, it did not inhibit this enzyme. These results correspond to our hypothesis that B13 as a neutral molecule was not able to reach lysosomal ACDase. It also corroborates the conclusion we made previously that B13 in MCF7 cells may act on some N-acyl-transferase enzymes if used at a low concentrations especially in early treatments, or as a non Cer species specific inhibitor of other CDases, similar to D-e-MAPP, a known as inhibitor of the alkaline CDase.3 Both compounds increase all Cer species and decrease Sph, if used at a high concentration.3
To improve B13 targeting to the lysosome, previously we designed and synthesized LCL204 representing Class C analogs.3 Chemical structures of these two compounds differ only in the attachment of the C14-carbon chain to the amino function of (1R, 2R) 1-(4′-nitrophenyl)-2-amino-1, 3-propandiol via the tetradecanoyl- linkage in B13 or tetradecyl- linkage in LCL204. Thus, B13 represents an aromatic analog of Cer while LCL204 represent an aromatic analog of Sph. LCL204 was able to reach ACDase, its cellular target, even after 15 min incubation, causing induction of cell death later with the IC50 value of 5μM/24h in MCF7 cells. 3 However, LCL204 also caused lysosomal destabilization and proteolytic degradation of lysosomal enzymes,3 which could be the reason for its cyto-toxic effect on normal cell lines (not shown).
Here we showed that LCL204 acted as poor inhibitor of ACDase in vitro, causing activation of this enzyme at concentration lower than 40μM (data not show). At the cellular level its inhibitory effect on ACDase was moderate because this enzyme was partially degraded by LCL204. For extended treatments, its efficacy was increased probably due to the partial recovery from lysosomal destabilization. These two parent compounds, B13 and LCL204, showed opposite effects on ACDase in vitro and on its cellular activity.
Described here, Class E analogs, a hybrid set of B13 and LCL204, having the combined key structural elements of the amide group and the N-alkylamino function, are necessary for effective molecular recognition by ACDase and targeting the lysosomal compartment, and were designed with the assumption that they would inhibit cellular ACDase without affecting lysosomal dysfunction. All Class E analogs showed inhibitory effects (moderate to low) on ACDase in vitro; however, they were less potent than B13. Class E analogs also affected cellular ACDase activity, with LCL464, 463 and LCL 488 representing the most potent inhibitors, the opposite effect of B13. However, their potency was decreased with extended treatments different from the action of LCL204. Time-dependent decrease of the hydrolytic activities of ACDase by Class E analogs may be related to the observed time-dependent increase in pH values of the lysosomes.25 The new analogs had different effects on the lysosomal dysfunction compared to the action of LCL204, causing interruption during short treatments only or in the high concentrations, however, without degradation of ACDase. In conclusion, Class E analogs represent inhibitors of ACDase acting both in vitro and on cellular levels. These analogs also cause parallel changes in cellular SPLs, decrease in Sph, increase in C14- and C16-Cers and also some decrease in C24- and C 24:1-Cers. The same profile was shown previously for LCL204 and its analogs.3
Class E analogs showed a concentration dependent MCF7 cell growth inhibition with IC50 values ranging from ~6.0 – 15.5μM, except for LCL449 (49.9μM). This compound, the (ω-morpholino-analog, showed a different profile on Sph-Cer changes for the extended treatments, causing decrease of C16-Cer and increase of Sph.25 Class E analogs enhanced the tumor cell killing potency of B13 (IC50=20μM) but were less effective than LCL204 (IC50=4.3μM). The most active analogs from Class E were LCL463 (IC50=6.4μM), followed by LCL464 (10.2μM). Results comparing the intracellular levels of B13, LCL204 and LCL464 showed that LCL464 would be much more potent if structure modification is done in order to improve its cellular delivery and to avoid its binding to the cellular protein. Synthetic work on the modified prodrugs of LCL464 is under development.
In conclusion, LCL464, a selected compound from Class E, inhibited ACDase in vitro, suggesting its recognition by the enzyme, caused neither lysosomal dysfunction nor degradation of ACDase, and showed a high and early inhibitory effect on the cellular ACDase. This effect generated proapoptotic C14- and C16-Cers resulting in cell death via apoptosis. All these results suggest that LCL464, and its close congeners, may act as novel chemotherapeutic agents through site-specific ACDase inhibition.
4. Experiment
4.1. Chemistry
All solvents, general reagents (Scheme 2) were purchased from Aldrich-Sigma & Fluka. [9,10-3H] Palmitic acid was purchased from American Radiolabeled Chemical, Inc. (St. Louis, MO). (2S, 3R, 4E) [N-3H]-C16-ceramide (specific activity: 4×10⁶cpm/nmol) and (2S, 3R, 4E) C16-ceramide were synthesized by the Lipidomic Core, Medical University of South Carolina. 21–23 B13 and LCL204 were synthesized as described previously. 7 Synthetic outline for the preparation of Class E analogs is presented here. TLC, 1H NMR and MS confirmed purity of all synthesized compounds. Reaction progress was monitored with analytical normal and reverse-phase thin layer chromatography (NP TLC or RP TLC) using aluminum sheets with 0.25 mm silica gel 60-F254 (Merck) or 0.150 mm C18-silica gel (Sorbent Technologies). Detection was performed by UV (254 nm), the PMA reagent (ammonium heptamolybdate tetrahydrate cerium sulfate, 5:2, g/g) in 125 mL of 10% H2SO4) and the Dragendorff reagent (Fluka) following heating of the TLC plates at 170 °C. Flash chromatography was performed using EM Silica Gel 60 (230–400 mesh) with the indicated eluent systems. Melting points were determined in open capillaries on an Electrothermal IA 9200 melting point apparatus and were reported uncorrected. 1H-NMR spectra were recorded on Bruker AVANCE 400MHz spectrometer equipped with Oxford Narrow Bore Magnet. Chemical shifts were reported in ppm on the δscale from the internal standard of residual chloroform (7.27 ppm) and methanol (4.87ppm). Mass spectral data were recorded in a positive ion electrospray ionization (ESI) mode on Thermo Finnigan TSQ 7000 triple quadrupole mass spectrometer. Samples were infused in a methanol solution with an ESI voltage of 4.5 kV and capillary temperature of 200 °C. Specific structural features were established by fragmentation pattern upon electrospray (ESI/MS/MS) conditions, specific for each of the compound studied.
Syntheses of Class E analogs were performed as shown in Scheme 1 via their ω-Br-analogs LCL429 and LCL509, obtained from 1 and corresponding bromoacylchlorides as previously described.7
4.1.1. Preparation of ω-Br-analogs LCL429 and LCL509
4.1.1.1. (1R, 2R)-2-N-(12′-bromododecanoylamino)-1-(4″-nitrophenyl)-1, 3-propandiol (LCL429)
Preparation of 12-bromododecanoyl chloride. 12-bromododecanoic acid (0.3g, 1.1mmol) was dissolved in dry cyclohexane (4mL) by stirring at 45°C for 20min. To this well-stirred and cooled down to rt mixture one drop of dry pyridine and oxalyl chloride (0.145mL, 1.65mmol) were added over 1min. After the addition was completed, the reaction mixture was heated to 50°C for 25min. After stirring for an additional 30min. at rt, the reaction mixture was evaporated to dryness by purging dry nitrogen gas into the reaction flask and dried under the high vacuum. The freshly prepared 12-bromododecanoyl chloride was dissolved in 3ml anhydrous THF and taken directly to the next step.
Synthesis of LCL 429. To the well-stirred mixture of (1R, 2R)-2-amino-1-(4′-nitrophenyl)-1, 3-propandiol (1mmol) in THF (10 mL) and 50% aqueous solution of sodium acetate (5mL), the freshly prepared 12-bromododecanoyl chloride (1.1 mmol) was added dropwise over 1min. After the addition was completed, the reaction mixture was stirred for another 30min at rt. The organic layer was separated and the aqueous layer was extracted with ethyl acetate (3×15ml). The combined organic extracts was dried over anhydrous MgSO4, filtered, and evaporated to dryness under reduced pressure to give crude product. This material was purified by flash column chromatography (CHCl3/MeOH, 10:1, v/v) to give pure product in 78% yield as a white microcrystalline powder, mp 53.8–55.0°C; TLC (CHCl3/MeOH, 15:1, v/v), Rf= 0.2; 1H-NMR (400MHz, CDC13) δ 8.21 (d, J= 8.4 Hz, 2H), 7.57 (d, J=8.4 Hz, 2H), 6.13 (d, J=8.0 Hz, 1H), 5.24 (s, 1H), 4.17 (m, 1H), 3.91 (S, 2H), 3.42 (t, J=7.2 Hz, 2H), 2.12 (m, 2H), 1.86 (p, J=7.2 Hz, 2H), 1.46 (m, 4H), 1.10–1.30 (m, 12H).
4.1.1.2. (1R, 2R)-2-N-(6′-bromohexanoylamino)-1-(4″-nitrophenyl)-1,3-propandiol (LCL509)
Prepared from 6-bromohexanoyl chloride and (1R,2R)-2-amino-1(4′-nitrophenyl)-1,3-propandiol as shown for LCL429. The crude product was purified by flash column chromatography (CHCl3/MeOH, 7:1, v/v) to give the pure product as white microcrystalline powder in 84% yield, mp 87.1–87.5°C. TLC (CHCl3/MeOH, 7:1, v/v), Rf=0.17, 1H-NMR (400MHz, CDCl3) δ8.17 (d, J=8.8 Hz, 2H), 7.54 (d, J=8.8 Hz, 2H), 6.31 (d, J=8.8 Hz, 1H), 5.20 (S, 1H), 4.16 (dt, J=4.8, 3.2 Hz, 1H), 3.80 (d, J=4.0 Hz, 2H), 3.35 (t, J=6.8 Hz, 2H), 2.12 (dt, J=7.2, 6.8 Hz, 2H), 1.77 (p, J=7.2 Hz, 2H), 1.48(p, J=7.6 Hz, 2H), 1.29 (h, J=7.6 Hz, 2H).
4.1.2. General procedure for the preparation of Class E analogs
Prepared from LCL429 or LCL509 and corresponding amines: ammonia, methylamine, dimethylamine, imidazol, morpholine or octylamine and purified by flash column chromatography. Briefly, to a well-stirred solution of LCL 429 or LCL509 (0.156mmol) in a mixture of 1.5N NaOH (4mL) and THF (8mL), the corresponding amine was added at room temperature. The reaction mixture was kept at rt or under reflux until the reaction was completed as monitored by TLC (CHCl3/MeOH, 10: 1, v/v). The organic layer was separated, and the aqueous layer was extracted twice with THF (2 × 5mL). The combined organic extracts were dried over anhydrous Na2SO4 and evaporated under a reduced pressure to dryness to give crude product. This material was purified by column chromatography using the suitable solvent systems to give a pure target compounds as a light yellow oils.
4.1. 2.1. (1R, 2R)-2-N-[12′-(1″-imidazol)dodecanoylamino]-1-(4‴-nitrophenyl)-1, 3-propandiol (LCL433)
Prepared from LCL429 and imidazol in 33% yield. TLC (CHCl3/MeOH/concd. NH4OH, 10: 1: 0.01, v/v/v), Rf = 0.15; 1H-NMR (400MHz, CDC13) δ 8.18 (d, J=8.4 Hz, 2H), 7.78 (s, 1H, Imidazol-H), 7.59 (d, J=8.4 Hz, 2H), 7.10 (s, 1H, Imidazol-H), 6.99 (s, 1H, Imidazol-H), 6.50 (d, J=10 Hz, 1H), 5.26 (d, J=3.2 Hz, 1H), 4.22 (m, 1H), 4.02 (t, J=6.8 Hz, 2H), 3.88 (d, J=4.4 Hz, 2H), 2.08 (t, J=7.6 Hz, 2H), 1.81 (p, J=6.8 Hz, 2H), 1.46 (p, J=7.6 Hz, 2H), 1.08–1.40 (m, 14H). ESI-MS (CH3OH, relative intensity, %) m/z 461.3 ([M+H]+, 100). Calcd for C24H36N4O5 m/z 460.27 [M].
4.1.2.2. (1R, 2R)-2-N-(12′-(1″-morpholine)dodecanoylamino]-1-(4‴-nitrophenyl)-1, 3-propandiol (LCL449)
Prepared from LCL429 and morpholine in 60% yield. TLC (CHCl3/MeOH/concd. NH4OH, 10: 1: 0.01, v/v/v). Rf= 0.12, 1H-NMR (CDCl3, 400MHz) 8.20 (d, J=8.4 Hz, 2H), 7.56 (d, J=8.4 Hz, 2H), 6.21 (d, J=8.4 Hz, 1H), 5.22 (d, J=3.2 Hz, 1H), 4.18 (m, 1H), 3.85 (t, J=4.8 Hz, 2H), 3.72 (t, J=4.8 Hz, 4H), 2.46 (abroad, 6H), 2.32(t, J=8.0 Hz, 2H), 2.10 (dt, J=7.2, 4.0 Hz, 2H), 0.92–1.50 (m, 16H). ESI-MS (CH3OH, relative intensity, %) m/z 480.3 ([M+H]+, 100). Calcd for C25H41N3O6, m/z 479.3 [M].
4.1.2.3. (1R, 2R)-2-N-(12′-aminododecanoylamino)-1-(4″-nitrophenyl)-1, 3-propandiol (LCL463)
Prepared from LCL429 and ammonia in 40% yield as a white microcrystalline powder, mp 46–48°C. TLC (CHCl3/MeOH/concd. NH4OH, 1:1: 0.01, v/v/v), Rf= 0.12; 1H-NMR (CD3OD, 400MHz) 8.13 (d, J=8.8 Hz, 2H), 7.61 (d, J=8.8 Hz, 2H), 5.10 (d, J=2.8 Hz, 1H), 4.15 (m, 1H), 3.73 (dd, J=10.8, 7.6 Hz, 1H), 3.53 (dd, J=10.8, 6.0 Hz, 1H), 3.27 (m, 2H), 2.79 (t, J=7.2 Hz, 2H), 2.04 (dt, J=7.6, 2.8 Hz, 2H), 1.56 (m, 2H), 1.00–1.40 (m, 14H). ESI-MS (CH3OH, relative intensity, %) m/z 410.3 ([M+H]+, 100). Calcd for C21H35N3O5, m/z 409.2 [M].
4.1.2.4. (1R, 2R)-2-N-(12′-N,N-dimethylaminododecanoylamino)-1-(4″-nitrophenyl)-1, 3-propandiol (LCL464)
Prepared from LCL429 and 2M dimethyl amine in THF solution in 95% yield. TLC (CHCl3/MeOH/NH4OH, 10:1: 0.01, v/v/v), Rf=0.12; 1H-NMR (CDCl3, 400MHz) 8.20 (d, J=8.8 Hz, 2H), 7.58 (d, J=8.8 Hz, 2H), 6.34(d, J=8.4 Hz, 1H), 5.21 (d, J=3.2 Hz, 1H), 4.19 (m, 1H), 3.86 (m, 2H), 2.40 (t, J=7.6 Hz, 2H), 2.31 (S, 6H), 2.12 (t, J=7.2 Hz, 2H), 1.20–1.50 (m, 18H). ESI-MS (CH3OH, relative intensity, %) m/z 438.4 ([M+H]+, 100). Calcd for C23H39N3O5, m/z 437.3 [M].
4.1.2.5. (1R, 2R)-2-N-[6′-(N′-octylamino)hexanoylamino]-1-(4″-nitrophenyl)-1, 3-propandiol (LCL488)
Prepared from LCL509 and octylamine in 32% yield. TLC (CHCl3/MeOH/NH4OH, 4:1: 0.01, v/v/v), Rf=0.23; 1H-NMR (CDC13, 400MHz) 8.12 (d, J=8.4 Hz, 2H), 7.60 (d, J=8.8 Hz, 2H), 7.32(d, J=7.8 Hz, 1H), 5.17 (d, J=3.2 Hz, 1H), 3.79 (m, 1H), 3.68 (m, 2H), 2.84 (m, 4H), 2.15 (t, J=7.6 Hz, 2H), 1.20–1.80 (m, 18H), 0.87 (t, J=7.2 Hz, 3H). ESI-MS (CH3OH, relative intensity, %) m/z 438.3 ([M+H]+, 100). Calcd for C23H39N3O5, m/z 437.2 [M].
4.1.2.6. (1R, 2R)-2-N-(12′-N-methylaminododecanoylamino)-1-(4″-nitrophenyl)-1, 3-propandiol (LCL506)
Prepared from LCL429 and 2M methylamine in THF solution in 90% yield. TLC (CHCl3/MeOH/NH4OH, 4:1: 0.01, v/v/v), Rf=0.12; 1H-NMR (CD3OD, 400MHz) 8.18 (d, J=8.8 Hz, 2H), 7.63 (d, J=8.8 Hz, 2H), 5.17 (d, J=3.2 Hz, 1H), 4.19 (m, 1H), 3.76 (dd, J=10.8, 7.6 Hz, 1H), 3.62 (dd, J=10.8, 5.6 Hz, 1H), 2.91 (t, J=8.0 Hz, 2H), 2.65 (S, 3H), 2.09 (t, J=7.2 Hz, 2H), 1.68 (m, 2H), 1.00–1.42 (m, 16H). ESI-MS (CH3OH, relative intensity, %) m/z 424.2 ([M+H]+, 100). Calcd for C22H37N3O5, m/z 423.17 [M].
4.2. Biology
4.2.1. Cell Culture
MCF7 cells (breast adenocarcinoma, pleural effusion) were purchased from American Type Culture Collection (ATCC, Rockville, MD, USA) and grown in RPMI 1640 media (Life Technologies, Inc.), supplemented with 10% FBS, 100 unit/ml penicillin, and 100 μg/ml streptomycin and maintained under standard incubator conditions (humidified atmosphere 95% air, 5% CO2 at 37C). Cells in the exponential growth phase were harvested from the cultures and used in all of experiments.
4.2.2. In Vitro Acid Ceramidase Activity Assay
Detection of the total cellular ACDase enzymatic activity was performed according to the literature. 8,24 Briefly, MCF7 cells were lysed under acidic condition [pH 4.5, contained 50mM sodium acetate, 5mM Magnesium chloride, 1mM EDTA and 0.5%Triton X-100]; and protein level was determined using BCA protein assay kit (Pierce, Rockford, IL). This cell lysate was used as ACDase enzyme resource. Equal amounts of N-[9,10-3H] D-e- C16 Cer, enzymatic substrate, were mixed with 100μL 0.2% Triton X100 and 100μL 0.4% Cholate and dried down under the nitrogen condition. All the testing compounds were dissolved in absolute ethanol to prepare a stock solution. Calculated amount of the compounds were added to the substrate in the buffer to get a certain concentration in the total of 200μl volume. The mixture was dried under nitrogen followed by addition of 30μl of DI water to each tube, vortexing and sonication to get homogenous solution and was continue by the addition of 100μl acidic assay buffer containing 0.2M acetic acid, 0.2M sodium acetate and 0.5% Triton X-100, followed by equal amount of MCF7 cell lysate and lysate buffer to bring up the total reaction volume to 200μl. The final reaction pH value was around 4.2. The reaction mixture was kept at 37°C for an hour and stopped by adding Dole’s alkaline. Extraction of the released [3H]palmitic acid, the product of the hydrolytic activity of ACDase, proceeded as described. 8,24 Quantitation of the radioactivity was performed on LS 6500 multi-purpose scintillation counter (Beckman Coulter Inc. Fullerton, CA). Results were calculated from the duplicated experiments and shown as % of control.
4.2.3. Cellular Activity of Acid Ceramidase
MCF7 cells were seeded in 100mm dishes overnight before being treated with the drugs at the indicated concentrations. Cells were then lifted by a gently scraping and lysed using acidic lyses buffer; the same operation was conducted as in vitro assay. Protein concentration was qualified using BCA protein assay kit (Pierce, Rockford, IL). The measurement of ACDase activity was performed as described under 4.2.4. Results were calculated from the duplicated experiments and shown as % of control.
4.2.4. LC-MS Analysis of Endogenous Cn-Cer and Sph
Advanced analyses of Cer species and Sph were performed by the Lipidomics Core at MUSC on a Thermo Finnigan TSQ 7000, triple-stage quadrupole mass spectrometer operating in a Multiple Reaction Monitoring (MRM) positive ionization mode as described. 3,17 Final results were expressed as the level of the particular SPLs/phospholipids (Pi) determined from the Bligh & Dyer lipid extract and expressed as SPLs/Pi (pmol/nmol).
4.2.5. Lysosomal Stability Assay
Lysosomal stability was measured using the Lysotracker Red dye DND-99 (Molecular probes, Oregon).13 Briefly, MCF7 cells were seeded 5×10⁵/well in 6 well-plate overnight. Media were removed completely, and a fresh 2% FBS media containing the same amount of either DMSO or the test compounds in DMSO solution were added and incubated at 37°C for 1 and 5 hours before adding 200nM LTR for 30 mins at 37°C. After treatments, cells were lifted with trypsin, washed twice with PBS, and resuspended in 0.5ml PBS. LTR fluorescence was measured using FACS analysis (564–606nm). Decrease in the fluorescence intensity corresponded to the increase in the lysosomal pH value, and a minimum of 10,000 events were scored for each sample. Each dose was triplicated. Results were expressed as % Control.
4.2.6. Acid Ceramidase by Western Blot
Western blots of ACDase expression levels were performed as previously described.3 Briefly, MCF7 cells were seeded in 60mm dishes overnight and treated accordingly. Then cells were lifted by gently scraping the plates, washed with cold PBS and lysed with regular lysate buffer containing protease inhibitors. Protein concentration was established using the BCA protein assay kit (Pierce, Rockford, IL). Cell lysates corresponding to 50μg of proteins per sample were separated on NuPAGE 4–12% Bis-Tris gels (Invitrogen, Carlsbad, CA) and transferred to nitrocellulose membranes (Bio-Rad, Hercules, CA). Membranes were blocked for one hour at RT in TBS containing 0.1% Tween-20 and 5% non-fat dry milk and incubated overnight at 4°C with the primary antibody mouse monoclonal anti-AC (Pharmingen, San Diego, CA). Membranes were washed 3 times with TBS-T and incubated 1 hour with the secondary antibody goat anti-mouse IgG-HRP conjugate (Sigma, St. Louis, MO). Finally, membranes were washed again, and protein bends were visualized with the super signal HRP substrate (Pierce, Rockford, IL). For each sample, ACDase protein bend was normalized by actin and result was expressed as % Control.
4.2.7. Apoptotic Assay
Apoptotic cell death was established by the Caspase 3/7 activity. Briefly, MCF7 cells were seeded at density of 5×10³/50ul/well overnight in 96 well plates (Corning, Acton, MA, USA). Then cells were treated with vehicle or diluted LCL464 at indicated concentrations in another 50ul medium. After 8h and 24h incubation, Caspases 3/7 activities were measured using Apo-ONE Homogeneous Caspase 3/7 Assay Kit according to the manufacturer’s instructions (Promega). Fluorescence was measured by a Fluostar dual Xuorescence/absorbance plate reader (BMG Laboratories, Durham, NC, USA) with 485nm excitation and 520nm Emission. Data represent mean ±SD.
4. 2. 8. Cell Viability Assay
The MTT assay was used to quantify viable MCF7 cells according to the literature.18 Briefly, MCF7 cells were seeded at a density of 5 × 10³ cells/100ul/well on the 96 well-plate, and cultured overnight to let the cell fully attached before the assay. Then, 100 μ1 of complete medium containing the same amount of either DMSO (control) or various concentrations (0.78–100 μM) of the test compounds in DMSO solution (< 0.1%) were added to the cells. After 48-h incubation, the supernatants were removed, and the MTT assay was performed according to the protocol. Cell viability was expressed as a percentage of control calculated by the formula Ad/Ac × 100, where Ad and Ac represent the absorbance of drug-treated and untreated control cells respectively. For this assay, each dose was processed with 5 time replicates, and the bar graphs shown two independent experiments. Results are expressed as % of control cells. The IC50 represents the drug concentration resulting in 50% growth inhibition compared to the control cells.
Acknowledgments
Financial support was provided by NCI Grant No. IPO1CA097132. Special acknowledgement is for NCRR Grant No. CO6RR018823 providing laboratory space for Lipidomics Shared Resource in the CRI building of MUSC. We thank Dr. Jennie Ariail for editorial assistance.
Footnotes
Publisher's Disclaimer: This is a PDF file of an unedited manuscript that has been accepted for publication. As a service to our customers we are providing this early version of the manuscript. The manuscript will undergo copyediting, typesetting, and review of the resulting proof before it is published in its final citable form. Please note that during the production process errors may be discovered which could affect the content, and all legal disclaimers that apply to the journal pertain.
References
- 1.Carpinteiro A, Dumitru C, Schenck M, Gulbins E. Cancer Lett. 2008;264:1. doi: 10.1016/j.canlet.2008.02.020. [DOI] [PubMed] [Google Scholar]
- 2.Ogretmen B, Hannun YA. Nat Rev Cancer. 2004;4:604. doi: 10.1038/nrc1411. [DOI] [PubMed] [Google Scholar]
- 3.Bielawska A, Bielawski J, Szulc ZM, Mayroo N, Liu X, Bai A, Elojeimy S, Rembiesa B, Pierce J, Norris JS, Hannun YA. Bioorg Med Chem. 2008;16:1032. doi: 10.1016/j.bmc.2007.08.032. [DOI] [PMC free article] [PubMed] [Google Scholar]
- 4.Saad AF, Meacham WD, Bai A, Anelli V, Elojeimy S, Mahdy AE, Turner LS, Cheng J, Bielawska A, Bielawski J, Keane TE, Obeid LM, Hannun YA, Norris JS, Liu X. Cancer Biol Ther. 2007;6:1455. doi: 10.4161/cbt.6.9.4623. [DOI] [PubMed] [Google Scholar]
- 5.Elojeimy S, Liu X, McKillop JC, El-Zawahry AM, Holman DH, Cheng JY, Meacham WD, Mahdy AE, Saad AF, Turner LS, Cheng J, Day T, Dong JY, Bielawska A, Hannun YA, Norris JS. Mol Ther. 2007;15:1259. doi: 10.1038/sj.mt.6300167. [DOI] [PubMed] [Google Scholar]
- 6.Liu X, Elojeimy S, Turner LS, Mahdy AE, Zeidan YH, Bielawska A, Bielawski J, Dong JY, El-Zawahry AM, Guo GW, Hannun YA, Holman DH, Rubinchik S, Szulc Z, Keane TE, Tavassoli M, Norris JS. Front Biosci. 2008;13:2293. doi: 10.2741/2843. [DOI] [PubMed] [Google Scholar]
- 7.Szulc ZM, Mayroo N, Bai A, Bielawski J, Liu X, Norris JS, Hannun YA, Bielawska A. Bioorg Med Chem. 2008;16:1015. doi: 10.1016/j.bmc.2007.08.033. [DOI] [PMC free article] [PubMed] [Google Scholar]
- 8.Bielawska A, Linardic CM, Hannun YA. J Biol Chem. 1992;267:18493. [PubMed] [Google Scholar]
- 9.Bielawska A, Perry D, Jayade S, McKay C, Shayman J, Hannun YAJ. Biol Chem. 1996;271:12642. doi: 10.1074/jbc.271.21.12646. [DOI] [PubMed] [Google Scholar]
- 10.Raisova M, Goltz G, Bektas M, Bielawska A, Riebeling C, Hossini AM, Eberle J, Hannun YA, Orfanos CE. FEBS Lett. 2002;516:47. doi: 10.1016/s0014-5793(02)02472-9. [DOI] [PubMed] [Google Scholar]
- 11.Selzner M, Bielawska A, Morse MA, Rudiger HA, Sindra D, Hannun YA, Clavien PA. Cancer Res. 2001;61:1233. [PubMed] [Google Scholar]
- 12.Samsel L, Zaidel G, Drumgoole HM, Jelovac D, Drachenberg C, Rhee JG, Brodie AMH, Bielawska A, Smith MJ. The Prostate. 2004;58:382. doi: 10.1002/pros.10350. [DOI] [PubMed] [Google Scholar]
- 13.Holman DH, Turner LS, El-Zawahry A, Elojeimy S, Liu X, Bielawski J, Szulc ZM, Norris K, Zeidan YH, Hannun YA, Bielawska A, Norris JS. Cancer Chemother Pharmacol. 2008;61:231. doi: 10.1007/s00280-007-0465-0. [DOI] [PubMed] [Google Scholar]
- 14.Karahatay S, Thomas K, Koybasi S, Senkal CE, ElOjeimy S, Liu X, Bielawski J, Day TA, Gillespie MB, Sinha D, Norris JS, Hannun YA, Ogretmen B. Cancer Lett. 2007;256:101. doi: 10.1016/j.canlet.2007.06.003. [DOI] [PMC free article] [PubMed] [Google Scholar]
- 15.Usta J, EI Bawab S, Roddy P, Szulc ZM, Hannun YA, Bielawska A. Biochemistry. 2001;40:9657. doi: 10.1021/bi010535k. [DOI] [PubMed] [Google Scholar]
- 16.Grijalvo S, Bedia C, Triola G, Casas J, LIebaria A, Teixido J, Rabal O, Levade T, Delgado A, Fabrias G. Chem Physics of Lipids. 2006;144:69. doi: 10.1016/j.chemphyslip.2006.07.001. [DOI] [PubMed] [Google Scholar]
- 17.Bielawski J, Szulc ZM, Hannun YA, Bielawska A. Methods. 2006;39:82. doi: 10.1016/j.ymeth.2006.05.004. [DOI] [PubMed] [Google Scholar]
- 18.Hansen MB, Nielsen SE, Berg K. J Immunol Methods. 1989;119:203. doi: 10.1016/0022-1759(89)90397-9. [DOI] [PubMed] [Google Scholar]
- 19.Porter AG, Janicke RU. Cell Death Differ. 1999;6:99. doi: 10.1038/sj.cdd.4400476. [DOI] [PubMed] [Google Scholar]
- 20.Riedl SJ, Shi Y. Mol Cell Biol. 2004;5:897. doi: 10.1038/nrm1496. [DOI] [PubMed] [Google Scholar]
- 21.Bielawska A, Yannun YA. Methods Enzymol. 2000;311:499. doi: 10.1016/s0076-6879(00)11102-4. [DOI] [PubMed] [Google Scholar]
- 22.Gaver KC, Sweeley CCJ. Am Chem Soc. 1966;88:3643. doi: 10.1021/ja00967a032. [DOI] [PubMed] [Google Scholar]
- 23.Bielawska A, Crane HM, Liotta D, Obeid LM, Hannun YA. J Biol Chem. 1993;268:26226. [PubMed] [Google Scholar]
- 24.Zeidan YH, Pettus BJ, Elojeimy S, Taha T, Obeid LM, Kawamori T, Norris JS, Hannun YA. J Biol Chem. 2006;281:24695. doi: 10.1074/jbc.M604713200. [DOI] [PubMed] [Google Scholar]
- 25.Bai A, Mayroo N, Bielawski J, Szulc ZM, Hannun YA, Alicja Bielawska. Chemical Target Validation of Acid Ceramidase Using Lysosomotropic Inhibitors. BMC. 2009 (manuscript under preparation) [Google Scholar]


