Abstract
Summary
Vesicular secretion of neurotransmitter is essential for neuronal communication. Kiss-and-run is a mode of membrane fusion and retrieval without the full collapse of the vesicle into the plasma membrane and de novo regeneration. The significance of kiss-and-run during efficient neurotransmission has remained in doubt. We developed an approach for loading individual synaptic vesicles with single quantum dots. Their size and pH-dependent photoluminescence change allowed us to distinguish kiss-and-run from full-collapse fusion and to track single vesicles through multiple rounds of kiss-and-run and reuse, without perturbing vesicle cycling. Kiss-and-run dominated at the beginning of stimulus trains, reflecting the preference of vesicles with high release probability. Its incidence was increased by rapid firing, a response appropriate to meet the dynamic demands of neurotransmission.
Introduction
As a keystone of neuronal communication, the exocytosis and endocytosis of synaptic vesicles may take different forms (1). In full-collapse fusion (FCF), vesicles flatten completely into the plasma membrane, lose their identity, and must be replaced eventually by newly generated vesicles (2). In contrast, transient fusion and retrieval, often called “kiss-and-run” (K&R), would preserve a limited supply of releasable vesicles for reuse (3). Although non-classical modes akin to K&R have been demonstrated in non-neuronal cells (4-8), and in a specialized calyceal synapse (9), it remains uncertain whether K&R is appreciable in small nerve terminals typical of the mammalian brain, which rely on only a few dozen releasable vesicles (8, 10). Vesicle recycling in these terminals has been studied by optical reporters like styryl dyes or synaptopHluorin (11-15). However, the limited signal-to-noise ratio (S/N) of such probes has left uncertainty about the functional impact of K&R.
Quantum dots have been widely used for applications requiring high S/N ratio (16-18). Those with peak emission at 605 nm and a diameter of ~15 nm (Fig S1A)(Qdot thereafter) provided suitable artificial cargo: small enough to fit into the vesicular lumen (~24 nm), yet large enough to be rejected by putative K&R fusion pores (1-5 nm) (9, 19). Furthermore, the pH-dependence of Qdot emission (17) would allow reporting of exocytotic events, like pHluorin-based indicators (20, 21).
Results
Imaging single Qdot-loaded vesicles
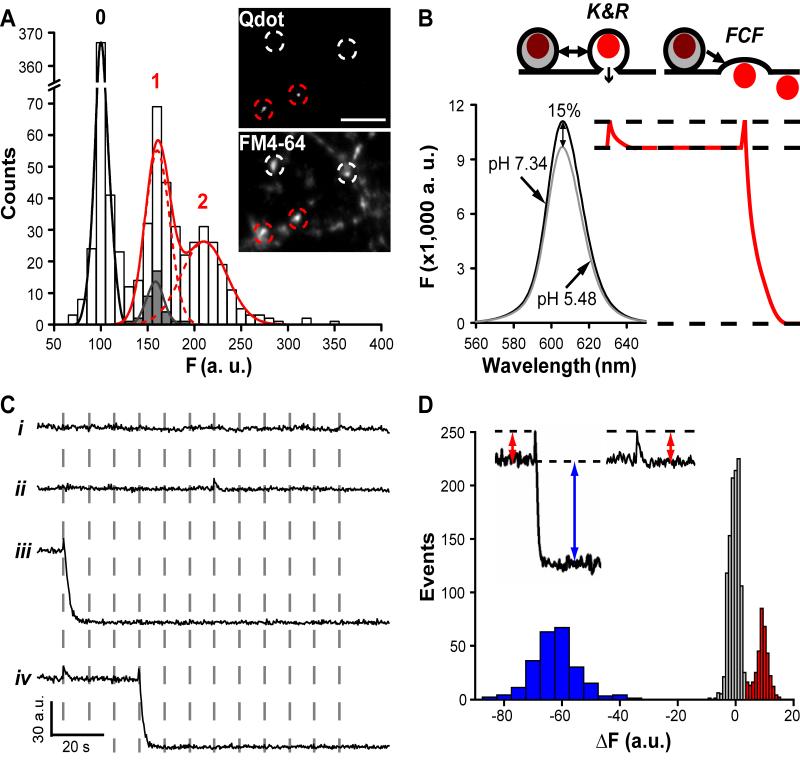
Sparse Qdot loading was accomplished by mildly stimulating neurons. Functional synapses in the Qdot images were identified by subsequent FM4-64 staining (Fig 1A). At many FM-positive synapses, the Qdot signal was close to background (p>0.10, t-test), indicating no Qdot uptake (Fig 1A). The remaining synapses (~42%) showed higher intensities, distributed in two evenly spaced peaks (Fig 1A). The interpeak spacing matched the unitary Qdot signal determined by blinking, a spontaneous intermittency of photoluminescence (22)(p>0.25, t-test). This calibration (23, 24) confirmed that peak “1” corresponded to uptake of a single Qdot per synapse.
Figure 1. Single Qdots loaded into synaptic boutons exhibit distinct patterns of photoluminescence change.
(A) Neurons stimulated (10 Hz, 1 s) with 400 nM Qdots present, then thoroughly washed. The distribution of photoluminescent intensity was measured at FM4-64-defined ROIs. Best fit obtained with three evenly spaced Gaussians (0, 1 and 2), 63.9 a.u. apart. Spacing agrees with amplitude of blinking events (grey bars; mean, 61.3±4.5 a.u)(p>0.25, t-test). Inset, circles mark functional boutons identified by FM4-64 staining, with (red) or without (white) single Qdot-loading. Scale bar=3 μm. (B) pH-dependent Qdot photoluminescence. Cartoons: hypothetical Qdot signals arising from pH-dependence. (C) Photoluminescence traces recorded during 0.1-Hz, 2-min field stimulation (dashed lines). (D) Upon stimulation, changes in Qdot signal (ΔF) could be classified as noise (gray bars, centered at 0 a.u.) or a clear positive deflection (red bars, centered at ~9 a.u., >2.5 s.d. of noise), ~15% of size of subsequent negative deflections (blue bars, centered at ~-63 a.u.).
Qdot photoluminescence was pH-dependent: increased by ~15% when pH was raised from 5.48 (intravesicular) to 7.34 (extracellular)(Fig 1B). Indeed, photoluminescence of single Qdots in pH 7.34 agarose gel (72.1±2.1 a.u., n=371) exceeded that in nerve terminals by ~15% (p<0.01, t-test), a difference reversibly nullified by perfusion with pH 5.48 solution (Fig S2C). These data suggested that synapse-loaded Qdots were harbored at pH ~5.5, presumably within synaptic vesicles, as seen directly in EM images (25).
The pH-dependence predicts distinct patterns of Qdot photoluminescence upon K&R and FCF (Fig 1B). K&R would allow protons to escape, but not the Qdot, causing transient deacidification and Qdot brightening. FCF would appear as similar Qdot brightening, followed by loss of signal as the Qdot departs.
Qdots unambiguously identify FCF and K&R
Indeed, Qdot-loaded boutons exhibited different patterns of photoluminescence upon stimulation (0.1 Hz, 2 min, Fig 1C): (i) baseline noise, (ii) a transient positive deflection (uptick), (iii) an uptick followed immediately by a negative step (downstep), and (iv) patterns ii and iii in sequence. The uptick level showed up as a distinct peak ~15% above baseline, distinct from baseline noise (Fig 1D). Amplitudes of the upticks with or without downsteps were the same (~9.9 a.u., Fig S3A). Invariably, downsteps followed an uptick, were irreversible (236/236 events, Fig S3B), and were identical in amplitude to that of single Qdots (p>0.25, t-test), consistent with disappearance of Qdots after FCF. With or without downsteps, the great majority of upticks were stimulus-locked (Fig 1C,2,3B), with latency briefer than the image acquisition interval (Fig S3C&D). Some traces (8.6%) included events that were not clearly stimulus-locked (Fig S3C), presumably reflecting spontaneous exocytosis.
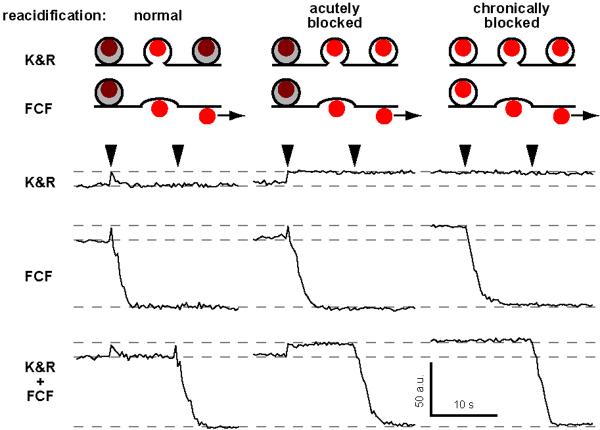
Figure 2. Upward transients in Qdot signal report pH changes within the vesicle lumen.
Cartoons: hypothesized effect of acute or chronic block of the vesicular H+-ATPase with bafilomycin A1. Without Baf (normal), Qdot photoluminescence is diminished (maroon) by acidic luminal pH (gray). Deacidification upon vesicle fusion removes this quenching and Qdot brightens (red). Acute application of Baf (acutely blocked) prevents reacidification after vesicle retrieval; chronic Baf (chronically blocked) removes all pH gradients. Experimental traces illustrate typical photoluminescence patterns under three conditions. Patterns classified as K&R, FCF, or K&R+FCF (labeled rows) based on analysis of collected data (Fig S4).
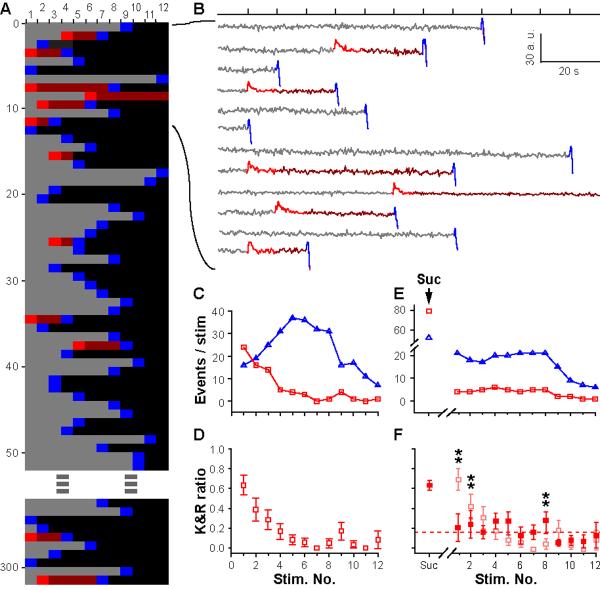
Figure 3. Prevalence of K&R changes over the course of stimulation as RRP vesicles are depleted.
(A) Raster representation of traces (n=302) from single Qdot loaded vesicles that responded to 0.1-Hz 2-min field stimulation. For each stimulus and subsequent interval, Qdot signals registered as non-response (gray), K&R (red), non-response following K&R (maroon), FCF (blue), or Qdot no longer present in ROI (black). Pooled traces from N=8 coverslips, 3 separate cultures. (B) Traces corresponding to the first 12 rasters in A. Photoluminescence changes color-coded for each stimulus and ensuing interval as in A. (C) Numbers of K&R (red square) and FCF events (blue triangle), plotted for every stimulus. (D) K&R ratio for every stimulus (N=8). Vertical bars, s.e.m. (E) Numbers of K&R (red squares) and FCF events (blue triangles), plotted for pre-stimulation hypertonic challenge (suc) and for each field stimulus. (F) Corresponding K&R ratio (filled red squares), compared with control (faded red squares, copied from C2)(**, p<0.01, χ2-test).
The upticks were probed by blocking vesicular H+ transport with bafilomycin A1 (Baf). Without Baf, all non-blank records could be classified as K&R alone, FCF alone or K&R+FCF in succession (Fig 1C and 2). With acute exposure to Baf, which spares the pre-exocytotic pH gradient but prevents post-exocytotic reacidification (25), isolated upticks were replaced by persistent increases (upsteps) of the same amplitude (10.47±1.14 a.u., n=49). This was expected if Qdots remained in post-K&R vesicles failing to reacidify. After an upstep, subsequent uptick-downsteps were replaced by simple downstep, 73.6±3.4 a.u. (n=157), 115% of the basal Qdot signal. After a 1-hr Baf incubation, which abolishes both existing pH gradient and vesicular reacidification (26), pre-stimulation photoluminescence rose to ~115% of control, and no further increase was ever observed upon stimulation; all downsteps proceeded without a prior uptick. The amplitudes of upticks, upsteps and downsteps showed expected interrelationships (Fig S4). Importantly, upsteps were never observed in the absence of Baf, contrary to expectations if Qdots externalized by FCF had clung on long enough to be recaptured by conventional endocytosis (τ estimated as 14, 17 and 48 s in refs. 13, 14, 27). Instead, the upticks can be attributed to vesicular retention of the Qdot and reacidification upon closure of a fusion pore.
This interpretation was tested further by increasing external pH buffering with 50 mM Tris instead of 10 mM HEPES (pHo always 7.3). If Tris entered the vesicle and remained sequestered along with the Qdot, luminal reacidification should be slowed (12). Indeed, the uptick decay was longer (p<0.01, t-test, Fig S5A). In contrast, the time course of uptick-downsteps remained unchanged with Tris (Fig S5B), as expected for externalized Qdots.
Tracking the motion of single Qdots during and after fusion (Movie S1) buttressed our interpretation of the two kinds of Qdot signals (Supplementary material text). Downsteps were always associated with the Qdot moving out of synapses (Fig S6); the diffusion coefficient, D=1.7±0.1μm2/s, resembling that of Qdots tethered to membrane proteins (28). In contrast, in uptick-alone, Qdots remained close to their position at the moment of fusion (displacement, 50±6 nm, n=43), consistent with K&R as “retrieval on the spot” (29). Was the Qdot-reported K&R inadvertently promoted by Qdot adherence? Previous findings with FM4-64 co-loaded with Qdots argued against this idea (25). For further verification, we monitored vesicle cycling using pHluorin-tagged vesicular glutamate transporter1 (30), but found no difference in vesicle dynamics before, during or after maximal loading with Qdots (Fig S7).
Timing and prevalence of K&R and FCF
The all-or-none nature of Qdot uptake allowed us to track a single vesicle in the total recycling pool (TRP) until its final FCF. Labeling of individual vesicles in TRP was obtained with strong stimulation (10 Hz, 2 min) at low Qdot concentration (4 nM). Among 793 vesicles in single-Qdot-loaded boutons, 302 exhibited fusion, and are represented as raster lines (Fig 3A); the others showed no fusion with field stimulation but only with later high K+ challenges. 292 of the 302 vesicles fused upon field stimulation. Of these, 13 showed one K&R; 58 showed one K&R followed by a FCF; 1 showed two K&R events; and 220 showed FCF only. Thus, K&R occurred in ~25% of all vesicles and accounted for 21% of all fusion events over the field stimulation.
Intriguingly, the prevalence of K&R and FCF was dependent on stimulus number. K&R events were predominant initially (63.4±9.9% at first stimulus), but became less prevalent as stimulation continued (Fig 3C), falling to <10% later in the train (Fig 3E). Mindful that Qdots can report FCF following K&R but not vice versa, we examined first-fusion events specifically, and found the same trend.
K&R is favored by RRP vesicles
What is the basis of the decaying K&R ratio? One possibility is that vesicles with higher Pr/v, namely RRP vesicles, prefer K&R (31, 32). Alternatively, the shift in fusion modes might arise from a cumulative effect of electrical activity, independent of Pr/v. To test these ideas, we prefaced field stimulation with a hypertonic challenge, to selectively mobilize RRP vesicles without electrical activity or Ca2+ elevation (33). Rapid application of Tyrode+500 mM sucrose for 10 s caused vesicular turnover, reflected by upticks and uptick-downsteps whose peak-aligned averages were virtually identical to corresponding responses to electrical stimulation. The two types of events were similarly timed (p>0.1, K-S test), clustered between 1-7 s after the hypertonic challenge started. The hypertonic challenge elicited more K&R than FCF (Fig 3E), yielding a K&R ratio (0.63±0.05) like that found with the first field stimulus. During the subsequent electrical stimulation, the numbers of K&R and FCF events held steady, then fell in parallel as Qdot-labeled vesicles were depleted (Fig 3E). Consequently, the K&R ratio stayed at ~15% during the whole stimulus train (Fig 3F). Thus, RRP-resident vesicles displayed a strong propensity for K&R, but once-fused RRP vesicles and vesicles freshly recruited from the reserve pool were less K&R-favorable, thus accounting for the observed drop in K&R ratio.
K&R increases upon rapid stimulation
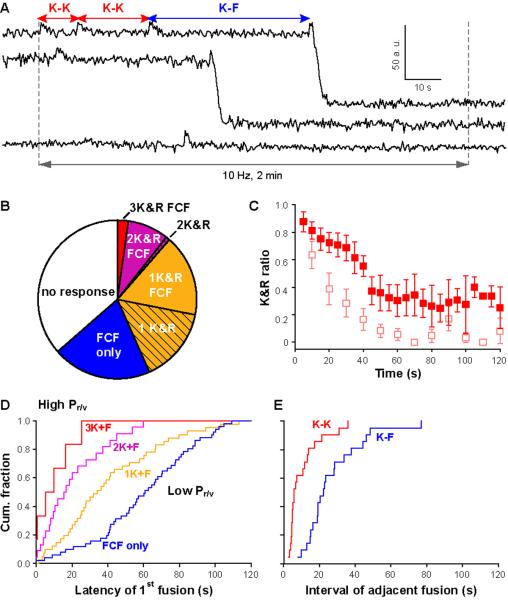
Hippocampal neurons often fire in bursts with intraburst frequencies far greater than 0.1 Hz. A key question is whether the balance between modes of fusion tilts when neurotransmission intensifies. Accordingly, we applied 10-Hz, 2-min field stimulation after single Qdots had been loaded into the TRP. Fusion rate clearly increased (Fig 4A). Qdot-loaded vesicles were sorted according to their behavior during the stimulation (Fig 4B). Again, the prevalence of K&R started high but fell with continual stimulation (Fig 4C). The initial contribution of K&R was significantly greater at 10 Hz (~88%) than at 0.1 Hz (~62%, p<0.05, t-test); likewise for the later steady level of K&R prevalence (~30% vs. 10%; p<0.05, t-test). Among Qdot-labeled vesicles responding to electrical stimulation, 68% supported one or more K&R events, considerably more than with 0.1 Hz stimulation, and likely extending beyond the RRP (<30% of vesicles) (11, 32, 33). At 10 Hz, individual vesicles supported as many as three rounds of K&R before a final FCF (Fig 4A). Various combinations of fusion/retrieval events were observed (Fig 4B).
Figure 4. Up-modulation of K&R prevalence with intense stimulation.
(A) Sample traces from Qdot-loaded vesicles. (B) Categorization of vesicles with different fusion behaviors. (C) The K&R ratio during 10-Hz 2-min stimulation (analyzed with 5 s time bins to improve S/N) was significantly higher than that during 0.1-Hz stimulation (faded symbols, data from Fig 4C2). (D) Latency of first fusion in the different categories (same color coding as B). Each plot normalized by the number of vesicles in that category. The higher its Pr/v, the more K&R events a vesicle could support (Pr/v=0.051, 0.023, 0.010 and 0.001 for 3K+F, 2K+F, K+F and FCF only, respectively). (E) the interval between 2 consecutive K&R events (K-K, red) was significantly shorter than that between K&R and a subsequent FCF of the same vesicle (K-F, blue)(p<0.01, K-S test).
To clarify the increase in reuse, we sorted Qdot-loaded vesicles according to overall performance and plotted the respective latencies to first fusion. Of the vesicles undergoing FCF alone, ~84% fused with a delay of >30 s, late enough to ensure that they originated from the reserve pool rather than the RRP (11, 32). In contrast, all vesicles generating 3 K&R events first fused within <30 s. Overall, the earlier the first fusion of a vesicle (higher Pr/v), the more K&R it supported (Fig 4D). This was not simply due to a longer time span from stimulation onset to final FCF because this span was independent of the number of K&R events (Fig S8). Instead, residence in the RRP (and high Pr/v) favors K&R, in agreement with findings with hypertonic challenges (Fig 3E&F).
How soon after K&R can a vesicle be reused under rapid stimulation? We focused on cases wherein two consecutive K&R events were followed by FCF, to obtain a balanced comparison between K-K and K-F intervals. K-K intervals (Fig 4E) were briefer (shortest, 2.67 s; median, 5.67 s; average, 10.26±2.04 s), and faster than the classic exocytosis/endocytosis cycle in hippocampal terminals (8). In contrast, the K-F interval (Fig 4E) was ~3-fold longer than the K-K interval (median, 22.3 s; average, 26.8±3.6 s), However, the K-F interval was 3-fold faster than the latency to FCF only (~60 s); vesicles undergoing reuse by FCF after K&R still enjoyed a big kinetic advantage over unused vesicles destined for FCF.
Rapid reacidification and activity-dependent fusion pore open time
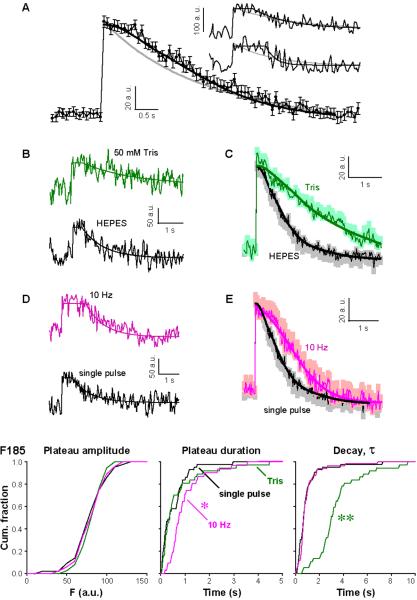
For functional advantage, speedy reuse of vesicles must be complemented by prompt fusion pore closure and fast reacidification, to allow vesicular refilling with neurotransmitter (34) and avoid “shooting blanks”. Using 30 Hz imaging, we found that once the Qdot signal increased upon stimulation (single pulse, inter-trial interval was ~20s), it remained at the highest level for a variable time before returning to baseline (Fig 5A inset). Such a plateau was expected while the fusion pore remained open. Indeed, experimental traces were better fitted with a plateau preceding a single exponential decay than with an exponential alone (Fig 5A). The median plateau duration was 0.367 s (average, 0.527±0.085 s, n=43) and the median time constant of decay was 0.69 s (average, 0.95±0.18 s, n=43). To verify the separation of plateau and decay phases, we again applied 50 mM Tris (Fig 5B&C). The Qdot signal showed the same amplitude and plateau duration as in HEPES (Fig 5F both p>0.5, K-S test) while the decay was slowed (Fig 5F, p<0.01, K-S test) as also seen with low-frequency imaging (Fig S5A). The buffer-insensitivity of the plateau amplitude and duration confirmed that the plateau represented the period preceding vesicle reacidification.
Figure 5. High-speed imaging of Qdots reveals adjustable fusion pore open time but constant vesicle reacidification rate with different levels of activity.
(A) Insets, samples taken in normal Tyrode with single shocks, inter-stimulus interval >20 s. Two types of fits were overlaid: a single exponential decay (gray), and a plateau followed by an exponential (black), the latter fitting significantly better even after statistical penalization for the extra parameter (AIC score, -60.5; p<0.001). Comparison of pooled data (black symbols, n=43), and averages of the two kinds of fits (gray and black). (B) Samples in 50 mM Tris (green) and in 10 mM HEPES (black). (C) Corresponding pooled data in Tris (n=37) and in HEPES (same as A). (D) Samples (normal Tyrode) with 10-Hz (pink) and single-pulse stimulation (black). Smooth lines, corresponding fits as above. (E) Pooled data taken with 10 Hz (n=46) and single pulse stimulation (same as A). (F) Cumulative distributions of fit parameters. Plateau amplitude: distributions were not different (all p>0.1, K-S test); plateau duration: only distribution for 10-Hz stimulation was longer (p<0.01, K-S test); Decay τ: only distribution for 50 mM Tris was slower (p<0.01, K-S test).
Because H+ transport is the likely rate-limiting step for transmitter refilling (1, 34), full re-establishment of ΔpH suggests that transmitter refilling was also nearly complete. Our direct measurements of the rate of vesicle reacidification are faster than most previous estimates (13, 14), with one exception (12). To probe whether fusion pore open time and vesicle reacidification rate are subject to change, we applied 10-Hz 5-s stimulation. The plateau became longer (Fig 5D&E), but both plateau amplitude and τdecay remained unaltered (Fig 5F). Thus, reacidification proceeded rapidly at 10 Hz (τdecay=0.99±0.12 s, n=46), just as it did at low frequency. The frequency-dependent lengthening of plateau duration developed gradually during the 10-s stimulation train (p<0.01, Pearson correlation test), indicating again that fusion pore gating was under physiological control.
Discussion
Using Qdots, we developed a method to distinguish multiple fusion modes with sharply different optical signals and single event resolution and thus clarified uncertainty about K&R at small CNS nerve terminals (11-14, 26, 35). As indivisible nanoparticles, Qdots could label individual vesicles in either RRP or reserve pool, allowing us to monitor them without loss of signal continuity or amplitude through multiple rounds of reuse. In future, Qdots of different sizes and colors could be used to manipulate vesicular volume available for neurotransmitter or to track different vesicles. Furthermore, Qdots might be engineered to give a larger pH-dependent signal and to permanently attach to presynaptic membrane, enabling long-term tracking of presynaptic activity in situ.
By tracking Qdots, we found that K&R gradually gave way to FCF as the dominant fusion mode during a stimulus train, contrary to the fixed ratio assumed previously (26). Consequently, K&R and FCF can each be predominant under different conditions. K&R appears most prominent under high activity demand. FCF outweighs K&R under steady-state stimulation at low rates, conditions typical of studies in which K&R has been difficult to detect (13, 14, 35).
The duration of fusion pore opening (527±85 ms) was in good agreement with the capacitance measurements in the Calyx of Held (9) and chromaffin cells (36). A 0.5-s opening would easily allow complete emptying of small neurotransmitters. Further study is needed to determine whether flickering or gradual widening of the fusion pore (37, 38) ever allows gradual release of neurotransmitter and postsynaptic receptor desensitization. K&R confers multiple functional advantages. Some RRP vesicles could fuse up to four times, allowing more efficient recycling, particularly with the intermittent patterns of burst firing found for hippocampal neurons in vivo. The rate of vesicle reuse we recorded was much faster than previously estimated (11), a kinetic advantage if reuse of the same vesicle is alternative to readying a fresh vesicle at the same release site. Nevertheless, the shortest interval between successive fusion events still left enough time for nearly complete reacidification (and by inference, replenishment with neurotransmitter), consistent with preservation of quantal size even at high firing rates (39).
With regard to synaptic variability, repeatedly reusing a small population of vesicles in successive bursts (11) would reduce variations in neurotransmitter content arising from differences in vesicle volume or in luminal transmitter concentration (34). Reemploying the same release site would also lower “release location dependent variability” (40). In both ways, reuse would improve fidelity of information transfer during neurotransmission.
Supplementary Material
Acknowledgments
We thank N.C. Harata for help with high frequency imaging, data analysis; members of the Tsien lab for comments; J.W. Mulholland and J.J. Perrino at the Stanford Cell Sciences Imaging Facility for help with imaging; X. Gao and M. Bruchez for consultation on quantum dots. This work was supported by grants from Grass Foundation (Q. Zhang), NIMH and the Burnett family fund (R.W. Tsien).
References and Notes
- 1.Sudhof TC. Annu Rev Neurosci. 2004;27:509. doi: 10.1146/annurev.neuro.26.041002.131412. [DOI] [PubMed] [Google Scholar]
- 2.Heuser JE, Reese TS. J Cell Biol. 1973;57:315. doi: 10.1083/jcb.57.2.315. [DOI] [PMC free article] [PubMed] [Google Scholar]
- 3.Fesce R, Grohovaz F, Valtorta F, Meldolesi J. Trends Cell Biol. 1994;4:1. doi: 10.1016/0962-8924(94)90025-6. [DOI] [PubMed] [Google Scholar]
- 4.de Toledo G. Alvarez, Fernandez-Chacon R, Fernandez JM. Nature. 1993;363:554. doi: 10.1038/363554a0. [DOI] [PubMed] [Google Scholar]
- 5.Artalejo CR, Henley JR, McNiven MA, Palfrey HC. Proc Natl Acad Sci U S A. 1995;92:8328. doi: 10.1073/pnas.92.18.8328. [DOI] [PMC free article] [PubMed] [Google Scholar]
- 6.Taraska JW, Perrais D, Ohara-Imaizumi M, Nagamatsu S, Almers W. Proc Natl Acad Sci U S A. 2003;100:2070. doi: 10.1073/pnas.0337526100. [DOI] [PMC free article] [PubMed] [Google Scholar]
- 7.Fulop T, Radabaugh S, Smith C. J Neurosci. 2005;25:7324. doi: 10.1523/JNEUROSCI.2042-05.2005. [DOI] [PMC free article] [PubMed] [Google Scholar]
- 8.Smith SM, Renden R, von Gersdorff H. Trends Neurosci. 2008;31:559. doi: 10.1016/j.tins.2008.08.005. [DOI] [PMC free article] [PubMed] [Google Scholar]
- 9.He L, Wu XS, Mohan R, Wu LG. Nature. 2006;444:102. doi: 10.1038/nature05250. [DOI] [PubMed] [Google Scholar]
- 10.An S, Zenisek D. Curr Opin Neurobiol. 2004;14:522. doi: 10.1016/j.conb.2004.08.008. [DOI] [PubMed] [Google Scholar]
- 11.Aravanis AM, Pyle JL, Tsien RW. Nature. 2003;423:643. doi: 10.1038/nature01686. [DOI] [PubMed] [Google Scholar]
- 12.Gandhi SP, Stevens CF. Nature. 2003;423:607. doi: 10.1038/nature01677. [DOI] [PubMed] [Google Scholar]
- 13.Granseth B, Odermatt B, Royle SJ, Lagnado L. Neuron. 2006;51:773. doi: 10.1016/j.neuron.2006.08.029. [DOI] [PubMed] [Google Scholar]
- 14.Balaji J, Ryan TA. Proc Natl Acad Sci U S A. 2007;104:20576. doi: 10.1073/pnas.0707574105. [DOI] [PMC free article] [PubMed] [Google Scholar]
- 15.Chen X, Barg S, Almers W. J Neurosci. 2008;28:1894. doi: 10.1523/JNEUROSCI.4518-07.2008. [DOI] [PMC free article] [PubMed] [Google Scholar]
- 16.Alivisatos AP, Gu W, Larabell C. Annu Rev Biomed Eng. 2005;7:55. doi: 10.1146/annurev.bioeng.7.060804.100432. [DOI] [PubMed] [Google Scholar]
- 17.Gao X, Chan WC, Nie S. J Biomed Opt. 2002;7:532. doi: 10.1117/1.1506706. [DOI] [PubMed] [Google Scholar]
- 18.Heine M, et al. Science. 2008;320:201. doi: 10.1126/science.1152089. [DOI] [PMC free article] [PubMed] [Google Scholar]
- 19.Jackson MB, Chapman ER. Annu Rev Biophys Biomol Struct. 2006;35:135. doi: 10.1146/annurev.biophys.35.040405.101958. [DOI] [PubMed] [Google Scholar]
- 20.Miesenböck G, De Angelis DA, Rothman JE. Nature. 1998;394:192. doi: 10.1038/28190. [DOI] [PubMed] [Google Scholar]
- 21.Sankaranarayanan S, Ryan TA. Nat Cell Biol. 2000;2:197. doi: 10.1038/35008615. [DOI] [PubMed] [Google Scholar]
- 22.Nirmal M, et al. Nature. 1996;383:802. [Google Scholar]
- 23.Howarth M, Takao K, Hayashi Y, Ting AY. Proc Natl Acad Sci U S A. 2005;102:7583. doi: 10.1073/pnas.0503125102. [DOI] [PMC free article] [PubMed] [Google Scholar]
- 24.Cui B, et al. Proc Natl Acad Sci U S A. 2007;104:13666. doi: 10.1073/pnas.0706192104. [DOI] [PMC free article] [PubMed] [Google Scholar]
- 25.Zhang Q, Cao Y-Q, Tsien RW. Proc Natl Acad Sci U S A. 2007;104:17843. doi: 10.1073/pnas.0706906104. [DOI] [PMC free article] [PubMed] [Google Scholar]
- 26.Harata NC, Choi S, Pyle JL, Aravanis AM, Tsien RW. Neuron. 2006;49:243. doi: 10.1016/j.neuron.2005.12.018. [DOI] [PubMed] [Google Scholar]
- 27.Mueller VJ, Wienisch M, Nehring RB, Klingauf J. J Neurosci. 2004;24:2004. doi: 10.1523/JNEUROSCI.4080-03.2004. [DOI] [PMC free article] [PubMed] [Google Scholar]
- 28.Dahan M, et al. Science. 2003;302:442. doi: 10.1126/science.1088525. [DOI] [PubMed] [Google Scholar]
- 29.Valtorta F, Meldolesi J, Fesce R. Trends Cell Biol. 2001;11:324. doi: 10.1016/s0962-8924(01)02058-x. [DOI] [PubMed] [Google Scholar]
- 30.Voglmaier SM, et al. Neuron. 2006;51:71. doi: 10.1016/j.neuron.2006.05.027. [DOI] [PubMed] [Google Scholar]
- 31.Stevens CF, Williams JH. Proc Natl Acad Sci U S A. 2000;97:12828. doi: 10.1073/pnas.230438697. [DOI] [PMC free article] [PubMed] [Google Scholar]
- 32.Pyle JL, Kavalali ET, Piedras-Renteria ES, Tsien RW. Neuron. 2000;28:221. doi: 10.1016/s0896-6273(00)00098-2. [DOI] [PubMed] [Google Scholar]
- 33.Rosenmund C, Stevens CF. Neuron. 1996;16:1197. doi: 10.1016/s0896-6273(00)80146-4. [DOI] [PubMed] [Google Scholar]
- 34.Edwards RH. Neuron. 2007;55:835. doi: 10.1016/j.neuron.2007.09.001. [DOI] [PubMed] [Google Scholar]
- 35.Fernandez-Alfonso T, Ryan TA. Neuron. 2004;41:943. doi: 10.1016/s0896-6273(04)00113-8. [DOI] [PubMed] [Google Scholar]
- 36.Chan SA, Smith C. J Physiol. 2001;537:871. doi: 10.1111/j.1469-7793.2001.00871.x. [DOI] [PMC free article] [PubMed] [Google Scholar]
- 37.Staal RG, Mosharov EV, Sulzer D. Nat Neurosci. 2004;7:341. doi: 10.1038/nn1205. [DOI] [PubMed] [Google Scholar]
- 38.Choi S, Klingauf J, Tsien RW. Philos Trans R Soc Lond B Biol Sci. 2003;358:695. doi: 10.1098/rstb.2002.1249. [DOI] [PMC free article] [PubMed] [Google Scholar]
- 39.Zhou Q, Petersen CC, Nicoll RA. J Physiol. 2000;525:195. doi: 10.1111/j.1469-7793.2000.t01-1-00195.x. [DOI] [PMC free article] [PubMed] [Google Scholar]
- 40.Franks KM, Stevens CF, Sejnowski TJ. J Neurosci. 2003;23:3186. doi: 10.1523/JNEUROSCI.23-08-03186.2003. [DOI] [PMC free article] [PubMed] [Google Scholar]
Associated Data
This section collects any data citations, data availability statements, or supplementary materials included in this article.


