

Summary
To understand lymphocyte behavior in the brain, 2-photon microscopy was used to visualize effector CD8+ T cells during toxoplasmic encephalitis. These cells displayed multiple behaviors with two distinct populations of cells apparent: one with a constrained pattern of migration versus a highly migratory subset. The proportion of these populations varied over time associated with changes in antigen availability as well as T cell expression of the inhibitory receptor PD1. Unexpectedly, the movement of infiltrating cells was closely associated with an infection-induced reticular system of fibers. This observation suggests that, whereas in other tissues there are pre-existing scaffolds that guide lymphocyte migration, in the brain specialized structures are induced by inflammation that guide migration of T cells in this immune-privileged environment.
Introduction
Technical advances in microscopy combined with the availability of fluorescently labeled leukocytes has allowed intra-vital imaging of immune cells and quantification of their behavior in real time (for review see (Bajenoff et al., 2007; Halin et al., 2005)). Initial studies that examined the behavior of T cells following challenge with model antigens led to the recognition that T cells conduct many short-term interactions with DCs presenting cognate antigen that results in a progressive change in T cell behavior before a final long-term contact (Beltman et al., 2007; Miller et al., 2004; Miller et al., 2002; Stoll et al., 2002). Furthermore, T cell migration within the lymph node is not as random as it first appears, and there is evidence that cells migrate along a cellular network generated by fibroblastic reticular cells and follicular dendritic cells (FRC and FDC) on a backbone of extracellular matrix (Bajenoff et al., 2007). These types of structures are not restricted to lymphoid organs and there is evidence that similar scaffolds guide migration of immune cells in other sites (Egen et al., 2008; Mrass et al., 2006). In lymphoid tissues, these matrixes are coated with chemokines such as CCL21 which provide the motogenic stimulus for T cell migration (Asperti-Boursin et al., 2007; Bajenoff et al., 2007; Okada and Cyster, 2007; Worbs et al., 2007). While the studies described above focused on visualizing lymphocyte activities in lymph nodes, there is work that examined how these cells behave in peripheral tissues (Flugel et al., 2001; Geissmann et al., 2005; Kawakami et al., 2005; Zinselmeyer et al., 2005). Similarly, the majority of studies on infection have examined T cell behavior in lymphoid tissues (Hickman et al., 2008; Junt et al., 2007; Khanna et al., 2007; Norbury et al., 2002), with a recent report on CD4+ T cell migration associated with mycobacterial granulomas in the liver (Egen et al., 2008).
The brain provides unique challenges for the development of inflammation. This organ lacks lymphatics, resident cells are MHC low and the blood brain barrier (BBB) limits antibody entry (Barker and Billingham, 1977; Cserr and Knopf, 1992; Medawar, 1948). Moreover, entry of T cells into the brain is tightly regulated and T cells are rare in this site. However, in response to infection or during autoimmunity T cells can access the CNS, and studies using myelin specific T cells have shown that during EAE transferred CD4+ T cells invade in a single wave (Flugel et al., 2001; Kawakami et al., 2005). However, little is known about the processes by which T cells access the CNS during infection and the factors that regulate their behavior within the brain are poorly characterized (Mrass and Weninger, 2006). To address these issues, a natural model of infection-induced CNS inflammation was utilized. Toxoplasma gondii is an opportunistic pathogen that can cause toxoplasmic encephalitis (TE) in previously infected individuals with acquired defects in T cell function (Hunter and Remington, 1994). In chronically infected mice, T cells limit parasite replication in the brain and depletion of CD8+ T cells alone leads to increased susceptibility (Gazzinelli et al., 1992). Thus, these mice provide a system to study how CD8+ T cells protect against infection in the CNS. The studies presented here use this model to visualize a T. gondii specific, T cell mediated immune response in the brains of chronically infected mice.
Results
Visualizing T Cell Behavior During TE
To better understand the T cell response to T. gondii, deep tissue imaging was utilized to visualize the behavior of endogenous lymphocyte populations in the CNS of infected mice. For the initial studies, DPEGFP mice were used in which GFP is expressed in all T cells (Mrass et al., 2006). DPEGFP mice were infected with T. gondii that express RFP. Four weeks later the brain was removed and a ~2mm horizontal slice from the cerebral cortex was placed in a perfusion chamber. This location was chosen because in mice and humans this is one of the sites most frequently associated with parasite replication and in B6 mice inflammatory foci are easily detected in which T cells can be observed interacting with infected cells (Fig. S1). Two photon imaging was conducted from the intact coronal surface to a depth of ~200μm (Fig. 1A). In uninfected mice, no GFP+ cells were observed in the parenchyma. At 4 weeks post infection, imaging revealed a large endogenous GFP+ population present in the brain associated with areas of parasite replication. At this time the parasite has formed cysts, apparent as large (~20-50μm) red spheres containing large numbers of individual parasites (Fig 1B and Video S1). Tracking analysis identified two major populations of cells: one with a slow (<2μm/min) constrained phenotype and a highly migratory (>10μm/min) population (Fig. 1C, D). Some of these cells interacted closely with the tissue cyst (Video S1B). In these experiments, GFP expression is not restricted to a specific population of T cells and it was not possible to distinguish which T cell subsets were stationary or motile or if this was related to their antigen specificity.
Figure 1. Imaging endogenous leukocytes in the brain.
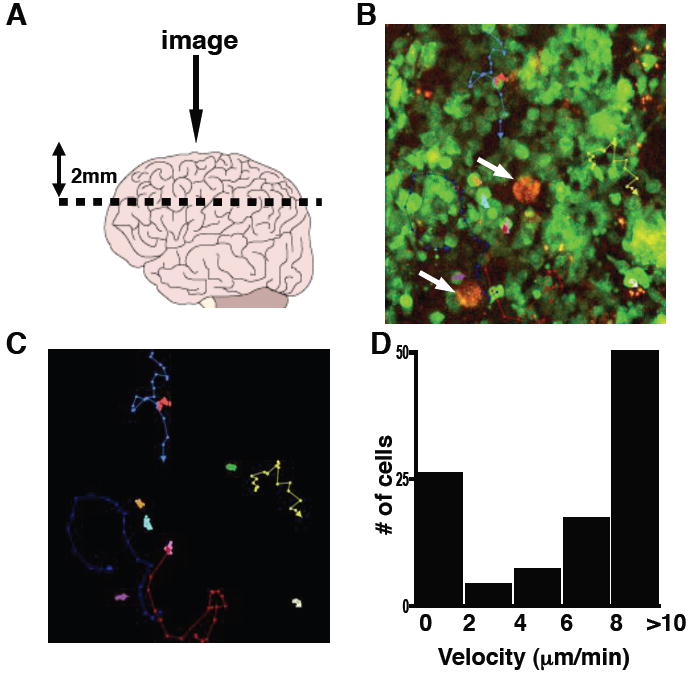
DPEGFP mice were chronically infected with RFP T. gondii. A) A diagram showing sectioning of brain and lens positioning for imaging. B) A snapshot image showing GFP+ cells and parasite cysts in red (arrows). C) Representative tracks of analyzed cells are shown in color with arrows in the direction of travel (Supplemental Video 1) D) Velocity range of GFP+ cells (μm/min).
Use of OVA-T.gondii to track parasite-specific responses during TE
To address some of the issues described above, an experimental system was developed to focus on the CD8+ T cell response to T. gondii. Therefore, mice chronically infected with a strain of T. gondii engineered to secrete OVA protein (PRUOVA)(Pepper et al., 2004) were adoptively transferred with GFP+ OVA specific CD8+ T cells (OTIGFP) that had been expanded in vitro (Mrass et al., 2006). Previous studies have shown that parasite expression of a secreted form of OVA is required for T cell recognition, similar to recent studies that identified three immunodominant class I specifc proteins of T. gondii as being secreted (Blanchard et al., 2008; Frickel et al., 2008). Moreover, class I OVA tetramers and GFP expression were used to distinguish endogenous and transferred OVA specific CD8+ T cells in the spleen, cervical lymph nodes (cLN) and brain. In mice infected with control parental parasites, no endogenous tet+ population of CD8+ T cells were detected in any tissues examined. In those challenged with PRUOVA, by day 40 there was an endogenous tet+ population present in all three sites examined (Figure 2A) that remained constant over time. At day 5 post transfer, the OTIGFP cells were present in the spleen and cLN in equivalent proportions in mice infected with parental or PRUOVA parasites. In mice that had been infected with control parasites, although activation status was equivalent (as measured by CD44, CD62L, CD25 and CD69; Fig. S2 and data not shown) transferred cells did not expand (Fig. 2B). In PRUOVA infected mice, although there was variation between experiments, the OTIGFP population expanded peaking at approximately three weeks post-transfer followed by a slower contraction. This expansion in the periphery is reflected in the numbers of cells found in the brain. Thus, in PRUOVA infected mice, by three weeks post transfer, this population increased 20 fold to ~10% of total BMNC. Since absolute numbers of OTIGFP cells closely mirrored the percentage of live cells, this increase is due to expansion of the OTIGFP cells, and is not a consequence of a decrease in the number of endogenous cells (Fig 2B). Following the peak of recruitment at ~22 days post transfer, the size of the OTIGFP population gradually contracted so that within three weeks the population halved from ~10% to 5% of live mononuclear cells in the brain. Similar kinetics were seen in the periphery, and OTIGFP cells were present in both of these sites more than 50 days after transfer. It should be noted that similar, but delayed, kinetics were observed when naïve OTIGFP cells were used in this transfer system. Importantly, in mice infected with parental parasites activation and expansion of OTIGFP cells in the periphery by OVA immunization did not lead to their presence in the brain (Fig. S3). Consequently, it was not possible to quantify the behavior of OTIGFP T cells in the brains of mice infected with parental parasites.
Figure 2. Antigen specific CD8+ T cells accumulate in the CNS.
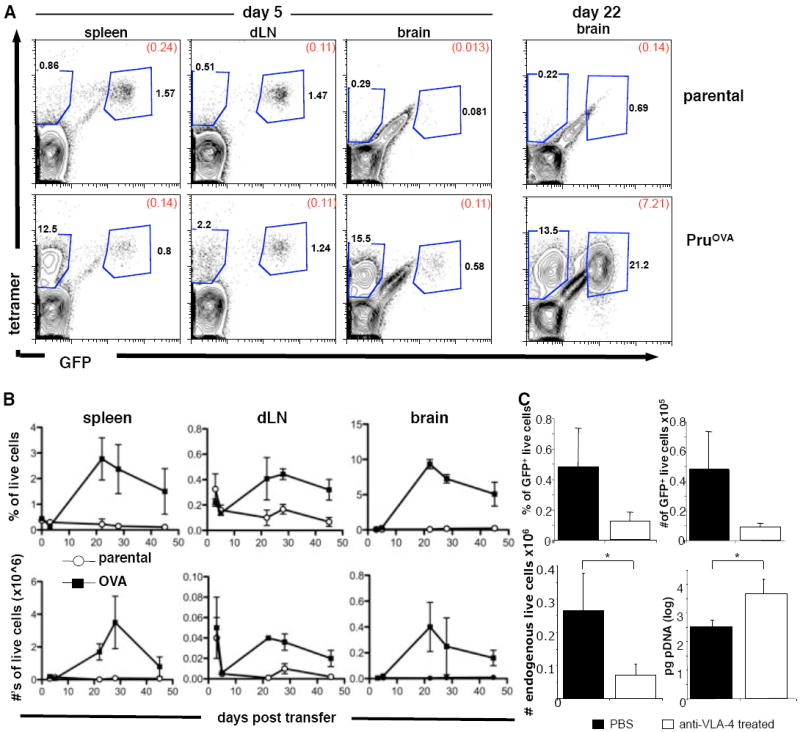
C57BL/6 mice were infected with either parental control parasites or parasites secreting OVA protein (PruOVA). Four weeks following infection OTIGFP cells were transferred i.v.. Splenic LN and BMNC were analyzed for numbers of OTIGFP cells at various points following transfer. A) at day 5 and day 22 post transfer, cells were stained using CD8 and class I tetramer antibodies. Numbers represent the percentage of total live CD8+ cells in each gate and in brackets the percentage of total live cells. B) The percentage of total live cells that were GFP+ in the spleen, dLN, and brain at various time points following transfer. C) The percentage (upper left) and number (upper right) of live cells that were GFP+ in the brain with and without anti-VLA-4 treatment. The number of endogenous OVA specific cells (lower left) and parasite DNA levels (lower right) in the brain with and without anti-VLA-4 treatment.
The increase in the numbers of OTI cells in the brain in the 2-3 weeks following transfer could be due to recruitment from the periphery and/or local proliferation in the brain. Since VLA-4 binding to VCAM is required for T cell entry to the CNS during EAE (Yednock et al., 1992), and the pre-activated T cells expressed high levels of VLA-4 (data not shown), treatment with anti-VLA-4 was used to address the extent to which local proliferation versus continued recruitment contributed to the numbers of OTIGFP T cells in the brain. By day 5 post-transfer, there were small numbers of OTIGFP cells present in the brain and mice were treated every 3 days for 9 days with anti-VLA-4 to prevent subsequent migration into the brain. If local proliferation in the brain accounted for the increase in OTIGFP numbers, then treatment with anti-VLA-4 should have minimal effect on local T cell expansion. Indeed, treatment did not lead to detectable changes in the number of endogenous or GFP+ T cells in the periphery (Fig. S4) but did result in decreased numbers of GFP+ cells (p<0.05) as well as endogenous tet+ cells in the brain (Fig 2C). Associated with this treatment, there was an increase in parasite levels in the brain (Fig. 2C), consistent with the requirement for T cells to limit parasite replication. This finding suggests that CD8+ T cells present during TE are largely a consequence of recruitment of cells from the periphery and not local expansion.
Behavior of effector CD8+ T cells in the CNS
Multi-photon microscopy was next used to assess the behavior of the OTIGFP T cells in the CNS. In mice infected with PRUOVA there was a marked increase in the number of cells per field of view from day 3 to day 20 post transfer with a subsequent decline by day 50 (Fig. 3A,B, Videos S2-4). Rare OTIGFP cells (4 cells in 10 mice) could be visualized in the brains of parental infected mice (Video S5). Tracking analysis of individual cells over time provided information regarding average velocity, displacement and meandering index. Graphing cell tracks, while normalizing for their starting position, indicates that the speed and displacement of cells is highest when there are peak numbers of transferred cells in the brain (Fig. 3C). Individual cell analysis revealed an average velocity at day 4 post transfer of 4.1μm/min. By three weeks post transfer, the average velocity increased to 6.9μm/min (p<0.05, between all time points) similar to that previously reported for migration in LN and tumors (Bousso and Robey, 2004; Miller et al., 2002; Mrass et al., 2006). This increase in average velocity is due to the appearance of a fast moving population (up to 25 μm/min) rather than an increase in the speed of all cells (Fig. 3D, G). At later time points (day 50), the average speed of cells was decreased compared to day 26 (p<0.05). This pattern is also apparent when measuring cellular displacement (Fig. 3E). When the number of cells in the brain is at a maximum there is the appearance of cells that travel greater distances (>50μm), and this is reduced at later time points (p<0.001). Moreover, the displacement rate (displacement/(timepoints-1)xtime), i.e. cells that travel large distances quickly have the highest displacement rate, correlates closely with the number of GFP+ cells in the brain (Fig. 3H). The average meandering index, a ratio of the distance traveled to the overall displacement of the cell, changes relatively little compared to other parameters but at later time points was decreased (day 4, 11, 26 vs day 50, p<0.001, Fig. 3F). However, although the correlation between the velocity and meandering index increased over time (day 3 r=0.29 – day 54 r=0.48), it never exceeded 0.5. These results suggest that factors other than velocity alone govern the confinement of a cell (Fig. 3I).
Figure 3. CD8+T cell behavior changes over time following transfer.
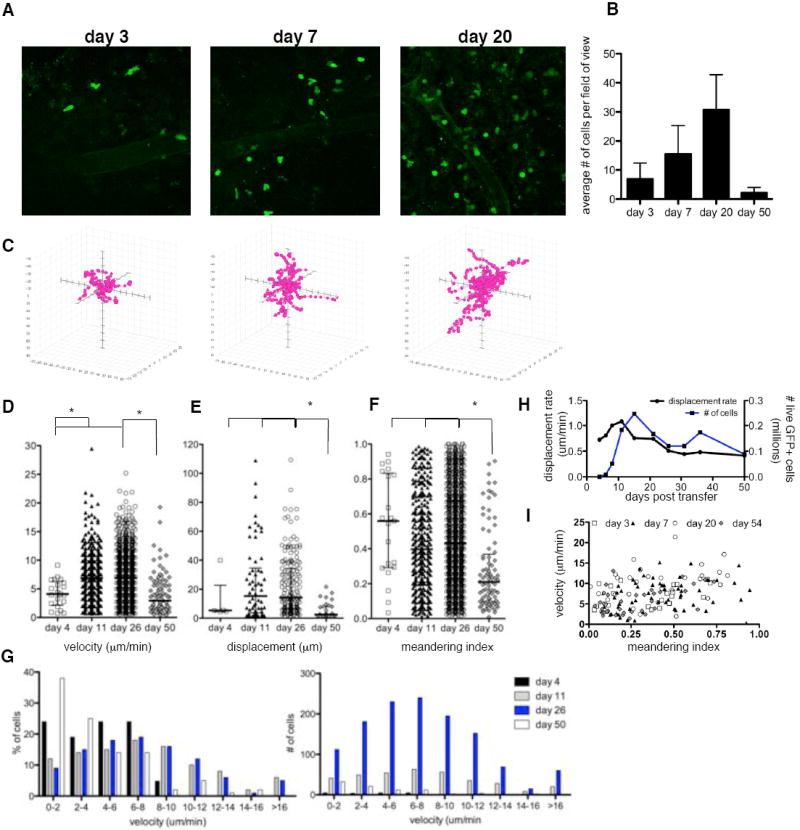
Imaging was conducted at various days post transfer and individual cell tracking analysis conducted on OTIGFP cells. A) snapshot images of OTIGFP cells in the brain at days 3, 7 and 20 post transfer, (Supplemental Videos 2-4) B) average number of OTI GFP cells per field of view C) individual cell tracking analysis plotted with each cell start position at the origin and on the same scale (150 × 130 × 50μm). Individual cells plotted for D) velocity; median: day 4=4.10; day 11=6.89; day 26=6.88; day 50=2.94μmin E) displacement; median: day 4=5.299; day 11:15.26; day 26=14.20; day 50=2.49μm F) meandering index; median: day 4=0.56; day 11=0.40; day 26=0.43; day 50=0.21. Calculations were made from at least 30 tracked cells from at least 3 mice. * indicates significant difference between groups p<0.05. G) Velocity of cells plotted to show percentage (left) or number (right) of cells at distinct speeds. H) Average displacement rate over time: displacement/(timepoints-1)xtime, I) Correlation between mean velocity and meandering index of OTIGFP cells at times post transfer day 3: r=0.29; day 7: r=0.28 p<0.05; day 20 r=0.44 p<0.001; day 54 r=0.48 p<0.001
While the analysis described above examine T cell behavior at the population level other factors such as activation status, responsiveness to chemokines, and interactions with CNS resident cells are likely to govern the behavior of individual T cells. Indeed, examination of individual imaging sets revealed other facets of how T cells functioned in the brain that were not apparent from the analysis in Figure 3. For example, individual OTIGFP cells were observed that repetitively covered the same area (Fig. 4A, Video S6A). Similarly, cells that transitioned from a highly motile phenotype to a constrained pattern of behavior were detected. In Figure 4B and Video S6B, a cell traveling at a maximum speed of 27μm/min stops rapidly, retreats with trailing uropod, rounds up and enters a stationary phase for 20 minutes. Additionally, clustering of T cells was apparent in many of the imaging sets. In the example provided, the majority of cells in the field of view are evenly dispersed (Fig. 4C,D, Video S7A), but there is a cluster of 4 constrained cells (red tracks, Video S7B). During imaging, two cells repeatedly cover the cluster area, slowing down and rounding up (yellow and purple tracks, Video S7C). In contrast, two cells moving quickly and in a directed manner to and from the cluster are also visualized (Fig. 4C, far right-hand panel; Video S7D). Lastly, although extremely rare (2 events in more than 10,000 cells analyzed), OTIGFP cells could be seen dividing and forming a cluster (Fig. S5, Video S8). The rarity of such events corroborates the conclusion that local proliferation does not contribute significantly to the size of the CD8+ T cell population in the brain. It is of note that the various parameters observed here using the transfer of pre-activated OTIGFP cells recapitulates those observed using endogenous T cells (Fig. 1D) or when mice were reconstituted with a naïve OTIGFP population prior to infection (Fig S6; Video S9).
Figure 4. Examples of OTIGFP CD8+ T cell behavior within the brain.
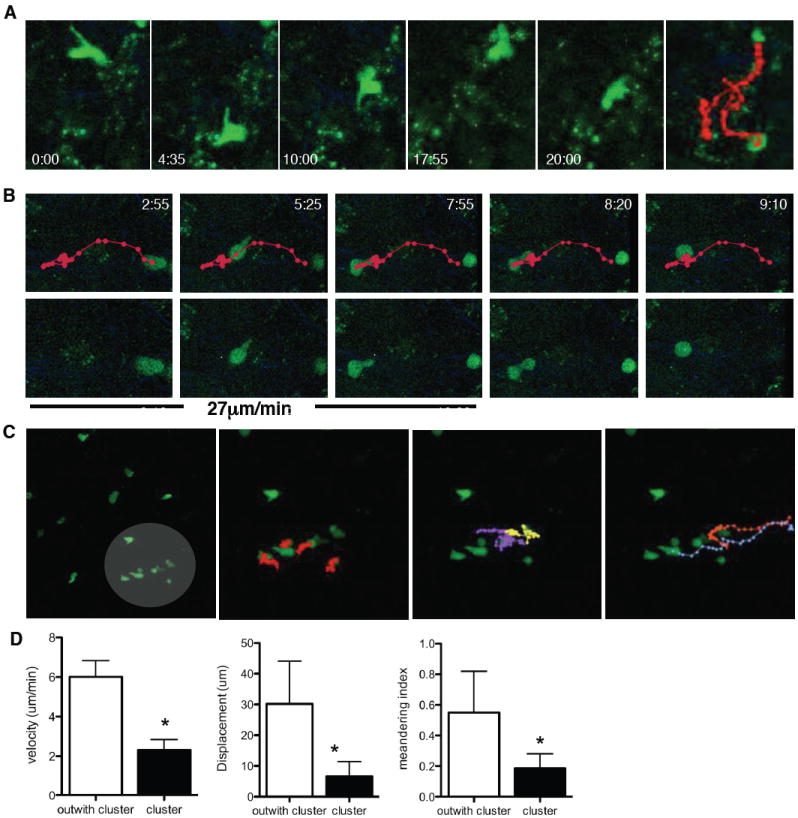
Snapshots of OTIGFP cell behavior in the brain during 2-photon imaging A) repetitive migration B) arresting cell C) clustering. Time in minutes since the start of imaging is noted and the average velocity of the cell prior to stopping is given in B). Lines depict the migrating path of the cell, each dot representing each imaged frame (every 25s). (Supplemental Videos 6-8). C-D) The first panel in C) highlights an area of clustering cells subsequent panels illustrate left to right: highly constrained cells, repetitive migrating cells and cells migrating quickly to or from the cluster. D) Mean velocity, displacement and meandering index of cells outside (n=10) and within the clump (n=6) * represents p<0.001.
Changes in CD8+ T cell effector capacity
Previous reports have linked the presence of cognate antigen with more constrained behavior and as antigen load is reduced with increased T cell motility (Mrass et al., 2006; Odoardi et al., 2007). Consequently, the changes in OTIGFP behavior over time led us to assess whether these T cells altered parasite burden. In chronically infected mice, parasite levels gradually increase over time but no decrease was seen in parental infected mice that had been transferred with OTIGFP cells (data not shown). When the levels of parasite DNA in the brains of transferred and non-transferred mice were collated, it was apparent that while levels were equivalent early following transfer (week 1), between 7 and 14 days post transfer there was a reduction in parasite burden of mice that received OTIGFP cells (Fig. 5A). This decrease coincided with the presence of maximal numbers of OTIGFP cells in the brain (Fig. 5B), and analysis of brain sections revealed GFP+ cells in close association with areas of parasite replication (Figure 5C). However, starting by week 3 post-transfer, there was a gradual increase in parasite burden to levels equivalent to those in mice that received no transfer (Fig. 5A), which correlated with the decline in OTIGFP cells in the brain. Thus, the presence of peak numbers of OTIGFP cells in the brain is associated with a reduction in parasite burden, but these cells cannot maintain this effect.
Figure 5. Recently transferred CD8+ T cells have greater effector capacity in the brain.
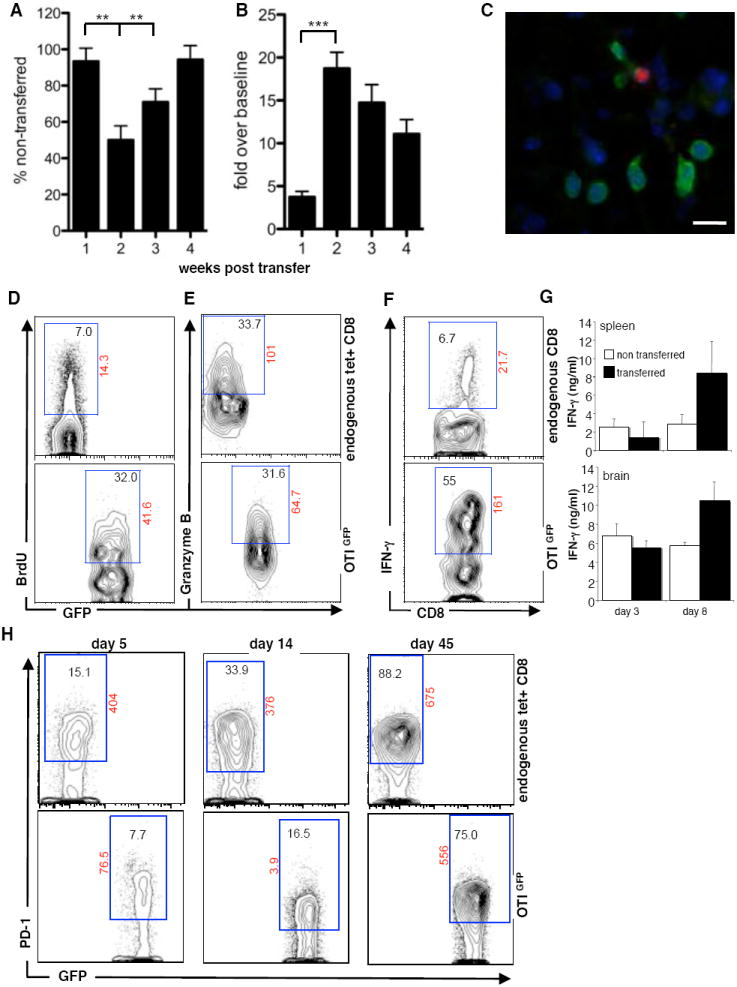
A) A time course of average parasite DNA levels in the brains of mice that received transfer of OTIGFP cells, as a percentage of those that had no transfer. B) A time course of average number of OTIGFP cells in the brain expressed as a percentage of the average number found at day 3 post transfer. Data for A+B are collated from 6 separate time courses, bars illustrate SEM and statistical significance is illustrated as **=p<0.01, ***=p<0.001. C) Histochemical analysis of T. gondii (red) and OTIGFP cells at day 21 post infection. Ex vivo analysis of BMNC at day 10 post transfer D) BRDU incorporation, E) Granzyme B expression and F) IFN-γ production or G) total IFN-γ production following OVA peptide restimulation and compared between transferred and non-transferred splenic and BMNC cells. Numbers in gates represent percentage of either CD8+ tetramer+ live cells (endogenous CD8) or GFP+ CD8+ live cells with the exception of F) where GFP cells are compared to all non-GFP CD8+ live cells. Numbers outside gate represent mean fluorescent intensity. Figures are representative of data from at least 3 individual mice.
Because the transferred OTIGFP cells were a fraction of the endogenous CD8+ T cell population in the brain it seemed unlikely that the decreased parasite burden was due solely to the increased number of antigen specific cells. One possible explanation was that the newly recruited OTIGFP population had enhanced effector capacity. Therefore, levels of proliferation, effector function, ability to produce IFN-γ and activation status of the endogenous tet+ and transferred OTIGFP cells in the brain were compared. For proliferation, mice were pulsed with BrdU 24hrs prior to sacrifice and BrdU incorporation was used as an indicator of recent division. Comparison of endogenous tet+ CD8+ T cells and transferred OTIGFP cells showed an increased proportion of BrdU+ OTIGFP cells (Fig. 5D). In contrast, while the proportion of CD8+ T cells that were GranzymeB positive was greater in the brain compared to the spleen (data not shown), there were no differences in the levels of GranzymeB between the endogenous tet+ population and transferred OTIGFP cells (Fig. 5E).
One of the primary roles of T cells during TE is the local production of IFN-γ that activates macrophages and CNS resident cells to control parasite replication. Because restimulation with OVA peptide leads to downregulation of the TCR and reduced binding of tetramer, it was not possible to combine intracellular detection of IFN-γ with tetramer staining. Nevertheless, when BMNC preparations were restimulated with OVA peptide and the ability to produce IFN-γ was compared between GFP+ and GFP- CD8+ T cells the proportion of OTIGFP cells producing IFN-γ ex vivo was 10 fold greater than the endogenous CD8+ T cells (Fig. 5F). This is at a time point where the relative ratio of endogenous to transferred tet+ cells is 3:1. Moreover, when levels of IFN-γ secreted in response to OVA peptide were measured, at early time points (day 3) post transfer, when the OTIGFP cells had not yet expanded, IFN-γ production was comparable between splenic and BMNC from transferred and non-transferred mice. By day 8 when the OTIGFP population started to expand, a significant increase in IFN-γ was detected in the periphery and brain following re-stimulation (Fig. 5G). These data indicate that the transferred cells have a preferential capacity to produce IFN-γ compared to the endogenous OVA-specific CD8+ T cells at this point in the infection.
Flow cytometry to assess activation status revealed that all T cell populations harvested from the brain exhibited an activated (CD44hiCD62Llow) phenotype, (data not shown) similar to previous reports (Reichmann et al., 1999; Wilson et al., 2005). Because CD8+ T cell expression of PD-1 has been associated with a decrease in effector capacity (Sharpe et al., 2007; Wherry et al., 2007) this was also examined. Analysis of PD-1 expression on endogenous OVA specific T cells in untransferred mice at day 40 revealed a significant proportion of tet+ CD8+ T cells in the brain which express high levels of PD-1, that increased over the next 4 weeks (data not shown). The same changes were apparent for the endogenous tet+ CD8+ T cells in transferred mice (Figure 5H). However, the proportion of the OTIGFP cells expressing PD-1 was decreased compared to the endogenous cells (days 5-14), but by day 45 post-transfer was equivalent to the endogenous tet+ population (Fig 5H).
Infection induced reticular fibers associated with T cell movement
During the imaging of T cells in the brain second harmonic generation (SHG) structures were visible associated with areas of inflammation and parasite replication (Fig. 6A and S7). This network is densely organized, with fibers ranging from <1-6μm in diameter that extend beyond the vasculature and into the parenchyma of the brain. Importantly, imaging of naïve brains revealed very little SHG, and if present was associated with blood vessels (Fig. 6A,B). These structures were also observed in localized lesions in the brain stem, cerebellum and spinal cord of mice with EAE, illustrating that it is not specific to TE but rather associated with areas of inflammation in the CNS (Fig. S8).
Figure 6. Generation of SHG structures following infection.
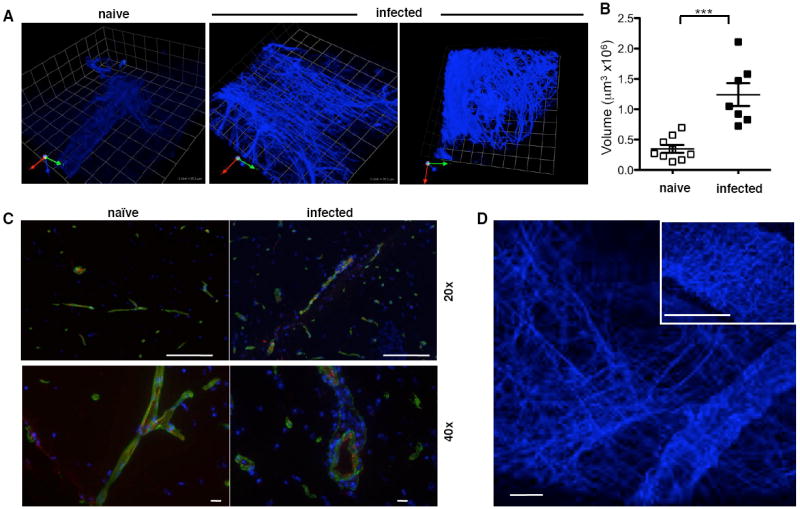
Imaging of SHG structures in naïve brains and following infection A) representative snapshots 1unit=25.2μm B) average density of SHG fibers in naïve and infected mice, measured as described in Materials and Methods. Significant differences between groups are indicated *** = p<0.001 C) Immunohistochemical analysis of collagen (green) in naïve and infected brain in association with blood vessels (PECAM-1 (red)), DAPI – blue; scale bar: 20x=100μm; 40x=10μm. D) generation of two distinct patterns of SHG in the brain: linear strands (main image) and wavy coils (main image and inset) the latter commonly associated with collagen. Scale bar represents 24.5μm.
SHG during multi-photon microscopy has been ascribed to highly ordered noncentrosymmetric structures such as collagen (Campagnola and Loew, 2003). However, immunohistochemical analysis of brains revealed the presence of type IV collagen was only associated with blood vessels (Figure 6C). Furthermore, although type I and III collagen were detected in LN only type I collagen was detected in normal or infected brain (data not shown). In both cases, infection did not result in increased expression of type I or IV collagen. This was complimented by histochemical staining (Van Gieson’s stain and Masson’s Trichrome) from uninfected and infected mice, which only detected collagen in the basement membrane of blood vessels (data not shown). In addition, the second harmonic signal generated by collagen has been described with a particular wave pattern (Cox and Kable, 2006; Yasui et al., 2004). In the brain this can be detected surrounding blood vessels and is distinct from the more abundant linear network that extends into the parenchyma (Fig. 6D).
During TE astrocytes become activated and express high levels of glial fibrillary acidic protein (GFAP), an intermediate filament, which histochemically resembled some of the second harmonic structures. Therefore, mice in which the astrocyte specific GFAP promoter drives GFP expression (Zhuo et al., 1997) were infected with T. gondii and imaged during the chronic phase of infection. In uninfected mice, astrocytes displayed their characteristic stellate shape (Fig. 7A left panel; Video S10A), whereas in chronically infected mice there were increased numbers of these cells that had a swollen and vacuolated appearance (Fig. 7A right panel). In the movies that accompany this imaging, the shadows of migrating cells (likely T cells) can be seen (Video S10B). When studies were performed to allow co-visualization of the second harmonic structures and GFP+ astrocytes they were found in the same areas, but there was frequently a degree of spatial separation. These results indicate that these structures are not a consequence of the detection of intermediate filaments (like GFAP) inside astrocytes (Fig. 7B).
Figure 7. T cell association with SHG structures.
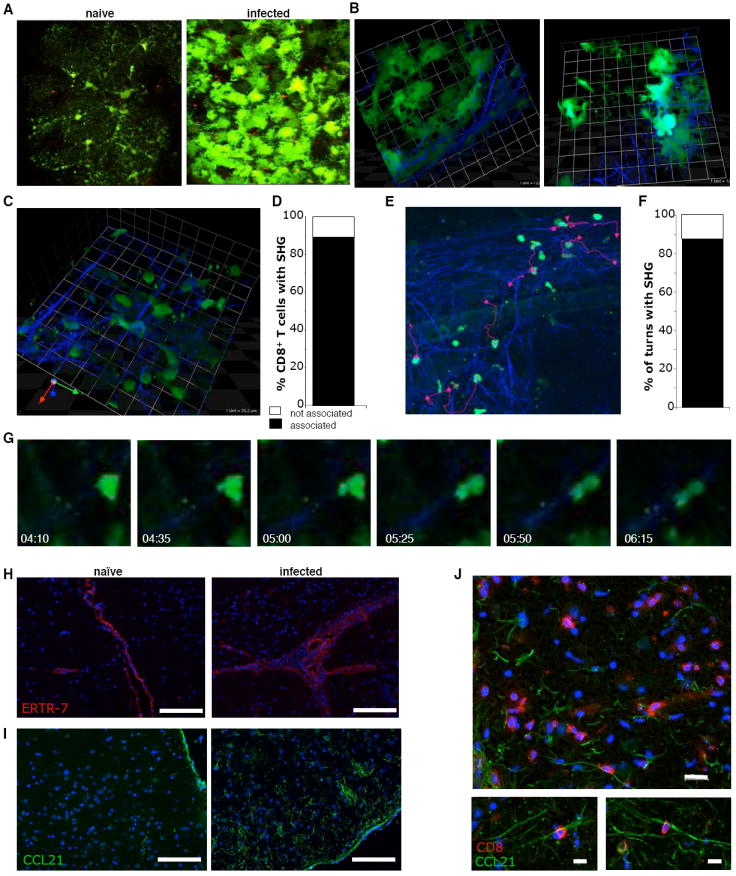
Imaging of A) naïve and infected GFAPGFP mice (Supplemental Video 10) B) 3-dimensional images of SHG structures and GFP astrocytes, 1 unit = 25.2μm. C) close up of OTIGFP cells wrapping around SHG filaments 1unit=12.5μm. D) The percentage of OTIGFP cells associated with SHG. E-G) migration of T cells along second harmonic structures (Supplemental Video 11): E) snapshot of tracked cells and their migratory paths (pink lines) F) The percentage of turns made by OTIGFP cells that follow SHG. G) An illustration of a migrating T cell moving along SHG fiber, relative time since beginning of imaging is noted. Immunohistochemical analysis of H) ERTR-7 (red) I) CCL21 expression in naïve and infected brains: green=CCL21; blue=DAPI; scale bar = 100μm and J) CD8+ T cell association with CCL21 fibers in infected brains: red=CD8; green=CCL21; blue=DAPI; scale bar = 20μm(left panel), 10μm (right panels).
Quantification of the numbers of OTIGFP cells associated with this network indicated that greater than 80% could be visualized in close contact with reticular fibers (Fig. 7C-G, Video S11). Closer examination revealed that the majority of these lymphocyte-ECM interactions involve changes in T cell morphology with lamellipodia wrapping around, followed by the elongation of the cell parallel to the fiber associated with migration along the filament (Fig. 7G; Video S11B). In addition, similar to T cells migrating through the network of channels in lymph nodes, the majority of turns a cell made were directed by nearby filaments (Fig. 7F). Within the lymph node, the FRC responsible for generating the ECM are thought to be coated with chemokines such as CCL21, and provide a physical scaffold combined with motogenic signals for T cell migration (Asperti-Boursin et al., 2007; Okada and Cyster, 2007; Worbs et al., 2007). These stromal cells are identified based on the expression of ERTR-7. Interestingly, while ERTR-7 was expressed at low basal levels in uninfected brains, it was restricted to the basement membrane of blood vessels and was also detected in the sulcis. In infected mice there was increased staining, but ERTR-7 was not detected in the parenchyma (Fig. 7H). However, while it was not technically possible to determine if the reticular fibers are coated with CCL21, immunohistochemistry showed a marked upregulation of CCL21 expression following infection (Fig. 7I) and confocal analysis reveals that CD8+ T cells are closely associated with filamentous CCL21+ structures (Fig. 7J).
Discussion
Previous reports have characterized the immune infiltrate present in the brain during TE but there has been little insight into the behavior of these populations. The ability to visualize total endogenous T cell populations in vivo in the brain during infection provided the impetus for the reductionist approach described above, allowing us to focus on the anti-parasite CD8+ T cell response. Recent studies have proposed a requirement for an antigen specific entry mechanism for CD8+ T cells to the brain (Galea et al., 2007). The inability to detect significant numbers of peripherally activated OTI CD8+ T cells in the brains of mice infected with parental parasites is in agreement with this concept. However, our findings do not distinguish between a requirement for cognate antigen in the brain for retention versus antigen specific recruitment.
Based on previous models (Hunter and Remington, 1994) there was the expectation that once T. gondii- specific CD8+ T cells gained entry to the brain they would display directed migration towards areas of parasite replication where they would accumulate, stop and mediate effector functions. Indeed, endogenous and transferred T cells formed foci associated with infected cells, and imaging of OTIGFP cells revealed clusters of stationary rounded cells. These latter behaviors are consistent with T cells interacting with either infected targets or cells involved in cross presentation of class I restricted antigens. Indeed, during TE there are multiple candidates that could be involved in these processes including dendritic cells, macrophages, microglia or astrocytes (Figure S9). What was unexpected was the large number of T cells that were highly motile, whether imaging the endogenous populations or the transferred OTIGFP cells. This highly motile population was most apparent when there were maximum effector cells in the brain and antigen load was reduced. These findings are consistent with a model in which antigen availability is a major determinant of T cell behavior at the population level. Alternatively, the observation of increasing PD-1 expression on the endogenous CD8+ T cells, and its delayed kinetics on the transferred OTIGFP population, raises the possibility that the mechanisms that limit T cell activity during TE may underlie the reduced migration and velocity of chronically activated T cells.
The use of intra-vital imaging highlighted the close association of T cells with fibroblastic reticular cells and ECM structures in the LN and led to an appreciation that T cell motility in lymphoid organs is highly directed (Bajenoff et al., 2006). There is also evidence that even in uninflamed tissues such as the liver or skin, which contain circulating populations of immune cells, similar scaffolds already exist (Friedl and Weigelin, 2008; Yang et al., 2007). This report, describes the presence of an analogous reticular system at inflammatory sites within the brain, that was not present in the normal brain tissues examined, but was associated with areas of parasite replication and local inflammation. At present the source of this network is unclear, but astrocytes have been implicated in the generation of collagen-like networks in the brain during glial scar formation (Heck et al., 2007), consistent with the localization of activated astrocytes in these lesions. Relevant to this observation are reports of an ECM structure composed of proteoglycans and glycoproteins that guides axonal migration during neuronal development (Fitch and Silver, 2007; Heck et al., 2007; Tessier-Lavigne and Goodman, 1996). It may be that the structures important during this developmental process may also be used to regulate lymphocyte migration in this immunologically privileged site.
In the lymph node, the presence of CCR7 ligands coating the ECM structure is a requirement for efficient T cell motility. The observation that in mice with TE there is increased expression of CCL21 with a fibrous appearance that is closely associated with CD8+ T cells supports the comparison with secondary lymphoid organs. Moreover, although the role of CCR7 and its ligands during T. gondii infection has not been fully elucidated, our studies have identified CD8+ T cells expressing CCR7 during TE and which are functionally responsive to CCL21 (unpublished observations). Taken together, these observations suggest that reticular fibers in the brain, analogous to the role of ECM in the lymph node, may provide a scaffold that supports T cell migration during inflammation. While further studies will be required to define the composition of these reticular networks, targeting these structures may provide therapeutic approaches to manage T cell mediated inflammatory conditions that affect the brain.
Experimental Procedures
Mice and Parasites
OTI-DPEGFP mice were bred at the Wistar Institute and C57BL/6 mice were obtained from Jackson laboratories (Bar Harbor, ME). Mice were maintained in specific pathogen free facilities and protocols were approved by the Institutional Animal Care and Use Committee of The Wistar Institute or the University of Pennsylvania. All parasites were generated and maintained as previously described (Pepper et al., 2004). Mice were infected with 104 tachyzoites in 100μl PBS i.p. and chronic infection was judged as 3-4 weeks post infection. Real time RT-PCR, based on detection of the repetitive T. gondii B1 gene as a measure of parasite burden, was conducted as previously described (Wilson et al., 2005). In order to normalize the Ct values obtained from the experimental samples, the mouse β-actin gene was amplified.
Adoptive T cell transfer
To obtain GFP+ OTI cells, splenocytes from OTI-DPEGFP mice were prepared and stimulated in vitro as previously described (Mrass et al., 2006). After 9 days of expansion, cells were harvested and 5×10⁶ cells per mouse were retro-orbitally injected into mice infected for 4 weeks. In experiments blocking VLA-4, 150μg per mouse of anti-VLA-4 (VLA-4-LE/AF, Southern Biotech) was administered every 3 days i.p. starting on day 5 post transfer.
Tissue preparation and two-photon live cell imaging
To prepare brain tissue for live imaging, mice were euthanized by CO2 asphyxiation, the brain removed and a horizontal slice of ~2mm immediately transferred into an imaging chamber (Warner Instruments). Tissue was perfused with RPMI complete (RPMI plus 10% fetal calf serum, 1% pen/strep, 1% glutamine, 1% HEPES, 1% non-essential amino acids and 0.1% β-mercaptoethanol), bubbled with 95% oxygen and 5% carbon dioxide and maintained at 37°C. Imaging was performed on a Prairie Technology Ultima System attached to an Olympus BX-51 fixed-stage microscope equipped with 40x (NA 0.8) water immersion objective. The set-up included external nondescanned dual-channel/fluorescence detectors and a diode-pumped, wideband mode-locked Ti:Sapphire femtosecond laser (720-980nm, <140fs; 90MHz; Coherent Chameleon). Samples were exposed to polarized laser light at a wavelength of 920nm. Emitted light was separated with a filter set (primary dichroic mirror, followed by dichroic mirrors at 520nm, 495nm, and 575nm). Four photo multiplier tubes collected light at wavelengths: 457-487nm; 503-537nm; 525-570nm and 580-652nm. Z-stacks of a series of x-y planes of 284nm by 284nm at a resolution of 0.49μm pixel-1 with a total thickness of 30μm (step size 6μm) were captured every 25s using Prairie View acquisition software (Prairie technologies). To maximize our obervations the depth and area of imaging was varied but was primarily conducted between 50-250μm with an average depth of ~120 μm below the uncut surface of the brain. This is an approximation based on z information and the first point of focus.
Three-dimensional images were generated using Volocity software (Improvision). Single cell tracking analysis was conducted automatically (~intensity>130±20; size>50μm) and manually, on a minimum of 21 frames (out of 31) to calculate mean migration velocities, cellular displacement (21 frames) and meandering index as described previously (Mrass et al., 2006). This time period allowed an accurate picture of cell movement while allowing sufficient number of cells to be tracked before leaving the field of view. Displacement rate (displacement/(timepoints-1)×time) was calculated on all tracked cells. For tracking analysis a minimum of 5 cells from each of 5 individual movies generated from at least 3 individual mice were tracked. Z-stacks were generated with a resolution of 0.49μm/pixel and step size of 0.5-1μm. To quantify the density of SHG 50μm z-stacks with a step size of 1μm were generated. Volocity was used to measure the volume using an intensity filter >166 and size filter of >50μm. Mean density was calculated from at least 10 z-stacks from 5-10 naïve and infected mice. Association of OTIGFP cells with SHG was quantified by measuring colocalization of objects, and turning angles of cells in relation to reticular fibers as previously described (Bajenoff et al., 2006).
Brain mononuclear, splenic and LN preparations
To quantify numbers and percentages of GFP+ cells, single cell suspensions were made from brain, spleen and LN as previously described (Wilson et al., 2005). For spleen and LN, organs were harvested following perfusion and passed through a 40μm filter. Erythrocytes were lysed using 0.86% (w/v) ammonium chloride. All cell suspensions were counted and resuspended at 1×10⁶/ml.
Flow cytometry
For GFP and tetramer analysis 1×10⁶ cells per sample were washed with FACS buffer. Following FC-receptor block, SIINFEKL tetramer was added for 15mins at RT followed by 15mins at 4°C. Further surface antibodies were added for a duration of 20mins at 4°C. For analysis of BrdU mice were injected with 200μl of BrdU on day -1. Following harvest, cells were surface stained, fixed and permeabilized using BD BrdU kit. For ex vivo analysis of IFN-γ production, cells were stimulated for 4hrs with PMA and ionomycin, 2hrs prior to the end of the culture period cells were treated with Brefeldin A. Following surface staining procedures, cells were fixed with 4% PFA, permeabilized with 0.3%(w/v) saponin and incubated with anti-IFN-γ APC for 20mins at 4°C. Rabbit anti-GFP (1/200) followed by anti-rabbit FITC (1/2000) was used to detect GFP cells following permeabilization. Samples were read on a BD Canto and analyzed using Flowjo software (Tree Star Inc.).
Cytokine Measurement
Whole splenocytes or BMNC were washed and resuspended in complete RPMI 1640 before being plated at a cell density of 1 × 10⁵ cells per well in a final volume of 200μl in 96-well plates (Costar, Costar NY). Cells were stimulated with OVA peptide (SIINFEKL) at 1μg/ml, for 48 h at 37 °C in 5% CO2. IFN-γ levels were measured using ELISA.
Immunohistochemistry
To visualize GFP+ cells, brains were fixed in 4% PFA for 24 hours followed by 24hrs in 30% sucrose, embedded in OCT and flash frozen. 6μm transverse sections were cut and stained with Rbt anti-GFP (eBiosciences) followed by anti-rabbit Alexa 488 (Invitrogen). To co-visualize parasites sequential staining was conducted using 1:500 rabbit polyclonal anti-T.gondii, anti-rabbit TRITC. To visualize collagen, endothelial cells, CCL21, and CD8, organs were embedded in OCT and flash frozen. 6μm sagittal sections were fixed in 75% acetone, 25% EtOH, stained at 4μg/ml goat anti-collagen IV from Chemicon, Collagen I or III (Calbiochem), ERTR-7 (Acris Antibodies) followed by donkey anti-goat FITC; 8 μg/ml PECAM-1 (CD31) (Caltag) followed by goat anti-rat Cy3; recombinant murine Exodus-2 (CCL21) (Peprotech) at 15 μg/ml followed by goat anti-rabbit FITC; CD8 at 3 μg/ml (BDPharmingen) followed by goat anti-rat Cy3 and counterstained with DAPI (0.5μg/ml) (Invitrogen). All secondary antibodies were purchased from Jackson Immunoresearch. Images were acquired on a Nikon fluorescence microscope equipped with a CoolSNAP CCD camera (Photometrics). Images were processed using software by Nikon (NIS Elements).
Statistical analysis
Statistical analysis was conducted on normally distributed data using Students t-test and correlations were calculated using Prism software (Graphpad Software Inc.).
Supplementary Material
Acknowledgments
The authors would like to thank Marc Izzo at Volocity and James E. Hayden, Lai Guan Ng and Christoph Hoeller for technical assistance and helpful discussions. C.A. Hunter was supported by a grant from the National Institutes of Health (AI41158) and the state of Pennsylvania. P. Mrass is a fellow of the Max Kade Foundation, Inc. and the recipient of a Cancer Research Institute postdoctoral fellowship.
Footnotes
Publisher's Disclaimer: This is a PDF file of an unedited manuscript that has been accepted for publication. As a service to our customers we are providing this early version of the manuscript. The manuscript will undergo copyediting, typesetting, and review of the resulting proof before it is published in its final citable form. Please note that during the production process errors may be discovered which could affect the content, and all legal disclaimers that apply to the journal pertain.
References
- Asperti-Boursin F, Real E, Bismuth G, Trautmann A, Donnadieu E. CCR7 ligands control basal T cell motility within lymph node slices in a phosphoinositide 3-kinase-independent manner. J Exp Med. 2007;204:1167–1179. doi: 10.1084/jem.20062079. [DOI] [PMC free article] [PubMed] [Google Scholar]
- Bajenoff M, Egen JG, Koo LY, Laugier JP, Brau F, Glaichenhaus N, Germain RN. Stromal cell networks regulate lymphocyte entry, migration, and territoriality in lymph nodes. Immunity. 2006;25:989–1001. doi: 10.1016/j.immuni.2006.10.011. [DOI] [PMC free article] [PubMed] [Google Scholar]
- Bajenoff M, Egen JG, Qi H, Huang AY, Castellino F, Germain RN. Highways, byways and breadcrumbs: directing lymphocyte traffic in the lymph node. Trends Immunol. 2007;28:346–352. doi: 10.1016/j.it.2007.06.005. [DOI] [PubMed] [Google Scholar]
- Barker CF, Billingham RE. Immunologically privileged sites. Adv Immunol. 1977;25:1–54. [PubMed] [Google Scholar]
- Beltman JB, Maree AF, Lynch JN, Miller MJ, de Boer RJ. Lymph node topology dictates T cell migration behavior. J Exp Med. 2007;204:771–780. doi: 10.1084/jem.20061278. [DOI] [PMC free article] [PubMed] [Google Scholar]
- Blanchard N, Gonzalez F, Schaeffer M, Joncker NT, Cheng T, Shastri AJ, Robey EA, Shastri N. Immunodominant, protective response to the parasite Toxoplasma gondii requires antigen processing in the endoplasmic reticulum. Nat Immunol. 2008;9:937–944. doi: 10.1038/ni.1629. [DOI] [PMC free article] [PubMed] [Google Scholar]
- Bousso P, Robey EA. Dynamic behavior of T cells and thymocytes in lymphoid organs as revealed by two-photon microscopy. Immunity. 2004;21:349–355. doi: 10.1016/j.immuni.2004.08.005. [DOI] [PubMed] [Google Scholar]
- Campagnola PJ, Loew LM. Second-harmonic imaging microscopy for visualizing biomolecular arrays in cells, tissues and organisms. Nat Biotechnol. 2003;21:1356–1360. doi: 10.1038/nbt894. [DOI] [PubMed] [Google Scholar]
- Cox G, Kable E. Second-harmonic imaging of collagen. Methods Mol Biol. 2006;319:15–35. doi: 10.1007/978-1-59259-993-6_2. [DOI] [PubMed] [Google Scholar]
- Cserr HF, Knopf PM. Cervical lymphatics, the blood-brain barrier and the immunoreactivity of the brain: a new view. Immunol Today. 1992;13:507–512. doi: 10.1016/0167-5699(92)90027-5. [DOI] [PubMed] [Google Scholar]
- Egen JG, Rothfuchs AG, Feng CG, Winter N, Sher A, Germain RN. Macrophage and T cell dynamics during the development and disintegration of mycobacterial granulomas. Immunity. 2008;28:271–284. doi: 10.1016/j.immuni.2007.12.010. [DOI] [PMC free article] [PubMed] [Google Scholar]
- Fitch MT, Silver J. CNS injury, glial scars, and inflammation: Inhibitory extracellular matrices and regeneration failure. Exp Neurol. 2007 doi: 10.1016/j.expneurol.2007.05.014. [DOI] [PMC free article] [PubMed] [Google Scholar]
- Flugel A, Berkowicz T, Ritter T, Labeur M, Jenne DE, Li Z, Ellwart JW, Willem M, Lassmann H, Wekerle H. Migratory activity and functional changes of green fluorescent effector cells before and during experimental autoimmune encephalomyelitis. Immunity. 2001;14:547–560. doi: 10.1016/s1074-7613(01)00143-1. [DOI] [PubMed] [Google Scholar]
- Frickel EM, Sahoo N, Hopp J, Gubbels MJ, Craver MP, Knoll LJ, Ploegh HL, Grotenbreg GM. Parasite Stage-Specific Recognition of Endogenous Toxoplasma gondii-Derived CD8(+) T Cell Epitopes. J Infect Dis. 2008;198:1625–1633. doi: 10.1086/593019. [DOI] [PMC free article] [PubMed] [Google Scholar]
- Friedl P, Weigelin B. Interstitial leukocyte migration and immune function. Nat Immunol. 2008;9:960–969. doi: 10.1038/ni.f.212. [DOI] [PubMed] [Google Scholar]
- Galea I, Bernardes-Silva M, Forse PA, van Rooijen N, Liblau RS, Perry VH. An antigen-specific pathway for CD8 T cells across the blood-brain barrier. J Exp Med. 2007;204:2023–2030. doi: 10.1084/jem.20070064. [DOI] [PMC free article] [PubMed] [Google Scholar]
- Gazzinelli R, Xu Y, Hieny S, Cheever A, Sher A. Simultaneous depletion of CD4+ and CD8+ T lymphocytes is required to reactivate chronic infection with Toxoplasma gondii. J Immunol. 1992;149:175–180. [PubMed] [Google Scholar]
- Geissmann F, Cameron TO, Sidobre S, Manlongat N, Kronenberg M, Briskin MJ, Dustin ML, Littman DR. Intravascular immune surveillance by CXCR6+ NKT cells patrolling liver sinusoids. PLoS Biol. 2005;3:e113. doi: 10.1371/journal.pbio.0030113. [DOI] [PMC free article] [PubMed] [Google Scholar]
- Halin C, Rodrigo Mora J, Sumen C, von Andrian UH. In vivo imaging of lymphocyte trafficking. Annu Rev Cell Dev Biol. 2005;21:581–603. doi: 10.1146/annurev.cellbio.21.122303.133159. [DOI] [PubMed] [Google Scholar]
- Heck N, Garwood J, Dobbertin A, Calco V, Sirko S, Mittmann T, Eysel UT, Faissner A. Evidence for distinct leptomeningeal cell-dependent paracrine and EGF-linked autocrine regulatory pathways for suppression of fibrillar collagens in astrocytes. Mol Cell Neurosci. 2007;36:71–85. doi: 10.1016/j.mcn.2007.06.002. [DOI] [PubMed] [Google Scholar]
- Hickman HD, Takeda K, Skon CN, Murray FR, Hensley SE, Loomis J, Barber GN, Bennink JR, Yewdell JW. Direct priming of antiviral CD8+ T cells in the peripheral interfollicular region of lymph nodes. Nat Immunol. 2008;9:155–165. doi: 10.1038/ni1557. [DOI] [PubMed] [Google Scholar]
- Hunter CA, Remington JS. Immunopathogenesis of toxoplasmic encephalitis. J Infect Dis. 1994;170:1057–1067. doi: 10.1093/infdis/170.5.1057. [DOI] [PubMed] [Google Scholar]
- Junt T, Moseman EA, Iannacone M, Massberg S, Lang PA, Boes M, Fink K, Henrickson SE, Shayakhmetov DM, Di Paolo NC, et al. Subcapsular sinus macrophages in lymph nodes clear lymph-borne viruses and present them to antiviral B cells. Nature. 2007;450:110–114. doi: 10.1038/nature06287. [DOI] [PubMed] [Google Scholar]
- Kawakami N, Nagerl UV, Odoardi F, Bonhoeffer T, Wekerle H, Flugel A. Live imaging of effector cell trafficking and autoantigen recognition within the unfolding autoimmune encephalomyelitis lesion. J Exp Med. 2005;201:1805–1814. doi: 10.1084/jem.20050011. [DOI] [PMC free article] [PubMed] [Google Scholar]
- Khanna KM, McNamara JT, Lefrancois L. In situ imaging of the endogenous CD8 T cell response to infection. Science. 2007;318:116–120. doi: 10.1126/science.1146291. [DOI] [PMC free article] [PubMed] [Google Scholar]
- Medawar PB. Immunity to homologous grafted skin. III. The fate of skin homografts transplanted to the brain, to subcutaneous tissue, and to anterior chamber of the eye. Br J Exp Pathol. 1948;29:58–69. [PMC free article] [PubMed] [Google Scholar]
- Miller MJ, Hejazi AS, Wei SH, Cahalan MD, Parker I. T cell repertoire scanning is promoted by dynamic dendritic cell behavior and random T cell motility in the lymph node. Proc Natl Acad Sci U S A. 2004;101:998–1003. doi: 10.1073/pnas.0306407101. [DOI] [PMC free article] [PubMed] [Google Scholar]
- Miller MJ, Wei SH, Parker I, Cahalan MD. Two-photon imaging of lymphocyte motility and antigen response in intact lymph node. Science. 2002;296:1869–1873. doi: 10.1126/science.1070051. [DOI] [PubMed] [Google Scholar]
- Mrass P, Takano H, Ng LG, Daxini S, Lasaro MO, Iparraguirre A, Cavanagh LL, von Andrian UH, Ertl HC, Haydon PG, Weninger W. Random migration precedes stable target cell interactions of tumor-infiltrating T cells. J Exp Med. 2006;203:2749–2761. doi: 10.1084/jem.20060710. [DOI] [PMC free article] [PubMed] [Google Scholar]
- Mrass P, Weninger W. Immune cell migration as a means to control immune privilege: lessons from the CNS and tumors. Immunol Rev. 2006;213:195–212. doi: 10.1111/j.1600-065X.2006.00433.x. [DOI] [PubMed] [Google Scholar]
- Norbury CC, Malide D, Gibbs JS, Bennink JR, Yewdell JW. Visualizing priming of virus-specific CD8+ T cells by infected dendritic cells in vivo. Nat Immunol. 2002;3:265–271. doi: 10.1038/ni762. [DOI] [PubMed] [Google Scholar]
- Odoardi F, Kawakami N, Li Z, Cordiglieri C, Streyl K, Nosov M, Klinkert WE, Ellwart JW, Bauer J, Lassmann H, et al. Instant effect of soluble antigen on effector T cells in peripheral immune organs during immunotherapy of autoimmune encephalomyelitis. Proc Natl Acad Sci U S A. 2007;104:920–925. doi: 10.1073/pnas.0608383104. [DOI] [PMC free article] [PubMed] [Google Scholar]
- Okada T, Cyster JG. CC chemokine receptor 7 contributes to Gi-dependent T cell motility in the lymph node. J Immunol. 2007;178:2973–2978. doi: 10.4049/jimmunol.178.5.2973. [DOI] [PubMed] [Google Scholar]
- Pepper M, Dzierszinski F, Crawford A, Hunter CA, Roos D. Development of a system to study CD4+-T-cell responses to transgenic ovalbumin-expressing Toxoplasma gondii during toxoplasmosis. Infect Immun. 2004;72:7240–7246. doi: 10.1128/IAI.72.12.7240-7246.2004. [DOI] [PMC free article] [PubMed] [Google Scholar]
- Reichmann G, Villegas EN, Craig L, Peach R, Hunter CA. The CD28/B7 interaction is not required for resistance to Toxoplasma gondii in the brain but contributes to the development of immunopathology. J Immunol. 1999;163:3354–3362. [PubMed] [Google Scholar]
- Sharpe AH, Wherry EJ, Ahmed R, Freeman GJ. The function of programmed cell death 1 and its ligands in regulating autoimmunity and infection. Nat Immunol. 2007;8:239–245. doi: 10.1038/ni1443. [DOI] [PubMed] [Google Scholar]
- Stoll S, Delon J, Brotz TM, Germain RN. Dynamic imaging of T cell-dendritic cell interactions in lymph nodes. Science. 2002;296:1873–1876. doi: 10.1126/science.1071065. [DOI] [PubMed] [Google Scholar]
- Tessier-Lavigne M, Goodman CS. The molecular biology of axon guidance. Science. 1996;274:1123–1133. doi: 10.1126/science.274.5290.1123. [DOI] [PubMed] [Google Scholar]
- Wherry EJ, Ha SJ, Kaech SM, Haining WN, Sarkar S, Kalia V, Subramaniam S, Blattman JN, Barber DL, Ahmed R. Molecular signature of CD8+ T cell exhaustion during chronic viral infection. Immunity. 2007;27:670–684. doi: 10.1016/j.immuni.2007.09.006. [DOI] [PubMed] [Google Scholar]
- Wilson EH, Wille-Reece U, Dzierszinski F, Hunter CA. A critical role for IL-10 in limiting inflammation during toxoplasmic encephalitis. J Neuroimmunol. 2005;165:63–74. doi: 10.1016/j.jneuroim.2005.04.018. [DOI] [PubMed] [Google Scholar]
- Worbs T, Mempel TR, Bolter J, von Andrian UH, Forster R. CCR7 ligands stimulate the intranodal motility of T lymphocytes in vivo. J Exp Med. 2007;204:489–495. doi: 10.1084/jem.20061706. [DOI] [PMC free article] [PubMed] [Google Scholar]
- Yang BG, Tanaka T, Jang MH, Bai Z, Hayasaka H, Miyasaka M. Binding of lymphoid chemokines to collagen IV that accumulates in the basal lamina of high endothelial venules: its implications in lymphocyte trafficking. J Immunol. 2007;179:4376–4382. doi: 10.4049/jimmunol.179.7.4376. [DOI] [PubMed] [Google Scholar]
- Yasui T, Tohno Y, Araki T. Determination of collagen fiber orientation in human tissue by use of polarization measurement of molecular second-harmonic-generation light. Appl Opt. 2004;43:2861–2867. doi: 10.1364/ao.43.002861. [DOI] [PubMed] [Google Scholar]
- Yednock TA, Cannon C, Fritz LC, Sanchez-Madrid F, Steinman L, Karin N. Prevention of experimental autoimmune encephalomyelitis by antibodies against alpha 4 beta 1 integrin. Nature. 1992;356:63–66. doi: 10.1038/356063a0. [DOI] [PubMed] [Google Scholar]
- Zhuo L, Sun B, Zhang CL, Fine A, Chiu SY, Messing A. Live astrocytes visualized by green fluorescent protein in transgenic mice. Dev Biol. 1997;187:36–42. doi: 10.1006/dbio.1997.8601. [DOI] [PubMed] [Google Scholar]
- Zinselmeyer BH, Dempster J, Gurney AM, Wokosin D, Miller M, Ho H, Millington OR, Smith KM, Rush CM, Parker I, et al. In situ characterization of CD4+ T cell behavior in mucosal and systemic lymphoid tissues during the induction of oral priming and tolerance. J Exp Med. 2005;201:1815–1823. doi: 10.1084/jem.20050203. [DOI] [PMC free article] [PubMed] [Google Scholar]
Associated Data
This section collects any data citations, data availability statements, or supplementary materials included in this article.