

Abstract
The application of the ideal binary mask to an auditory mixture has been shown to yield substantial improvements in intelligibility. This mask is commonly applied to the time-frequency (T-F) representation of a mixture signal and eliminates portions of a signal below a signal-to-noise-ratio (SNR) threshold while allowing others to pass through intact. The factors influencing intelligibility of ideal binary-masked speech are not well understood and are examined in the present study. Specifically, the effects of the local SNR threshold, input SNR level, masker type and errors introduced in estimating the ideal mask are examined. Consistent with previous studies, intelligibility of binary-masked stimuli is quite high even at -10 dB SNR for all maskers tested. Performance was affected the most when the masker dominated T-F units were wrongly labeled as target-dominated T-F units. Performance plateaued near 100% correct for SNR thresholds ranging from -20 dB to 5 dB. We believe the existence of the plateau region suggests that it is the pattern of the ideal binary mask that matters the most rather than the local SNR of each T-F unit. This pattern directs the listener's attention to where the target is and enables them to segregate speech effectively in multi-talker environments.
I. Introduction
Human listeners are able to understand speech even when it is masked by one or more competing voices. The speech segregation process is often approximated at the basic level by two distinct stages. In the first stage, the auditory periphery decomposes the auditory mixture to an array of individual time-and-frequency (T-F) units, with each unit representing the acoustic signal occurring at a particular instance in time and frequency, and with the size (e.g., bandwidth and duration) of each unit representing the smallest auditory event that can be resolved. The listener is able to reliably detect the acoustic energy of the target voice in time and frequency (T-F) regions wherein the target is at least as strong as the masker. In the second stage, the listener examines all T-F units in the mixture and uses a priori information about the target signal as well as a multitude of other cues to segregate the T-F units of the target and integrate (or somehow group) all these units into a single auditory image of the target signal. Cues such as common periodicity across frequency, common offsets and onsets, amplitude and frequency modulations, are believed to be involved and used by human listeners in the above auditory scene analysis (Bregman, 1990).
Several computational auditory scene analysis (CASA) techniques were proposed in the literature modeling the above two-stage segregation process (Wang and Brown, 2006). The goal of CASA techniques was to segregate only the target signal, rather than all interfering sources, from the sound mixtures, and the means suggested for achieving this goal was the ideal T-F binary mask (Wang, 2005). The ideal binary “mask” takes values of zero and one, and is constructed by comparing the local SNR in each T-F unit against a threshold (e.g., 0 dB). The ideal mask is commonly applied to the T-F representation of a mixture signal and eliminates portions of a signal (those assigned to a “zero” value) while allowing others (those assigned to a “one” value) to pass through intact.
A recent study (Brungart et al., 2006) demonstrated the potential of using ideal binary masks for improving the intelligibility of speech masked by one or more interfering voices. A number of other studies (Roman et al., 2003; Roman and Wang, 2006; Cooke, 2006; Brungart et al., 2006; Anzalone et al., 2006) have shown that speech synthesized from the ideal binary mask is highly intelligible even when extracted from multi-source mixtures (Roman et al., 2003) or in reverberant conditions (Roman and Wang, 2006). Ideal masks that are not binary but take real values have also been found to improve speech intelligibility (Li and Loizou, 2007). Roman et al. (2003) assessed the performance of an algorithm that used location cues and an ideal time-frequency binary mask to synthesize speech. Large improvements in intelligibility were obtained from partial spectro-temporal information extracted from the ideal time-frequency mask. Similar findings were also reported by Brungart et al. (2006), for a range of SNR thresholds (-12 to 0 dB) used for constructing the ideal binary mask. A different method for constructing the ideal binary mask was used by Anzalone et al. (2006) based on comparisons of the speech energy detected in various bands against a preset threshold. The threshold value was chosen such that a fixed percentage (99%) of the total energy contained in the entire stimulus was above this threshold. Results with the ideal speech energy detector indicated significant reductions in speech reception thresholds (SRTs) for both normal-hearing and hearing-impaired listeners. Cooke (2006) used a computational model of glimpsing along with behavioral data collected from normal-hearing listeners on a consonant identification task. Close fits to listener's performance on a consonant task were obtained with local SNR thresholds in the range of -2 to 8 dB.
It is clear from the above studies that the application of ideal binary masks is critically important for improving intelligibility of speech corrupted by interfering voices (or other types of maskers) by both normal-hearing and hearing-impaired listeners. In general, the study of ideal binary masks is important because it can be used for modeling the human auditory scene analysis process (Wang, 1996; Cooke, 2006), for evaluating the relative contributions of informational and energetic masking to overall perception of auditory mixtures (Brungart et al., 2006), for improving the accuracy of automatic speech recognition systems (Cooke et al., 2001; Srinivasan et al., 2006) and for elucidating neurophysiological mechanisms underlying auditory scene analysis (McCabe and Denham, 1997; Alain, 2005).
In many of the above studies, it is assumed that an ideal binary mask is available. In a practical system, the binary mask needs to be estimated from the noisy data, and that is a challenging task, particularly in adverse noisy conditions. Since it is practically impossible to compute accurately the ideal binary mask for all T-F units, it is of interest to assess the effect of estimation errors on speech intelligibility. At issue is how accurate do we need to estimate the binary mask without compromising speech intelligibility. No studies have yet addressed that question. Other factors that may influence intelligibility of speech synthesized by the ideal (or estimated) binary mask include the choice of the local SNR threshold(s), the masker type (modulated vs. steady-state), speech materials and input global SNR level. The effect of the local SNR threshold on speech intelligibility (and to some extent the masker type) was assessed in the study by Brungart et al. (2006) using the Coordinate Response Measure (CRM) corpus (Bolia et al., 2000) as test material. The CRM test, however, is a closed-set test which is restricted to four phonetically distinct color alternatives and eight phonetically distinct number alternatives, both of which are easy to understand even in extremely noisy environments (Brungart et al., 2001a, 2001b). It is not known whether the intelligibility benefit seen in Brungart et al. (2006) carries through to other more challenging speech materials using the same range of SNR thresholds and input SNR levels. In the present study, we assess the intelligibility of ideal binary-masked speech using IEEE sentences as test material and speech-shaped noise or competing voices as maskers.
II. Experiment 1: Effect of SNR Threshold and Input SNR Level
1. Methods
A. Subjects
Seven normal-hearing listeners participated in this experiment. All subjects were native speakers of American English, and were paid for their participation. The subjects' age ranged from 18 to 40 yrs, with the majority being undergraduate students from the University of Texas at Dallas.
B. Stimuli
The speech material consisted of sentences taken from the IEEE database (IEEE, 1969). All sentences were produced by a male speaker. The sentences were recorded in a sound-proof booth (Acoustic Systems) in our lab at a 25 kHz sampling rate. Details about the recording setup and copies of the recordings are available in Loizou (2007). The sentences were corrupted by a 20-talker babble (Auditec CD, St. Louis) at -5 dB and -10 dB SNR. These SNR levels were chosen to avoid floor effects. The babble interferer started at 100 ms before the beginning of each sentence and stopped at least 100ms after the end of the sentence. The same babble segment was used for all sentences. The effect of using different types of maskers is investigated in Experiment 2.
C. Signal Processing
The processing involved in the synthesis of ideal binary-masked (IdBM) stimuli made use of three signals: the target signal (prior to mixing), the masker (or interfering) signal and the resulting mixture. Each of these signals was first processed using a Fast Fourier Transform (FFT) applied to 20-ms segments of the signal (Hamming windowed) with 50% overlap between segments. A bank of 128 gammatone filters, with auditory-like frequency resolution, was used in Brungart et al. (2006) in place of the FFT. Following the above T-F decomposition, a comparison is made between the energy of the target and that of the masker. The resulting local SNR of each T-F unit is compared against a preset threshold value T to determine whether to retain the T-F unit (binary mask value is 1) or to eliminate it (binary mask value is 0). The computed pattern of binary mask values, consisting of 0s and 1s, is applied to the FFT magnitude spectrum of the mixture signal. The inverse FFT is finally applied to the modified magnitude spectrum to synthesize the IdBM stimuli. The phases of the mixture FFT spectra were used in the inverse FFT. Stimuli are synthesized in each 20-msec segment using the overlap-and-add method.
In the present experiment, we varied the local SNR threshold value T from -40 dB to +15 dB in steps of 5 and 10 dB, and assessed performance for each value of T. When the SNR threshold value is set to 0 dB, for instance, only T-F units that have larger energy than the masker are kept, and the remaining units are zeroed out. Figure 1 illustrates the IdBM processing for two different values of SNR threshold (-10 dB and 0 dB) for a mixture embedded in multi-talker babble at -5 dB SNR (measured from the rms energy of the utterance). The middle panels show the ideal binary masks, with white indicating a 1 and black indicating a 0. The bottom panels show the segregated mixtures. As can be seen from this Figure, the smaller the value of the SNR threshold is, the larger the number of T-F units retained, and in principle the original mixture corresponds to an SNR threshold value of −∞. At the other extreme, increasing the SNR threshold reduces the total number of T-F units retained. The question addressed in this experiment, is what range of SNR thresholds is optimal in terms of obtaining the highest levels of speech intelligibility.
Figure 1.
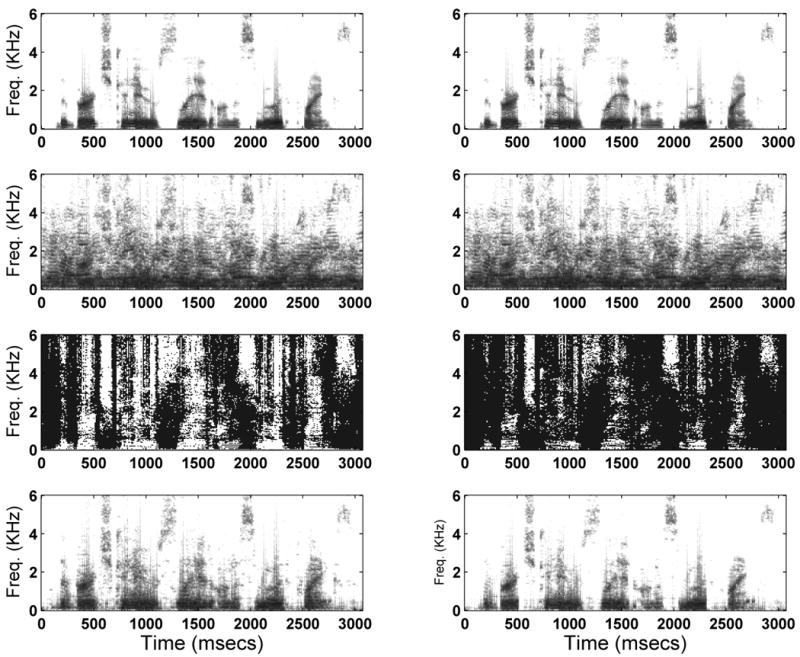
Top row shows the spectrogram of a sentence in quiet from the IEEE corpus. The second row (from top) shows the spectrograms of the sentence embedded in multi-talker babble at -5 dB SNR. The second row (from bottom) shows the ideal binary mask obtained using an SNR threshold of -10 dB (left) and 0 dB (right), with white pixels indicating a 1 (target stronger than the masker) and black pixels indicating a 0 (target weaker than the masker). Bottom row shows the segregated mixtures obtained with SNR thresholds of -10 dB (left) and 0 dB (right).
D. Procedure
The experiments were performed in a sound-proof room (Acoustic Systems, Inc) using a PC connected to a Tucker-Davis system 3. Stimuli were played to the listeners monaurally through Sennheiser HD 250 Linear II circumaural headphones at a comfortable listening level. Prior to the test, each subject listened to a set of noisy sentences to familiarize them with the testing procedure. During the test, the subjects were asked to write down the words they heard. Subjects participated in a total of 18 conditions (= 2 SNR levels × 8 SNR thresholds + 2 conditions involving the unprocessed mixtures). Two lists of sentences (i.e., 20 sentences) were used per condition, and none of the lists were repeated across conditions. Sentences were presented to the listeners in blocks, with 20 sentences/block in each condition. The order of the test conditions was randomized across subjects.
2. Results and discussion
The mean scores for all conditions are shown in Figure 2. Performance was measured in terms of percent of words identified correctly (all words were scored). Two-way ANOVA (with repeated measures) indicated a significant effect of local SNR threshold value (F[7,42]=398.5, p<0.0005), a significant effect of input SNR level (F[1,6]=267.0, p<0.0005) and a significant interaction (F[7,42]=30.6, p<0.0005).
Figure 2.

Performance (percent of words identified correctly) as a function of SNR threshold (dB) for two input global SNR levels. The masker was 20-talker babble. Performance obtained with unprocessed mixtures is indicated as “UN”. Error bars indicate standard errors of the mean.
Overall, the general pattern of performance is similar to that obtained by Brungart et al. (2006) with the CRM corpus. Significant gains in intelligibility are obtained with the IdBM processed speech for a range of SNR threshold values. Intelligibility of the -10 dB mixture improved from near 0% correct (unprocessed) to near 100% correct when processed using the ideal binary mask. Similarly, the intelligibility of the -5 dB mixture improved from 24% (unprocessed) to near 100%. The range of threshold values for which performance plateaued (near 100% correct) is slightly wider for mixtures at -5 dB SNR than for mixtures at -10 dB SNR. Protected post-hoc tests (Fisher's LSD) were run to determine the plateau region for each SNR level. Analysis indicated that the plateau region for mixtures in -5 dB SNR ranged from -20 to 5 dB, while the plateau region for mixtures in -10 dB SNR ranged from -20 dB to 0 dB. Brungart et al. (2006) reported a smaller region, -12 dB to 0 dB, however they used different test speech materials (CRM corpus) which lacked contextual cues.
Performance degraded markedly with IdBM stimuli for values of T smaller than -30 dB. We attribute this to the listeners being confused as to which T-F units belonged to the target and which units belonged to the masker. Interestingly enough, the ability of the listeners to segregate the target was not impaired at all when very strong masker units (by 20 to 30 dB) were included in the IdBM stimuli, i.e., with T=-20 dB and T=-30 dB. Auditory masking effects, access to contextual cues and the overall pattern of the binary mask (in terms of location of masker units relative to the target units) could have contributed to that (see discussion in later section). Performance with T=-40 dB was not statistically different (p>0.05) from that attained with the unprocessed mixtures for both SNR levels.
Performance of the processed mixtures at -10 dB SNR dropped precipitously for positive values of T. This can be attributed to the fact that as the input SNR level of the mixture decreases, the number of T-F units retained also decrease. In fact, for every 1 dB increase in T (T>0 dB), we observe a decrement in performance equivalent to that obtained when the input SNR level decreases by 1 dB and the value of T remains unchanged. This means that each 1 dB increase in T eliminates exactly the same T-F units that would have been eliminated if T remained unchanged but the input SNR decreased by 1 dB. This can be seen in Figure 2. Performance of IdBM stimuli obtained for mixtures at -5 dB SNR dropped from near 100% to 80% correct when T increased from 5 to 10 dB. Note that the same level of performance was obtained when the SNR of the mixtures decreased by 5 dB for the same value of T (T=5 dB). This outcome is consistent with that observed in Brungart et al. (2006) and has important implications in terms of assessing the energetic and informational components of speech-on-speech masking (see discussion in later section).
III. Experiment 2: Effect of Masker Type on Speech Intelligibility
In the previous experiment, we assessed performance using a single type of masker (20-talker babble). Acknowledging that performance might be affected by the use of different types of maskers, we examine in this experiment the performance of IdBM stimuli using modulated noise, steady-state noise and 2-talker maskers. This Experiment will tell us whether the IdBM technique is more effective when the masking has both informational and energetic components, as that introduced by competing voices, or when the masking is purely energetic, as that introduced by steady-state noise.
1. Methods
A. Subjects and material
Seven new normal-hearing listeners participated in this Experiment. All subjects were native speakers of American English, and were paid for their participation. Same speech material (IEEE, 1969) was used as in Experiment 1.
B. Signal Processing
Same signal processing technique was used as described in Experiment 1. Three types of maskers were used. The first was continuous (steady-state) noise, henceforth referred to as SSN noise, which had the same long-term spectrum as the test sentences in the IEEE corpus. The second was two equal-level interfering talkers (female) based on two of the longest sentences in the corpus (this was done to ensure that all target sentences were shorter than the interferers). The third masker was a speech-shaped noise masker that was modulated to match the overall envelope of the IEEE sentences used for the 2-talker masker. We refer to the modulated speech-shaped noise as MSSN noise. The MSSN noise was constructed by modulating speech-shaped noise (SSN) with the waveform envelope of the 2-talker masker. The envelope was extracted using a method similar to that described by Festen and Plomp (1990) by full-wave rectifying the speech masker and low-pass filtering (40-Hz cutoff) the rectified signal. The sentences were corrupted by the three types of maskers at –5 dB SNR.
C. Procedure
The procedure was identical to that used in Exp. 1. Subjects participated in a total of 27 conditions (= 3 maskers × 8 SNR thresholds + 3 conditions involving unprocessed mixtures). The SNR thresholds tested were the same as in Experiment 1, except for the addition of the T=25 dB condition and the elimination of the T=-10 dB condition. The latter condition was eliminated as it yielded (based on pilot data) the same performance as the T=-20 dB condition. Due to the large number of conditions involved, subjects performed the listening tests in two independent sessions on different days, with each session lasting approximately 2.5 to 3 hrs. Subjects were given 5 min breaks every 30 min of testing. Two lists of sentences (i.e., 20 sentences) were used per condition, and none of the lists were repeated across conditions. The order of the test conditions was randomized across subjects.
2. Results and Discussion
The mean scores for all conditions are shown in Figure 3. Performance was measured in terms of percent of words identified correctly (all words were scored). Two-way ANOVA (with repeated measures) indicated a significant effect of local SNR threshold value (F[7,42]=499.2, p<0.0005), a significant effect of masker type (F[2,12]=114.7, p<0.0005) and a significant interaction (F[14,84]=40.1, p<0.0005).
Figure 3.

Performance (percent of words identified correctly) as a function of SNR threshold (dB) for three types of maskers: modulated speech-shaped noise (MSSN), steady-state speech-shaped (SSN) noise and 2-talker masker. Performance obtained with unprocessed mixtures (at -5 dB SNR) is indicated as “UN”. Error bars indicate standard errors of the mean.
The range of threshold values for which performance plateaued near 100% correct was similar for the three types of maskers. Protected post-hoc tests (Fisher's LSD) were run to determine the plateau region for each masker. For the SSN masker it ranged from -30 dB to +5 dB, for the MSSN masker it ranged from -20 dB to + 5 dB and for the 2-talker masker it ranged from -20 dB to +10 dB.
Performance obtained with the three different types of maskers was very similar for negative values of T. Scores obtained with IdBM stimuli using T=-40 dB were not statistically different (p>0.05) from the scores obtained with the unprocessed mixtures for all three types of maskers. The difference in performance with the three types of maskers was more evident for positive values of T. Scores dropped significantly with the SSN masker when T>5 dB. The performance drop seen with the two modulated maskers (modulated noise and 2-talker masker) was also significant but more gradual. This outcome clearly illustrates the intelligibility benefit obtained when listening “in the gaps” of a fluctuating masker (Festen and Plomp, 1990). These gaps have presumably more favorable SNR which listeners exploit to hear out the target signal.
As demonstrated in the previous Experiment, the performance obtained with increasing T by say +L dB is equivalent to that obtained by decreasing the input SNR by L dB at a fixed value of T (Brungart et al., 2006). Making use of this approximation and after comparing the performance obtained with unprocessed mixtures with that obtained with positive values of T, we can conclude that the intelligibility improvement (in terms of SNR benefit) brought by the IdBM technique for SSN maskers is about 7 dB. Similarly, the improvement for MSSN maskers is 10 dB and for 2-talker maskers is near 15 dB. Thus it seems that the IdBM technique is more effective, in terms of improving intelligibility, when the target speech is masked by speech than when it is masked by noise. This outcome is consistent with that observed by Brungart et al., (2006). The improvement brought by the IdBM technique for speech masked by noise is smaller (compared to the speech maskers), nevertheless it is quite significant, about 50 percentage points (Fig. 3).
IV. Experiment 3: Effect of Overall Binary Mask Error
In the previous experiments, we assumed that we had access to the ideal binary mask. In practice, however, the binary mask needs to be estimated from the mixtures. Algorithms (e.g., Hu and Wang, 2004) can be used in practice to estimate the SNR of each T-F unit and subsequently the binary mask pattern. Such algorithms will possibly make errors in labeling each T-F unit to 0 or 1, as we lack access to the masker signal. In the present experiment, we assess the effect of overall binary mask error on speech intelligibility. At issue is how accurate do algorithms need to be in estimating the binary mask without compromising the intelligibility brought by the IdBM technique.
1. Methods
A. Subjects and material
Seven new normal-hearing listeners participated in this Experiment. All subjects were native speakers of American English, and were paid for their participation. The same speech material (IEEE, 1969) was used as in Experiment 1.
B. Signal Processing
The ideal binary mask is first computed as in Experiment 1 with the use of the FFT operating on 20-msec segments of the signals (target, masker and mixture). To create stimuli with varying degrees of binary mask error, we randomly selected a fixed percentage of T-F units in each 20-ms frame and flipped the corresponding values of the ideal binary mask from 0 to 1 or from 1 to 0. We varied the percentage of binary mask error introduced in each 20-ms frame from 5% to 40%. More precisely, we tested the following amounts of error (in terms of percentage of T-F units in each 20-msec frame): 5%, 10%, 20%, 30% and 40%. The 5%-error condition, for instance, had 5% of the T-F units marked wrongly (i.e., 0 was labeled as 1 and vice versa) and the remaining 95% of the T-F units marked correctly (i.e., ideal binary mask was used) in each 20-ms frame. The new binary mask pattern containing fixed amounts of error in each frame was used to synthesize the stimuli using the same method described in Experiment 1.
To assess the effect of overall binary mask error on various maskers, we applied the above technique to mixtures corrupted by three different types of masker: steady-state speech-shaped noise, 2-talker masker and 20-talker babble (same as in Exp. 1). The former two maskers were the same as in Exp. 2.
C. Procedure
The procedure was identical to that used in Exp. 1. Subjects participated in a total of 18 conditions (= 3 maskers × 5 error values + 3 conditions involving unprocessed mixtures). Two lists of sentences (i.e., 20 sentences) were used per condition, and none of the lists were repeated across conditions. The order of the test conditions was randomized across subjects.
2. Results and Discussion
The mean scores for all conditions are shown in Figure 4. Performance was measured in terms of percent of words identified correctly (all words were scored). Performance obtained with the unprocessed mixtures is shown to the right (marked as ‘UN’) for comparison. Two-way ANOVA (with repeated measures) indicated a significant effect of masker type (F[2,12]=7.1, p=0.009), a significant effect of binary mask error (F[4,24]=432.3, p<0.0005) and a non-significant interaction (F[8,48]=0.5, p=0.791).
Figure 4.

Performance (percent of words identified correctly) as a function of the overall percentage of binary mask error introduced for three types of maskers: steady-state speech-shaped (SSN) noise, 2-talker masker and 20-talker masker. Performance obtained with unprocessed mixtures (at -5 dB SNR) is indicated as “UN”. Error bars indicate standard errors of the mean.
The pattern of performance was similar for all three maskers. Scores remained high (near 100% correct) when the binary mask error was less or equal to 10%, and dropped relatively fast thereafter. In fact, for every 10% error introduced, performance dropped roughly by 20 percentage points for both modulated and non-modulated maskers. Overall, there seems to be a strong (and negative) correlation between the amount of error introduced in the binary mask pattern and the intelligibility scores attained. In fact, the computed correlation coefficient between the binary mask error (percentage) and intelligibility score for the 15 conditions tested was quite high, ρ = −0.98 (p<0.005). We should acknowledge, however, that this correlation was computed using the IdBM stimuli from which we can compute the overall error.
Regarding the question posed in this Experiment as to how accurate do binary-mask estimation algorithms need to be, we observe from Figure 4 that the answer depends on the type of masker and the set expectations. If the goal is to restore speech intelligibility (to the level attained in quiet), then the algorithm needs to produce at most 10% error when estimating the binary mask. This applies for all three types of maskers tested. If the goal is to improve speech intelligibility relative to that of the unprocessed mixtures, then different amounts of error can be tolerated depending on the type of masker. For the 20-talker masker, the overall error needs to be less than (or equal to) 30%, while for the 2-talker masker and steady-state noise, the error needs to be less than (or equal to) 20%.
V. Experiment 4: Effect of Type of Binary Mask Error
In the previous experiment, we assessed the effect of the overall error in the binary mask pattern making no distinction between the two types of error that can occur. The first type of error occurs when a T-F unit that was originally labeled as 0 (i.e., local SNR of T-F unit is less than threshold T) is purposefully modified to 1. The second type of error occurs when a T-F unit that was originally labeled as 1 (i.e., local SNR of T-F unit is greater than threshold T) is purposefully modified to 0. From signal detection theory, we can say that the first type of error is similar to type I error (false alarm) and the second type of error is similar to type II error1 (miss). Hence, for the purpose of discussion, we will refer to these two errors as type I and type II errors. The type I error will possibly introduce more noise distortion or more target-masker confusion, as T-F units that would otherwise be zeroed-out (presumably belonging to the masker or dominated by the masker) would now be retained. The type II error will likely introduce target speech distortion, as it will zero out T-F units that are dominated by the target signal and should therefore be retained. The perceptual effect of these two types of errors introduced in the binary masking pattern is likely different, and this is assessed in the present Experiment.
1. Methods
A. Subjects and material
The same subjects used in Exp.3 participated in this Experiment on a different day. Same speech material (IEEE, 1969) was used as in Experiment 1. None of the sentence lists was repeated.
B. Signal Processing
The ideal binary mask is first computed as in Experiment 1 with the use of the FFT operating on 20-msec segments of the signals (target, masker and mixture). To create stimuli with varying degrees of type I and type II binary mask errors, we followed a procedure similar to that in Experiment 3. As we wanted to assess independently the effect of type I and II errors, we kept for the type-II stimuli all T-F units originally labeled as 0 (according to the ideal binary mask) and introduced varying degrees of error only to units originally labeled as 1. Hence, we created type-II stimuli by introducing a fixed percentage of errors only to the T-F units labeled as 1 (according to the ideal binary mask). No errors were introduced to the T-F units originally labeled as 0. Similarly, we created type-I stimuli by introducing a fixed percentage of errors only to the T-F units labeled as 0. No errors were introduced to the T-F units originally labeled as 1. We varied the percentage of type I/II errors introduced to the T-F units in each 20-ms frame, from 20% to 95%. More specifically we tested the following amounts of error (in percentage of T-F units available in each frame): 20%, 40%, 60%, 70%, 80%, 85%, 90% and 95%. In the 20% type-II error condition, for instance, 20% of the T-F units in each 20-ms frame that were originally marked as 1 were flipped to 0, while the remaining units were kept intact. That is, no errors were introduced to the T-F units originally labeled as 0. The new binary mask pattern containing fixed amounts of type I/II error was applied to the mixtures. The same method described in Experiment 1 was used to synthesize the stimuli.
Given the limited number of lists available in the IEEE corpus, we applied the above technique only to mixtures embedded in 20-talker babble at –5 dB SNR. As the local SNR threshold of T=0 dB was found to be quite effective in the previous Experiments for all types of maskers and SNR levels, we assessed the effect of type I and II errors using T=0 dB.
C. Procedure
The procedure was identical to that used in Exp. 1. Subjects participated in a total of 17 conditions (= 2 types of error × 8 error values + 1 condition involving unprocessed mixtures). Two lists of sentences (i.e., 20 sentences) were used per condition, and none of the lists were repeated across conditions. The order of the test conditions was randomized across subjects.
2. Results and Discussion
The mean scores for all conditions are shown in Figure 5. Performance was measured in terms of percent of words identified correctly (all words were scored). Performance obtained with the unprocessed mixtures is shown to the right (marked as ‘UN’) for comparison. Two-way ANOVA (with repeated measures) indicated a significant effect of the type of error (F[1,6]=163.7, p<0.0005), a significant effect of the amount of error (F[7,42]=242.2, p<0.0005) and a significant interaction (F[7,42]=44.2, p<0.0005).
Figure 5.

Performance (percent of words identified correctly) as a function of the percentage of binary mask error introduced for two types of error, type I and type II (see text for details). The masker was 20-talker babble. Performance obtained with unprocessed mixtures (at -5 dB SNR) is indicated as “UN”. Error bars indicate standard errors of the mean.
It is clear from Figure 5 that the type of error introduced in the binary mask pattern affected performance differently and to a different extent. There was a gradual degradation in performance when type II errors were introduced. Performance remained high (near 100% correct) even when 60% of the T-F units originally labeled as 1 were purposefully switched to 0 (assuming no errors were introduced in the T-F units originally labeled as 0). Post-hoc tests (Fisher's LSD) indicated that performance obtained with 60% type-II error was not statistically different (p=0.377) from performance obtained with 20% error. As one would expect, performance dropped substantially when the error exceeded 80%, since the overwhelming majority of the target-dominated T-F units were eliminated.
In stark contrast, the type I error affected performance dramatically, even when small amounts (20%) of error were introduced. Performance dropped from nearly 100% correct obtained with the ideal binary mask (0% error, Fig. 2) to 80% correct with 20% error. Note that with this type of error, all T-F units originally labeled as 1 remained intact, i.e., no errors were introduced in the target-dominated T-F units. We attribute the dramatic decrease in performance with type I errors to the following two reasons. First, the number of T-F units labeled by the ideal binary mask as 0 (i.e., with local SNR < 0 dB) is substantially larger than the corresponding number of T-F units labeled as 1 (i.e., with local SNR >0 dB). Consequently, a larger number of T-F units are wrongly labeled when type I error is introduced in the binary masking pattern than when type II is introduced despite the fact that percentage of error is the same for the two types of error. To corroborate this observation, we plot in Figure 6 the histogram of the percentage of T-F units in each frame that have local SNR threshold greater or smaller than 0 dB (input mixture was corrupted by 20-talker babble at -5 dB SNR). Based on the histogram average (Fig. 6), 80% of the T-F units in each 20-ms frame are labeled 0 (i.e., local SNR < 0 dB) and the remaining 20% are labeled as 1 (i.e., local SNR > 0 dB). Hence, the overwhelming majority of the T-F units are labeled as 0. The second reason for the dramatic decrease in performance with type I errors is that it increases the target-masker confusions. For the masker (competing voices) used in this Experiment, type I errors increase the amount of informational masking. As more T-F units are introduced with large and negative local SNRs, listeners have greater difficulty distinguishing the target voice from the interfering voices.
Figure 6.

Histograms of the percentage of T-F units in each 20-ms frame falling below the SNR threshold (0 dB) and above the SNR threshold. The mixture was corrupted at -5 dB SNR in 20-talker babble. The histogram was computed using all 720 sentences in the IEEE corpus and was based on a total of 190,386 frames.
Figure 5 superimposes the performance obtained with the unprocessed mixtures. Analysis (paired samples t-tests) indicated that in order to obtain significant (p<0.005) improvement in speech intelligibility, the type I and II errors need to be lower than 85%. There is no statistically significant (p>0.05) difference between the performance obtained with unprocessed mixtures and that obtained with 90% type I or type II error. These results are interesting as they provide insights as to the amounts of type I or II “errors” typically present in unprocessed mixtures at –5 dB SNR. They also provide performance bounds on algorithms that can potentially be used to estimate the ideal binary mask. In the context of such algorithms, it is clear from Figure 5 that it is more important to find techniques to keep the type I error low than keep the type II error low, although understandably a balance needs to be struck between the magnitude of the two errors. The consequences of type I error are counterintuitive as one would expect that it is more important to ensure that all target-dominated T-F units are labeled correctly rather than ensuring that all masker-dominated T-F units are labeled correctly. That is not the case, however, as can be seen from Figure 5 by contrasting the performance obtained with type I and II errors for the same percentage of error. Taking the 60% error as an example, we see that performance dropped to 50% correct when type I error was introduced despite the fact that all target-dominated units were classified correctly. In contrast, when type II error was introduced with all masker-dominated units classified correctly, there was no noticeable decrease in performance (remained near 100% correct).
IV. Discussion and Conclusions
The outcomes in Experiments 1 and 2 have important implications for understanding speech segregation in multi-talker environments. Equally important are the implications of Experiments 3 and 4 for designing algorithms capable of estimating the ideal binary mask with the intent of suppressing interfering noise or competing voices for improved speech intelligibility.
A. Speech segregation
The present study replicated and extended the findings of the study by Brungart et al. (2006). There are a number of similarities and a number of differences between the outcomes of the two studies. The overall pattern of performance was very similar in the two studies. Performance reached a plateau (near 100% correct) in the region near 0 dB SNR threshold and dropped for large and small values of the local SNR threshold. This pattern was observed for all types of maskers tested whether be modulated or steady-state. The application of the IdBM technique is more effective, in terms of intelligibility improvement, when speech is masked by speech (largely informational masking with some energetic masking) than when it is masked by steady-state noise (purely energetic masking). Experiment 1 confirmed the approximation that each 1 dB increase in the SNR threshold eliminates the same T-F units that would be have been eliminated by each 1 dB decrease in the global SNR. With this approximation, we can say that the amount of informational masking produced by the speech maskers (2 talkers) in Experiment 2 was roughly 20 dB while that produced by the (energetic) noise masker is about 10-12 dB. Note that Experiment 2 used different-sex masker and target voices; hence, a greater amount of informational masking could potentially be introduced by using same-sex masker and target voices (Brungart, 2001a).
The main difference between the outcomes of this study and that of Brungart et al. (2006) was the plateau region. In the Brungart et al. study, the plateau region ranged from -12 dB to 0 dB, while in the present study, the plateau region ranged in most cases from -20 dB to 5 dB and in the steady-state noise case from -30 dB to 5 dB. We attribute this difference primarily to the use of different speech materials. In our study, listeners had access to contextual cues which we believe enabled them to segregate the target speech easily even after including strong (by 20 dB) masker T-F units in the synthesized stimuli. In contrast, there is no contextual information present in the CRM phrases. Taking the outcomes of both studies into account, we can conclude that the width of the performance plateau region (near 100% correct) is greatly affected by the speech material used. Another potential factor contributing to the differences in the plateau region between the two studies might be the use of different T-F decomposition techniques. The present study used the FFT, which implicitly uses a uniform frequency spacing, to construct the IdBM stimuli. In contrast, Brungart et al. used a bank of 128 gammatone filters, with auditory-like frequency resolution (i.e. progressively wider filters in the high frequencies) in place of the FFT. Further experiments are warranted to examine the impact of the T-F decomposition technique (FFT vs. auditory-like filterbank) on the intelligibility of IdBM stimuli.
The existence of a wide plateau region has important implications for speech segregation in multi-talker environments. In this region, the stimuli contain not only target T-F units, but also units with stronger masker energy. In fact, in some cases the masker is stronger than the target by 20 dB. Yet, these masker units did not interfere with the recognition of the target speech (performance remained near 100% correct). We believe that this is not because there were not enough of them (see Figure 6) but rather because they occurred in regions that already contained enough target energy. The existence of the plateau regions suggests that it is the pattern of the ideal binary mask (i.e., the pattern of target-dominated and masker-dominated T-F units) that matters the most and not the local SNR of each T-F unit, since conceivably different local SNR thresholds may yield the same binary mask pattern (Brungart et al., 2006). It is this pattern that directs the listener's attention to where (in a T-F auditory space) the target is, and this can be viewed as a perceptual mechanism that does not require the listeners to extract specific target information within each T-F unit and somehow group all pieces of the detected T-F units to hear out the target. The ideal binary mask pattern provides the cue to where the target is, an essential cue that is probably used in the second (or later) stage of the speech segregation process. The importance of the where cue is also observed and mirrored (perhaps more clearly) in spatial hearing. Information about where the target is located in space can greatly enhance its identification (Kidd et al., 2005; Best et al., 2007).
B. Noise reduction
The present study, as well as others, have demonstrated the full potential of using the ideal binary mask to improve (and in some cases restore) intelligibility of speech in multi-talker or other noisy environments. Algorithms capable of estimating the ideal binary mask accurately can therefore yield significant gains in intelligibility, which according to Exp. 1 can range from 70 to 100 percentage points (Exp. 1) improvement for input global SNRs of -5 and -10 dB respectively. As demonstrated in Exp. 3, these algorithms need to be quite accurate (>90 % accurate) in estimating the ideal binary mask, at least for acoustic mixtures in -5 dB SNR. A 10% (or smaller) overall error in estimating the ideal binary mask is acceptable without compromising speech intelligibility (see Fig. 4), at least for mixtures in -5 dB multi-talker babble. Exp. 4 showed that the type of error made in classifying target and masker dominated T-F units is perhaps more important than the overall amount of error. Performance is affected the most when the masker dominated T-F units are wrongly labeled as target-dominated T-F units. In contrast, performance remains high (near 100% correct) if all masker-dominated T-F units are correctly classified but the target-dominated T-F units are misclassified with 60% (or less) error. The outcome in Exp. 4 suggests that a right balance needs to be struck between the two types of errors, as both can affect performance, although to a different degree. This tradeoff between type I and type II errors is often summarized in detection theory via the receiver operating characteristic curves (ROC) (e.g., Kay, 1998). Each pair of type I and (1-type II) values provides a different point in the ROC curve, with best performance obtained when both types of error are small.
A number of techniques have been proposed in the CASA literature (see review in Wang and Brown, 2006) for estimating the ideal binary mask and include methods based on pitch continuity information (Hu and Wang, 2004; Roman and Wang, 2006) and sound-localization cues (Roman et al., 2003). In the method by Hu and Wang (2004), the individual T-F units are labeled according to the similarity between the periodicity pattern of the correlogram response and the dominant pitch of each frame. This method (and the method in Roman and Wang, 2006), however, is only applicable to voiced utterances and was evaluated using only objective measures and not with listening tests. Most of the CASA techniques proposed thus far are based on elaborate auditory models and make extensive use of grouping principles (e.g., pitch continuity, onset detection) to segregate the target from the mixture. Alternatively, the ideal binary mask can be estimated using simpler algorithms that compute the SNR in each T-F unit and compare the estimated SNR values against a threshold. Several such algorithms do exist and are commonly used in speech enhancement applications to improve the quality of degraded speech (see review in Loizou, 2007). To assess how accurate are such algorithms, we processed the -5 dB SNR mixtures (20-talker babble) via two conventional noise reduction algorithms, which we found in a previous study to preserve intelligibility (Hu and Loizou, 2007a), and computed the percentage of errors made in classifying target-dominated and masker-dominated T-F units (details are given in Appendix). Overall, the amounts of errors made by either algorithm are quite high (see Table 1), thus providing a plausible explanation as to why current noise reduction algorithms can not improve speech intelligibility, although they improve speech quality (Hu and Loizou, 2007b). More research is thus warranted in developing algorithms capable of estimating more accurately the ideal binary mask.
Table 1.
Errors (in percentage of T-F units misclassified) produced by two noise reduction algorithms in estimating the ideal binary mask for different values of the SNR threshold (dB). The overall error is computed (as in Exp. 3) by counting the misclassifications across all T-F units in each frame making no distinction between the two types of error.
| SNR threshold T | |||||
|---|---|---|---|---|---|
| Algorithm | Type of Error | -10 dB | - 5 dB | 0 dB | 5 dB |
| Wiener (Scalart & Filho, 1996) | Type I error (%) | 31.73 | 26.27 | 18.30 | 10.29 |
| Type II error (%) | 21.69 | 18.73 | 14.65 | 10.45 | |
| Overall error (%) | 53.42 | 45.00 | 32.95 | 20.74 | |
| Log-MMSE (Ephraim & Malah, 1985) | Type I error (%) | 24.66 | 16.49 | 9.72 | 5.57 |
| Type II error (%) | 25.13 | 21.54 | 16.40 | 11.27 | |
| Overall error (%) | 49.79 | 38.04 | 26.12 | 16.85 | |
Acknowledgments
The authors would like to thank Yang Lu for his help in some experiments. This research was supported by Grant No. R01 DC007527 from the National Institute of Deafness and other Communication Disorders, NIH.
Appendix
To assess the accuracy of conventional noise reduction algorithms in estimating the binary mask, we processed the -5 dB SNR mixtures (20-talker babble) via two conventional noise reduction algorithms, which we found in a previous study to preserve intelligibility (Hu and Loizou, 2007a). The two algorithms were first used to estimate the instantaneous SNR in each T-F unit as follows:
| (1) |
where SNR(t,k) is the estimated SNR at time frame t and frequency bin k, a = 0.98, denotes the power-spectrum of the enhanced target signal obtained in the previous frame, denotes the estimated power-spectrum of the masker (obtained using a noise-estimation algorithm, Rangachari and Loizou, 2006), and denotes the mixture power spectrum. The two noise reduction algorithms differed in the way they estimated in Eq. 1, but both used Eq. 1 to estimate the instantaneous SNR. The estimated SNR of each T-F unit was compared against a threshold (varying from -10 dB to 5 dB), and T-F units with positive SNR were classified as target-dominated T-F units and units with negative SNR were classified as masker-dominated units. The binary mask pattern estimated using the two algorithms was compared against the (true) ideal binary mask pattern. Errors were computed in each frame by comparing the true decision made by the ideal binary mask with the decision made by the SNR-estimation algorithm (Eq. 1) for each T-F unit. The percentage of type I/II errors were averaged across the 20 utterances tested. The results are given in Table 1 for different values of the local SNR threshold T. With T=0 dB (which is the value used in Exp 4) the type I and II errors are relatively large (>15%) and the overall error is even larger (∼30%). From Figure 5, we see that in order to obtain significant improvement in intelligibility, the type II error needs to be near 0% when the type I error is smaller than 20%. Changing the SNR threshold value affects markedly the amounts of type I and II errors introduced and does so in a manner that signifies the tradeoff between the probability of false alarm (type I error) and probability of detection (1-type II error) typically seen in ROC curves.
Footnotes
Type I error (also called false alarm) is produced when deciding hypothesis H1 (signal is present) when H0 is true (signal is absent). Type II error (also called miss) is produced when deciding H0 when H1 is true (Kay, 1998).
References
- Alain C. Speech separation: Further insights from recordings of event-related brain potentials in humans. In: Divenyi P, editor. Speech separation by humans and machines. Kluwer Academic Publishers; 2005. pp. 13–30. [Google Scholar]
- Anzalone M, Calandruccio L, Doherty K, Carney L. Determination of the potential benefit of time-frequency gain manipulation. Ear Hear. 2006;27(5):480–492. doi: 10.1097/01.aud.0000233891.86809.df. [DOI] [PMC free article] [PubMed] [Google Scholar]
- Bolia RWN, Ericson M, Simpson B. A speech corpus for multitalker communications research. J Acoust Soc Am. 2000;107:1065–1066. doi: 10.1121/1.428288. [DOI] [PubMed] [Google Scholar]
- Brungart D. Informational and energetic masking effects in the perception of two simultaneous talkers. J Acoust Soc Am. 2001a;109(3):1101–1109. doi: 10.1121/1.1345696. [DOI] [PubMed] [Google Scholar]
- Brungart D, Simpson B, Ericson M, Scott K. Informational and energetic masking effects in the perception of multiple simultaneous talkers. J Acoust Soc Am. 2001b;110:2527–2538. doi: 10.1121/1.1408946. [DOI] [PubMed] [Google Scholar]
- Brungart D, Chang P, Simpson B, Wang D. Isolating the energetic component of speech-on-speech masking with ideal time-frequency segregation. J Acoust Soc Am. 2006;120(6):4007–4018. doi: 10.1121/1.2363929. [DOI] [PubMed] [Google Scholar]
- Cooke MP, Green PD, Grawford MD. Handling missing data in speech recognition. Proc 3rd Int Conf Spok Lang Proc. 1994:1555–1558. [Google Scholar]
- Cooke M. Glimpsing speech. J Phonetics. 2003;31:579–584. [Google Scholar]
- Cooke M. Making sense of everyday speech: A glimpsing account. In: Divenyi P, editor. Speech separation by humans and machines. Kluwer Academic Publishers; 2005. pp. 305–314. [Google Scholar]
- Cooke MP, Green PD, Josifovski L, Vizinho A. Robust automatic speech recognition with missing and uncertain acoustic data. Speech Commun. 2001;34:267–285. [Google Scholar]
- Cooke MP. A glimpse model of speech perception in noise. J Acoust Soc Am. 2006;119(3):1562–1573. doi: 10.1121/1.2166600. [DOI] [PubMed] [Google Scholar]
- Ephraim Y, Malah D. Speech enhancement using a minimum mean-square error log-spectral amplitude estimator. IEEE Trans Acoust Speech Signal Process. 1985;ASSP-23(2):443–445. [Google Scholar]
- Festen J, Plomp R. Effects of fluctuating noise and interfering speech on the speech-reception threshold for impaired and normal hearing. J Acoust Soc Am. 1990;88:1725–1736. doi: 10.1121/1.400247. [DOI] [PubMed] [Google Scholar]
- Hu G, Wang D. Monaural speech segregation based on pitch tracking and amplitude modulation. IEEE Trans Neural Netw. 2004;15:1135–1150. doi: 10.1109/TNN.2004.832812. [DOI] [PubMed] [Google Scholar]
- Hu Y, Loizou P. A comparative intelligibility study of speech enhancement algorithms. Proc IEEE Intern Conf Acoustics Speech Signal Processing. 2007a;4:561–564. [Google Scholar]
- Hu Y, Loizou P. Subjective comparison and evaluation of speech enhancement algorithms. Speech Comm. 2007b doi: 10.1016/j.specom.2006.12.006. in press. [DOI] [PMC free article] [PubMed] [Google Scholar]
- IEEE. IEEE Recommended Practice for Speech Quality Measurements. IEEE Trans Audio Electroacoust. 1969;17(3):225–246. [Google Scholar]
- Kay S. Fundamentals of statistical signal processing: Detection theory. Upper Saddle River; Prentice Hall: 1998. [Google Scholar]
- Li N, Loizou P. Factors influencing glimpsing of speech in noise. J Acoust Soc Am. 2007;122(2) doi: 10.1121/1.2749454. in press. [DOI] [PMC free article] [PubMed] [Google Scholar]
- Loizou P. Speech Enhancement: Theory and Practice. CRC Press, Taylor Francis Group; Boca Raton: FL: 2007. [Google Scholar]
- McCabe S, Denham M. A model of auditory streaming. J Acoust Soc Am. 1997;101(3):1611–1621. [Google Scholar]
- Rangachari S, Loizou P. A noise estimation algorithm for highly non-stationary environments. Speech Communication. 2006;28:220–231. [Google Scholar]
- Roman N, Wang D, Brown G. Speech segregation based on sound localization. J Acoust Soc Am. 2003;114:2236–2252. doi: 10.1121/1.1610463. [DOI] [PubMed] [Google Scholar]
- Roman N, Wang D. Pitch-based monaural segregation of reverberant speech. J Acoust Soc Am. 2006;120:458–469. doi: 10.1121/1.2204590. [DOI] [PubMed] [Google Scholar]
- Scalart P, Filho J. Speech enhancement based on a priori signal to noise estimation. Proc IEEE Int Conf Acoust Speech Signal Processing. 1996:629–632. [Google Scholar]
- Srinivasan S, Shao Y, Jin Z, Wang D. A computational auditory scene analysis system for robust speech recognition. Proc Interspeech. 2006:73–76. [Google Scholar]
- Wang D. On ideal binary mask as the computational goal of auditory scene analysis. In: Divenyi P, editor. Speech separation by humans and machines. Kluwer Academic Publishers; 2005. pp. 181–187. [Google Scholar]
- Wang D, Brown G. Computational Auditory Analysis. John Wiley & Sons; 2006. [Google Scholar]
- Wang D. Primitive auditory segregation based on oscillatory correlation. Cognitive Science. 1996;20:409–456. [Google Scholar]