Abstract
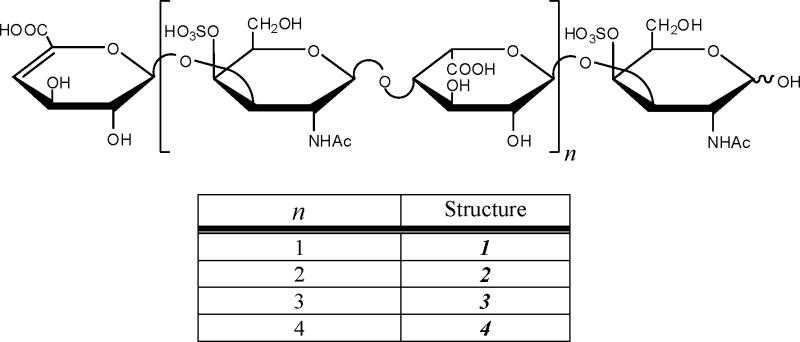
The structural characterization of glycosaminoglycans (GAG) oligosaccharides has been a longstanding challenge in the field of mass spectrometry. In this work, we present the application of electron detachment dissociation (EDD) Fourier transform mass spectrometry to the analysis of dermatan sulfate (DS) oligosaccharides up to 10 residues in length. The EDD mass spectra of DS oligosaccharides were compared to their infrared multiphoton dissociation (IRMPD) mass spectra. EDD produces more abundant fragmentation than IRMPD with far less loss of SO3 from labile sulfate modifications. EDD cleaves all glycosidic bonds, yielding both conventional glycosidic bond fragmentation as well as satellite peaks resulting from the additional loss of 1 or 2 hydrogen atoms. EDD also yields more cross-ring fragmentation than IRMPD. For EDD, abundant cross-ring fragmentation in the form of A- and X-ions is observed, with 1,5Xn cleavages occurring for all IdoA residues and many of the GalNAc4S residues, except at the reducing and nonreducing ends. In contrast, IRMPD produces only A-type cross-ring fragmentation for long oligosaccharides (dp6 – dp10). As all the structurally informative fragment ions observed by IRMPD appear as a subset of the peaks found in the EDD mass spectrum, EDD shows great potential for the characterization of GAG oligosaccharides using a single tandem mass spectrometry experiment.
INTRODUCTION
Glycosaminoglycans (GAGs) are linear polysaccharides that comprise the carbohydrate portion of many proteoglycans and are found in a variety of organisms ranging from bacteria to humans [1]. GAGs participate in a number of important biological activities, such as binding growth factors and chemokines [2,3], inhibiting proteolysis [4], affecting angiogenesis [5], and acting as signaling molecules in response to cellular damage [6]. GAGs also play an important role in pathogenic infections [7–9], and have been shown to undergo alteration in certain types of cancer [10]. GAGs are assigned to one of four classes: heparin and heparan sulfate (HS), dermatan sulfate (DS) and chondroitin sulfate (CS), hylauronic acid, and keratan sulfate (KS) [11]. With the exception of KS, GAGs are composed of alternating uronic acid and hexosamine residues with variable degrees of sulfation and N-acetylation. KS is composed of a hexose-hexosamine disaccharide repeat. There is significant interest in determining the pattern of sulfation, N-acetylation of basic residues, and C5 epimerization of the acidic residues, as these modifications are believed to determine the biological activity of the GAG chain. 1D and 2D NMR have been used to determine the type and location of GAG modification [12], as well as the stereochemistry of C5 on hexuronic acid, but NMR analysis requires milligram quantities of a high purity sample. As GAGs must be isolated from natural sources, they are often available only in low quantity and purity, and there is considerable interest in the development of more sensitive methods for structural analysis of GAGs.
Mass spectrometry (MS) and tandem mass spectrometry (MS/MS) are viable alternatives for the structural analysis of GAGs as they require small quantities of sample and can be used to examine complex mixtures. Progress in the development of MS methods of GAG analysis has been slow compared to protein analysis due to the anionic nature of GAGs and the lability of sulfate as a carbohydrate modification. Electrospray ionization (ESI) [13] and matrix assisted laser desorption ionization (MALDI) [14–17] have been used to ionize sulfated GAGs in intact form. However, MS/MS of sulfated GAGs often leads to loss of SO3, obscuring the position of modification. A number of tandem mass spectrometry approaches have been developed to overcome these problems. Zaia and Costello have shown that SO3 loss can be minimized and glycosidic bond cleavages maximized by increasing the charge state of an ion so that the number of charges on the molecule is equal to the number of sulfates [18]. Their work also demonstrated that the addition of divalent calcium to sulfated GAGs decreased SO3 loss during MS/MS. Saad and Leary [19] demonstrated that a mixture of heparin/HS disaccharides can be characterized using ESI with tandem mass spectrometry to distinguish isobaric disaccharides. Using this method, the authors were able to determine the disaccharide composition of biological samples using only mass spectrometry. Short lengths of GAGs can be analyzed by a combination of enzymatic digestion, tandem mass spectrometry (MS2 and MS3), and database searching [20]. While this approach can determine the pattern of modification (i.e. sulfation and acetylation), enzymatic digestion results in the formation of disaccharides containing C4 – C5 unsaturated uronic acid (ΔUA) at the non-reducing end (NRE), thereby converting glucuronic acid (GlcA) and iduronic acid (IdoA) into a single product (ΔUA) that eliminates chirality at C5 [21]. As the epimeric state of the hexuronic acid residues is thought to influence biological activity, it is important to be able to analyze GAG oligosaccharides which contain internal hexuronic acid residues that retain their chirality. Although tandem mass spectrometry is typically insensitive to stereochemistry, MS/MS of a series of isobaric CS samples has been shown to distinguish IdoA from GlcA as well as distinguish 4S- from 6S- sulfation based on the relative abundance of specific product ions [22].
We have recently reported the utility of electron detachment dissociation (EDD) [23–27] for the analysis of GAG HS tetrasaccharides [28,29]. EDD produces a radical anion, which undergoes more extensive fragmentation than that produced from activation of even electron ions by low energy or threshold dissociation methods. For HS tetrasaccharides, EDD produces both glycosidic bond and cross-ring fragmentation, revealing the sites of sulfation and acetylation, while minimizing SO3 loss. More recently, we demonstrated that EDD can distinguish the epimers IdoA from GlcA in HS tetrasaccharides [29]. While application of EDD to the characterization of HS tetrasaccharides appears very promising, the extension of this fragmentation technique to longer oligosaccharides remains an important goal. Many protein binding sites on GAGs are 3–9 disaccharides in length, and GAG binding sites up to 15 disaccharides in length have been reported [30–35]. Here we demonstrate the applicability of EDD to the structural analysis of DS oligosaccharides up to 10 saccharides in length.
MATERIALS AND METHODS
Preparation of DS Oligosaccharides
Dermatan sulfate (DS) oligosaccharides were prepared by partial enzymatic depolymerization of porcine intestinal mucosa dermatan sulfate (Celsus Laboratories, Cincinnati, OH). A 20 mg/mL dermatan sulfate solution in 50 mM Tris-HCl/60 mM sodium acetate buffer, pH 8 was incubated at 37°C with chondroitin ABC lyase from Proteus vulgaris, EC 4.2.2.4. (Seikagaku, Japan). After the absorbance at 232 nm indicated the digestion was 50% completed, the digestion mixture was heated at 100°C for 3 min. High-molecular-weight oligosaccharides and the enzyme were removed by ultra-filtration using a 5000 MWCO membrane. The resulting oligosaccharide mixture was concentrated by rotary evaporation and fractionated by low pressure GPC on a Bio-Gel P10 (Bio-Rad, Richmond, CA) column. Fractions containing tetra- to decasaccharides (dp4 – dp10, structures 1 – 4) were desalted by GPC on a Bio-Gel P2 column and freeze-dried [36]. Further purification of compounds 1 – 4 were carried out using strong anion exchange high-pressure liquid chromatography (SAX-HPLC) on a semi-preparative SAX S5 Spherisorb column (Waters Corp, Milford, MA). The SAX-HPLC fractions containing > 90% of 1 – 4 were collected, desalted by GPC, and freeze-dried. The solid was reconstituted in water and purified a second time by SAX-HPLC. Only the top 30% of the chromatographic peak was collected, desalted, and freeze-dried. Concentration of the oligosaccharide solutions was determined by measuring the absorbance at 232 nm (ε = 3800 M−1cm−1). The resulting fractions containing individual DS oligosaccharides, structures 1, 2, 3, and 4, were characterized by PAGE, ESI-MS, and high-field nuclear magnetic resonance (NMR) spectroscopy.
Mass Spectrometry Analysis
Experiments were performed with a 9.4 T Bruker Apex IV QeFTMS (Billerica, MA) fitted with an Apollo II dual source, a 25 W CO2 laser (Synrad model J48-2, Mukilteo, WA) for infrared multiphoton dissociation (IRMPD), and an indirectly heated hollow cathode for generating electrons for ECD and EDD. Solutions of each oligosaccharide were introduced at a concentration of 0.1 – 0.2 mg/mL in 50:50:0.1 methanol:H2O:NH3 (Sigma, St. Louis, MO) and ionized by nanospray using a pulled fused silica tip (model# FS360-75-15-D-20, New Objective, Woburn, MA). The sample solutions were infused at a rate of 10 μL/hour. All DS oligosaccharides, 1 – 4, were examined in negative ion mode.
For the EDD experiments, precursor ions were isolated in the external quadrupole and accumulated for 1–2 seconds before injection into the FTMS cell. The isolation/cell fill was repeated up to 6 times. The selection of the precursor ion was further refined by using in-cell isolation with a coherent harmonic excitation frequency (CHEF) event [37]. The precursor ions were then irradiated with electrons for 1 second. For electron irradiation the cathode bias was set to −19 V, the extraction lens was set to −17.5 V±0.5 V, and the cathode heater was set to 1.6 A. 24 acquisitions were signal averaged per mass spectrum. For each mass spectrum, 512K points were acquired, padded with one zero fill, and apodized using a sinebell window. Background spectra were acquired by leaving all parameters the same but setting the cathode bias to 0 V to ensure that no electrons reached the analyzer cell. IRMPD spectra were acquired using the same experimental setup as EDD, but replacing the electron irradiation event with a laser pulse. For IRMPD, ions were irradiated for 0.01 – 0.2 seconds beam attenuation set to pass from 40 – 60% of full power. External calibration of IRMPD and EDD mass spectra produced mass accuracy of 5 ppm. Internal calibration was also performed using confidently assigned glycosidic bond cleavage products as internal calibrants, providing mass accuracy of <1 ppm. Due to the larger number of low intensity products formed by EDD, only peaks with S/N > 10 are reported (see supplemental data). Product ions were assigned using accurate mass measurement. All EDD products are reported using the Domon and Costello nomenclature [38].
18 O Labeling
18O labeling of the anomeric carbon of the reducing end was performed by dissolving 2 nmol of the DS oligosaccharide into 10 μL of H218O (Cambridge Isotope Labs, Andover, MA). The solution was heated overnight at 60°C. Prior to mass spectrometry analysis, 10 μL of methanol was added to the H218O oligosaccharide solution before infusion into the mass spectrometer [39].
RESULTS AND DISCUSSION
EDD of DS Tetrasaccharide (dp4)
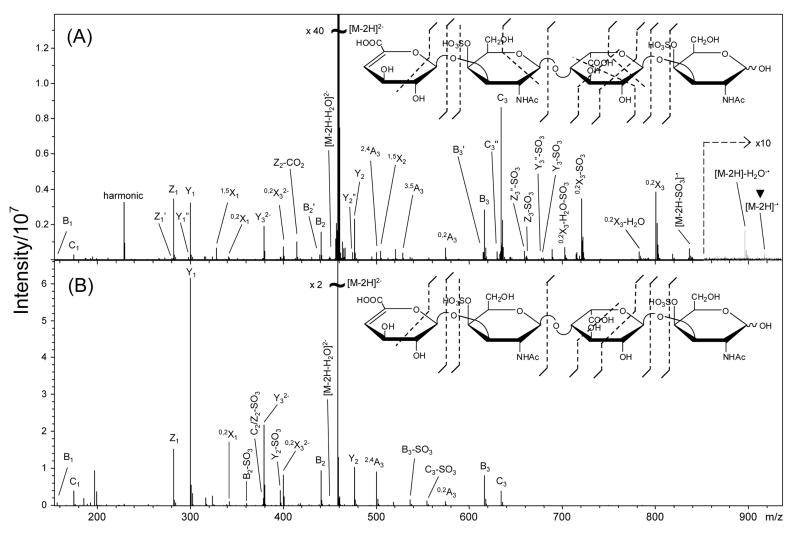
EDD of the [M-2H]2− of DS dp4, 1, by irradiation with 19 eV electrons produces the mass spectrum shown in Figure 1A, while IRMPD of the [M-2H]2− ion of 1 produces the mass spectrum shown in Figure 1B. EDD of 1 produces similar glycosidic bond cleavages to those observed in the IRMPD spectrum. However, more abundant cross-ring cleavages and less SO3 loss are observed in EDD of 1 (insets, Figures 1A and 1B) compared to those produced by IRMPD. As observed with HS tetrasaccharides, the majority of cross-ring fragmentation resulting from EDD occurs in the residue bearing a carboxyl group, IdoA. As suggested previously, carboxylate readily undergoes electron detachment [28], and it seems reasonable that this group will become a radical site that will direct fragmentation to that residue.
Figure 1.
MS/MS of [M-2H]2− precursor ion DS dp4, 1, with (A) EDD and (B) IRMPD. Insets; product ions observed by the fragmentation methods. The charge reduced species in the EDD mass spectrum is indicated with a ▼ over the peak label.
The EDD mass spectrum of 1 contains predominantly singly-charged product ions and three doubly-charged product ions, Y32−, 0,2X32−, and [M-2H-H2O]2−. As described previously [28], the doubly-charged products show that some of the observed product ions result from activation of the precursor ion without electron detachment. These doubly-charged product ions result from fragmentation near the NRE of 1 and are also observed in the IRMPD mass spectrum of 1, Figure 1B. For this tetrasaccharide, cleavage of all glycosidic bonds is observed both by IRMPD and by EDD, except for the Z3 glycosidic bond cleavage, which is observed only with loss of SO3, forming singly-charged, even-electron product ions Z3-SO3 and Z3″-SO3 in the EDD mass spectrum of 1. The C2 and Z2 glycosidic bond cleavages, if present, cannot be assigned as they overlap in mass-to-charge with the precursor ion. Cross-ring cleavages are observed both by EDD and IRMPD. However, IRMPD appears to produce fewer cross-ring fragments, and to favor the formation of A-type cross-ring fragments over X-type cross-ring fragments. The EDD mass spectrum shows considerably more cross-ring fragmentation, and X-ions are far more abundant than A-ions. It is important to note that all of the cross-ring fragments found by IRMPD also appear in the EDD spectrum.
Numerous odd-electron product ions are observed in the EDD mass spectrum of 1. The charge reduced species [M-2H]−• is observed at m/z 916.125, albeit at low intensity, as well as the odd-electron product [M-2H-SO3] −•. Since sulfuric acid is more ionized than a carboxylic acid in solution, and since ESI is thought to preserve the ionized state of species as they move from solution to the gas phase, the doubly-charged anion of 1 is expected to carry each of its charges at a sulfate group. As the radical site formation is proposed to initially occur at a site of charge, EDD is expected to form a sulfate radical, which can readily undergo loss of SO3, consistent with the observation of the [M-2H-SO3]−• ion. However, the preponderance of cleavage on the ring with the carboxyl groups, IdoA, suggests the presence of a radical site on the uronic acid residue, even though it bears no sulfate. These data suggest radical site migration to the carboxyl group, most likely by hydrogen atom rearrangement. Alternatively, it is possible that the carboxyl group is a site of ionization in the doubly-charged precursor ion of 1, perhaps the result of proton migration. Detachment of an electron from a carboxylate anion is thermodynamically favorable, as it requires ~1 eV less energy than detachment of an electron from a sulfate anion, as noted previously [28]. Another explanation for the abundance of IdoA fragmentation is that EDD produces a hole in a molecular orbital, and that the hole migrates until it recombines with an electron in IdoA [24].
Another odd-electron ion of interest is the peak at m/z 898.116, which differs from the charge-reduced species, [M-2H]−•, by the exact mass of H2O, and which is assigned as [M-2H-H2O] −•. This product is unusual as H2O loss from the charge-reduced species has not been observed previously in the EDD mass spectra of GAGs [28,29]. It is unlikely that this is a secondary product ion resulting from the detachment of an electron from the [M-2H-H2O]2− product ion, given the low abundance of the [M-2H-H2O]2− product ion and the low efficiency of EDD fragmentation.
The peak at m/z 800.111, assigned as the odd-electron product 0,2X3, is unusual in that it is observed as both a singly-charged odd-electron product ion (m/z 800.111−•) and a doubly-charged even-electron product ion (m/z 400.0552−). The 0,2X3 product ion is isobaric with the 2,5A4 product ion, and to distinguish these we have performed 18O-labeling of the hydroxyl group at the anomeric position of the reducing end (RE). EDD of the 18O-labeled 1 (data not shown) caused both the singly- and doubly-charged ions to shift +2 amu, confirming that the products contain the reducing end of the GAG chain, consistent with the assignment of these as 0,2X3 ions. The peak at m/z 720.153 differs from the odd-electron 0,2X3 product by the exact mass of SO3, and is assigned as the odd-electron product 0,2X3-SO3−•.
The 18O-labeling of the reducing end of 1 allowed us to confirm the assignments of all the product ions. Those assigned as A, B, or C ions were found to undergo no mass shift upon labeling, while those assigned as X, Y, or Z all undergo a +2 amu shift. One exception is the peak at m/z 782.100 which differs from the 0,2X3 fragment by the exact mass of H2O. 18O labeling was used to determine if this product was in fact the result of water loss from the 0,2X3 cleavage. The peak at m/z 782.100 did not shift +2 amu, indicating that this product either does not contain the reducing end (i.e. may not be an X-type ion), or that the resulting H2O loss removed the 18O from the reducing end. Also, the product at m/z 702.143 differs from the peak at m/z 782.100 by the exact mass of SO3, suggesting a composition of [0,2X3-H2O-SO3] −•. The peak at m/z 702.143 also did not shift +2 amu with 18O-labeling, suggesting that either this product does not contain the reducing end, or that H2O loss removed the 18O from the reducing end, resulting in a [0,2X3-H218O-SO3] −• product ion. We are unable to assign these two product ions to any NRE fragmentation (i.e. A-type cleavage) or any internal fragment ion.
In our prior work on HS tetrasaccharides, all products that result from IRMPD or CAD of sulfated GAGs are observed in the EDD mass spectrum. This is generally true for DS GAGs as well. The only product ions observed in IRMPD that are not observed in EDD are a small number that result from SO3 loss accompanying other fragmentation. In fact, very little SO3 loss is observed in the EDD mass spectrum of 1. Aside from the [M-2H-SO3] −• species, only one significant peak is observed to result from SO3 loss, namely 0,2X3-SO3, which has the same abundance as the 0,2X3 ion. A few low abundance product ions are found to result from SO3 loss (Z3-SO3, Y3-SO3, and their -2H counterparts), and no products are observed with loss of two SO3 molecules. The only product ion observed solely with SO3 loss is the [Z3-SO3] − product. Compared to IRMPD of 1, far less SO3 loss is observed by EDD fragmentation (Figure 1).
EDD of 1 results in numerous glycosidic bond cleavages that are accompanied by the loss of 1 or 2 H atoms (Figure 1). These satellite peaks are not observed in the IRMPD mass spectrum of 1, suggesting that they arise from a radical site induced hydrogen rearrangement. Similar to EDD fragmentation previously observed in HS tetrasaccharides [28,29], the B3 glycosidic bond cleavage is accompanied by a B3-H product (labeled B3′), and the C3 glycosidic bond cleavage is accompanied by a C3-2H product (labeled C3″).
Previous studies of the EDD of HS tetrasaccharides found the formation of the 0,2A3 product occurred only for cross-ring cleavage of GlcA and not IdoA, and only by EDD, and not by IRMPD or CAD [29]. The preference for the formation of 0,2A3 from GlcA versus IdoA was proposed to result from a radical mechanism involving an H atom rearrangement. Unlike HS tetrasaccharides, IRMPD of the DS tetrasaccharide 1 produces the 0,2A3 product ion. The mechanism of its formation is clearly different from EDD of HS tetrasaccharides as the 0,2A3 ion for 1 is produced from an even-electron ion. Furthermore, the ring undergoing fragmentation is IdoA, which does not produce 0,2A3 in EDD or IRMPD of HS. Given its formation from an even-electron precursor, the 0,2A3 fragment in the EDD spectrum is not expected to distinguish GlcA from IdoA in DS oligosaccharides.
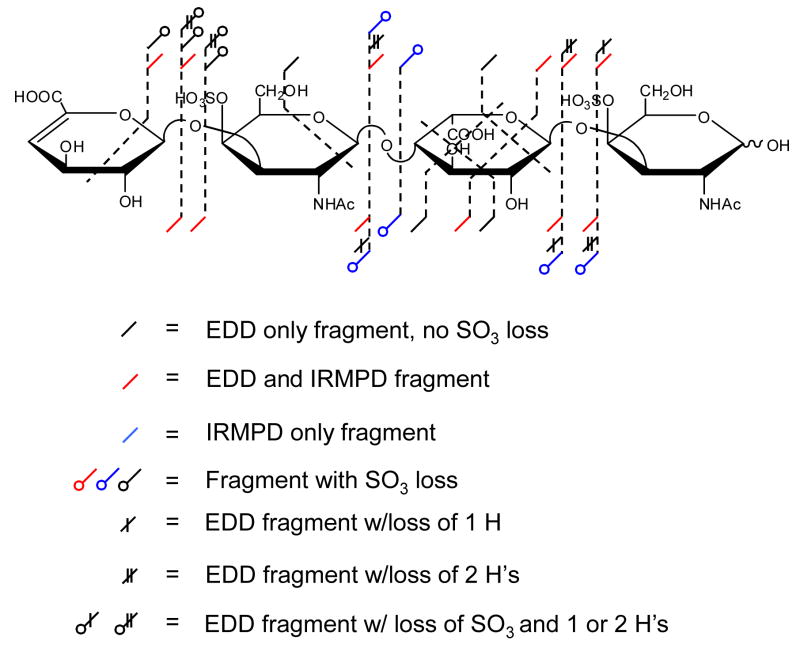
In order to present a complete picture of the observed fragmentation, we propose an annotation scheme that can distinguish hydrogen transfer and SO3 loss in addition to the standard A, B, C, X, Y, and Z fragmentations. The EDD and IRMPD products for 1 (insets, Figures 1A and 1B) are combined in this new fragmentation annotation scheme, shown in Figure 2. This scheme distinguishes products observed by IRMPD from those formed by EDD and can display additional hydrogen and SO3 loss. This scheme is particularly useful for examining the large number of fragment ions that are found in the mass spectra of longer oligosaccharides, as shown below.
Figure 2.
A new fragmentation annotation scheme for showing the products of EDD and IRMPD, applied to the [M-2H]2− precursor ion of 1.
EDD of DS dp6, dp8, and dp10
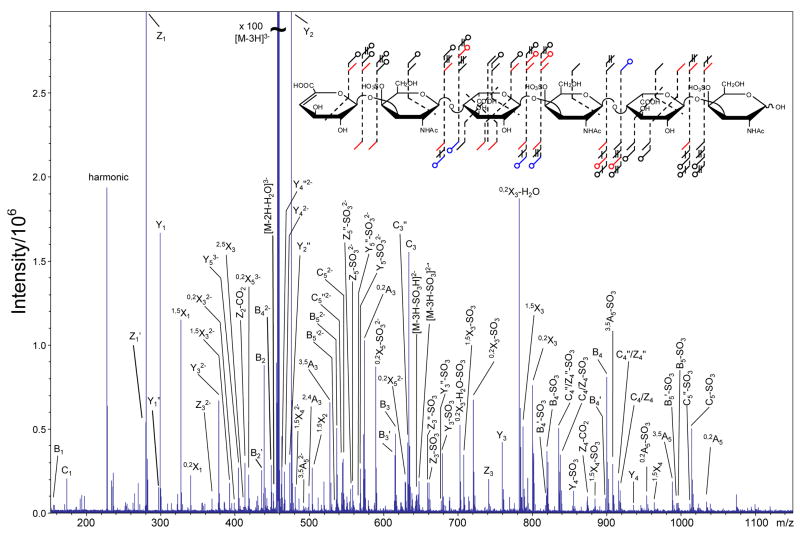
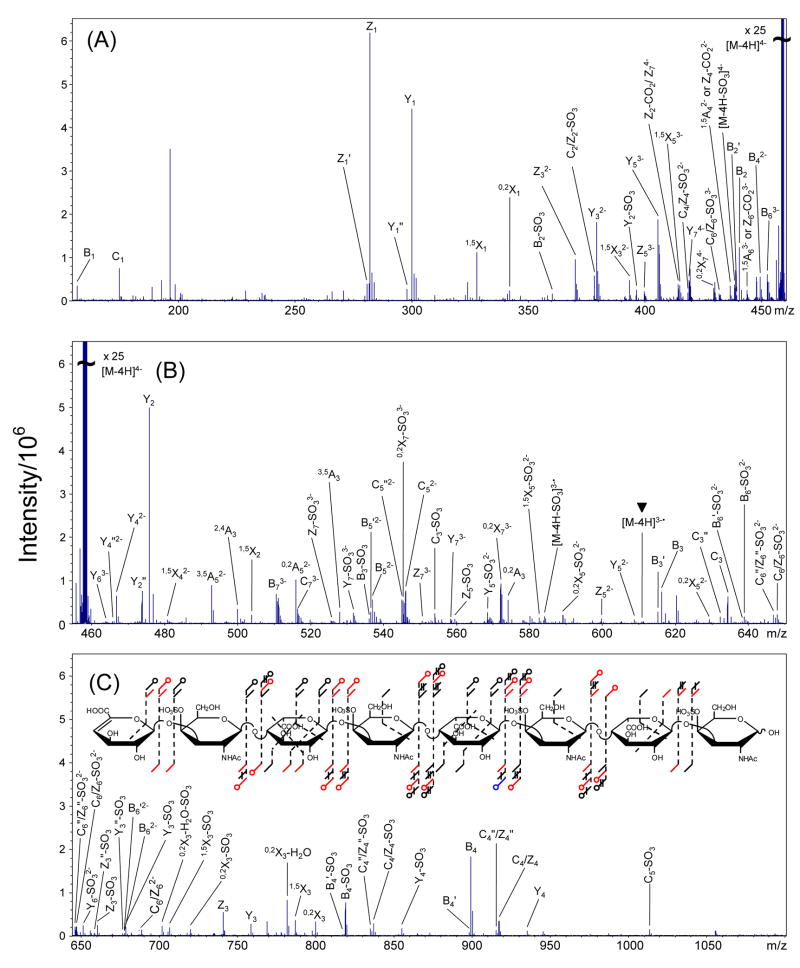
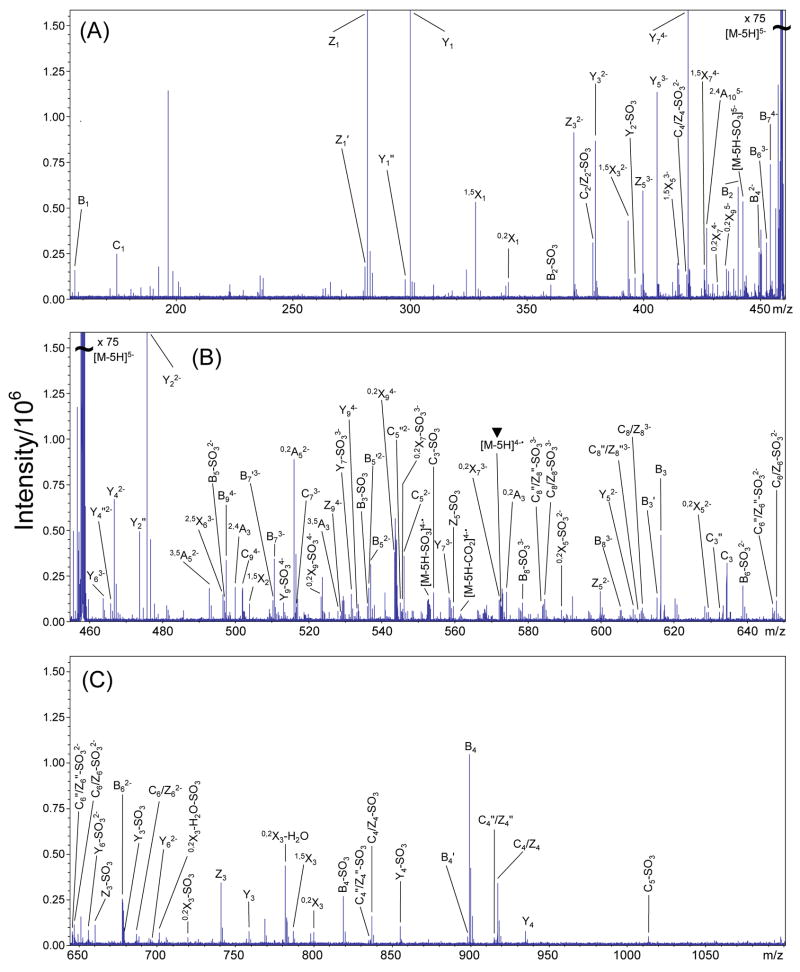
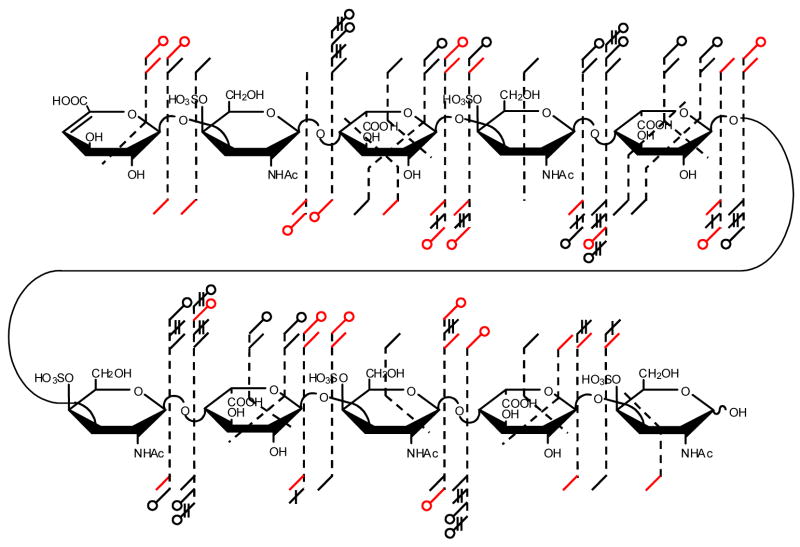
EDD of the [M-3H]3− of DS dp6, 2, produces the mass spectrum shown in Figure 3. The products observed in the IRMPD mass spectrum of the [M-3H]3− precursor ion of 2 (peak list and intensities in supplemental data) are compared to the observed EDD products in the annotated structure shown in Figure 2, inset. EDD of the [M-4H]4− precursor ion of DS dp8, 3, and the [M-5H]5− precursor ion of DS dp4, 4, produces the mass spectra shown in Figures 4 and 5, respectively. Due to the complexity of the EDD mass spectra of 3 and 4, the mass scale is divided into three different m/z ranges. Products observed in the IRMPD of [M-4H]4− precursor ion of 3 (peak list and intensities in supplemental data) are compared to the observed EDD products of 3 in the annotated structure shown in the inset of Figure 4C, inset, while the structure in the inset of Figure 5C compares products of IRMPD (peak list and intensities in supplemental data) and EDD for the [M-5H]5− precursor ion of 4.
Figure 3.
EDD mass spectrum of the [M-3H]3− precursor ion of DS dp6, 2. Inset: Observed product ions from the EDD and IRMPD MS/MS data of 2 combined and annotated using the scheme presented in Figure 2.
Figure 4.
EDD mass spectrum of the [M-4H]4− precursor ion of DS dp8, 3. The mass scale was divided into three regions for clarity. (A) m/z 155–460, (B) m/z 455–650, and (C) m/z 645–1100. Inset: observed product ions from the EDD and IRMPD MS/MS data of 3 combined and annotated using the scheme presented in Figure 2. The charge reduced species is indicated with a ▼ over the peak label.
Figure 5.
EDD mass spectrum of the [M-5H]5− precursor ion of DS dp10, 4. The mass scale was divided into three different regions for clarity. (A) m/z 155–460, (B) m/z 455–650, and (C) m/z 645–1100. The charge reduced species is indicated with a ▼ over the peak label.
Although the charge reduced species [M-3H]2−• is not observed in the EDD spectrum of 2, the charge reduced species minus SO3, [M-3H-SO3]2−• is observed. For EDD of 3 and 4, both the charge reduced species (labeled with a ▼ over the peak) and the charge reduced species minus SO3 are observed. EDD produces more extensive fragmentation than IRMPD for 2, 3, and 4, as can be seen in the annotated structures shown as insets to Figures 3 and 4, and in Figure 6 (DS dp10), respectively. For 2 and 3, the small number of products that are observed only in the IRMPD mass spectra but are not observed by EDD are those that result from SO3 loss. For 4, all products observed in the IRMPD spectrum are observed in the EDD spectrum.
Figure 6.
Observed product ions from the EDD and IRMPD MS/MS data of DS dp10, 4, combined and annotated using the scheme presented in Figure 2.
EDD of 2, 3, and 4 produces abundant cleavage of glycosidic bonds. In contrast to IRMPD of these compounds, EDD cleaves all glycosidic bonds (Figures 3 and 4 insets, and Figure 6). Because of the symmetry of the oligosaccharides presented in this work, the even numbered Cn and Zn glycosidic bond cleavages are isobaric (e.g. C2/Z2, C4/Z4, etc.), and cannot be distinguished. We are presently attempting to label the NRE or RE saccharide to allow the assignment of these ambiguous peaks. For all the DS oligosaccharides presented in this work, the isobaric C2 and Z2 singly-charged products are not assigned as they overlap with the precursor ion. However, for 2, the C2/Z2 glycosidic bond cleavages are observed as the even-electron product C2/Z2-SO3 only in the IRMPD spectrum. The even-electron product C2/Z2-SO3 is observed in both the EDD and IRMPD mass spectra for 3 and 4.
Some glycosidic bond cleavage products from IRMPD of 2, 3, and 4 are observed only with SO3 loss. While SO3 loss accompanying glycosidic bond cleavage is observed in EDD of 2, 3, and 4, these glycosidic bond cleavages are also observed without SO3 loss, facilitating the easy assignment of these peaks. However, the Z5 glycosidic bond cleavage is observed in the EDD mass spectrum of 2 only as the doubly-charged even-electron Z5-SO3 and Z5″-SO3 product ions, similar to the Z3 fragmentation pattern for 1. For 3 and 4, Zm−1 (m = degree of polymerization) is observed in addition to Zm−1-SO3.
Hydrogen Rearrangement Accompanying Glycosidic Bond Cleavages
EDD of 1, 2, 3, and 4 (Figures 2–5, respectively) produces several glycosidic bond cleavages that are accompanied by the loss of 1 or 2 H atoms. The annotation for these cleavages are represented with one or two hatch marks bisecting the fragment label on the molecule (see Figure 2 for annotation scheme), and we refer to these products as Bn′ and Zn′ indicating the loss of one additional hydrogen atom, and Cn″, Z n″, and Y n″ indicating the loss of an additional two hydrogen atoms. Brüll et al. have reported glycosidic bond cleavages with loss of 2 hydrogen atoms from CAD of native and permethylated oligosaccharides [40]. They found that only C-type glycosidic cleavages undergo the loss of two hydrogen atoms, and the normal glycosidic bond cleavage products were not observed in the CAD spectrum.
For the EDD work here, conventional glycosidic bond cleavage products are always present when any glycosidic bond cleavage is observed with additional hydrogen atom loss. Unlike products previously observed from EDD of HS tetrasaccharides [28,29], glycosidic bond cleavages with additional hydrogen loss are less intense than the accompanying glycosidic bond cleavage. These hydrogen atom loss satellite peaks are not observed in the IRMPD mass spectra of the DS oligosaccharides, suggesting that these products arise through a radical fragmentation mechanism. In the case of the loss of one additional hydrogen atom, the product ion is odd-electron (Bn′ and Zn′), strongly suggesting that the precursor ion was odd-electron. The other unusual glycosidic products are even-electron (Cn″, Zn″, and Yn″).
A number of the features of hydrogen atom loss are evident from the EDD mass spectra of all four compounds. The Z1 and Y1 are always accompanied by Z1′ and Y1″. Aside from Z1′, the Bn cleavages are the only glycosidic cleavages observed with loss of a single hydrogen atom, Bn′, that is, B-type glycosidic cleavages are not observed with loss of two hydrogen atoms. Also, Y1, Y2, and Y4 are the only Y glycosidic cleavages observed with loss of 2 hydrogen atoms, Y1″, Y2″, and Y4″, respectively.
Cross-Ring Cleavages
Cross-ring fragmentation from EDD of 2–4 occurs primarily within the IdoA residues rather than the GalNAc4S residues, similar to EDD of 1, and both A- and X-type cleavages are observed. Typically, only A-type cross-ring cleavages are observed in the CAD or IRMPD mass spectra of oligosaccharide even-electron ions. For example, predominately A-type cross-ring cleavages are observed in IRMPD of 2–4 (insets, Figures 3, 4, and 5). In contrast, EDD of 2, 3, and 4 produces abundant A- and X-type cross-ring cleavages.
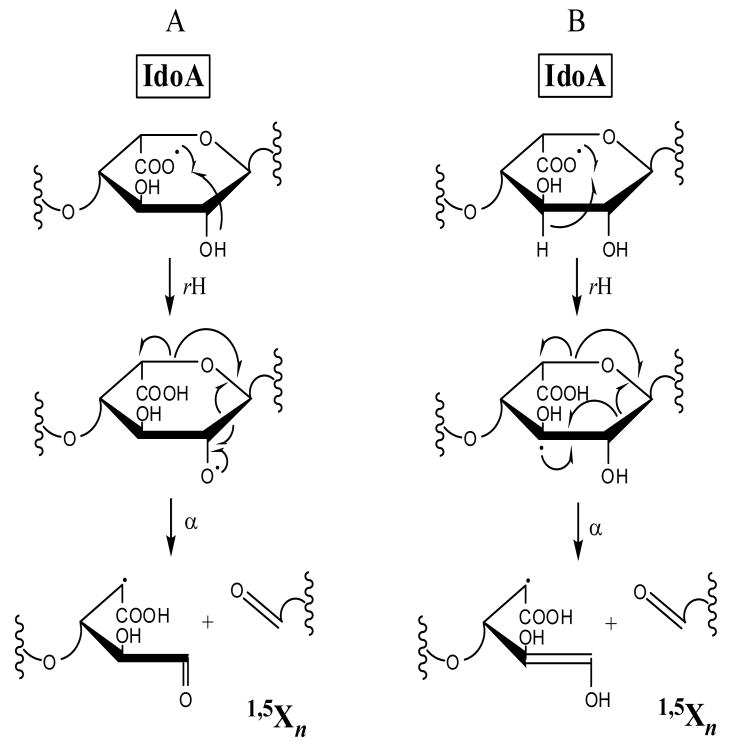
0,2Xn and 1,5Xn (n = odd #) cleavages of IdoA residues are found in the EDD mass spectra, but are not observed in IRMPD of 2–4, suggesting fragmentation through a radical mechanism. Only 0,2X1 is observed in both the EDD and IRMPD mass spectra for 1–4, all other X-products are found only by EDD. Except for the IdoA saccharide next to the RE, these product ions are also observed with SO3 loss. The preference for IdoA to undergo 1,5Xn cleavage can be explained by the fragmentation mechanisms proposed in Schemes 1A and 1B. A radical site located at the carboxylic acid group on IdoA, formed from either the initial electron detachment or hydrogen rearrangement, may undergo a hydrogen atom rearrangement to create a C2 O• radical (Scheme 1A) or a delocalization-stabilized C3• radical (Scheme 1B). Either of these radical products can fragment to form 1,5Xn from IdoA. These hydrogen rearrangement fragmentation mechanisms have been proposed to explain the products observed from fragmentation of the hexuronic acid residues in GAG tetrasaccharides [28]. 1,5Xn-type fragmentation is not predicted to occur for the ΔUA on the NRE through this proposed mechanism as the double bond restricts the conformational change necessary to bring the carboxyl radical into the proximity of the C2 OH or C3 hydrogen for hydrogen atom transfer.
Scheme 1.
Cross-ring cleavage of the NRE residue of 2, 3, and 4 is similar to that observed in EDD of 1. The 0,2Xm−1 (m = degree of polymerization) cleavage is observed as both an even-electron product with same charge as the precursor ion, and an odd-electron product ion with one less charge than the precursor ion. The odd-electron product is also accompanied by the loss of SO3, forming the odd-electron 0,2Xm−1-SO3 product ion.
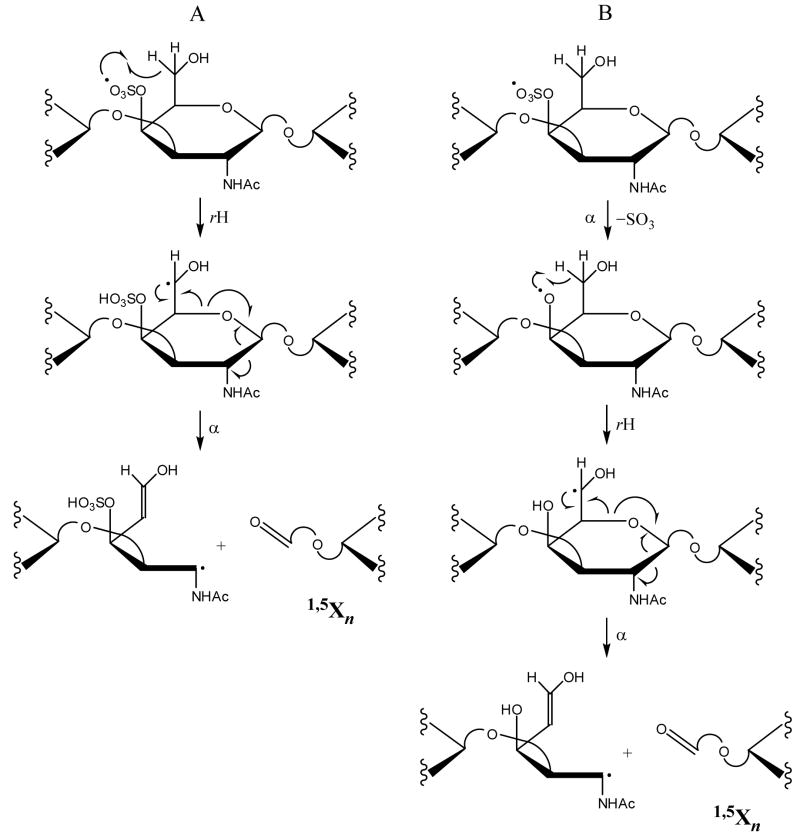
1,5Xn (n = even #) cleavages are also observed for many of the GalNAc4S residues for 1–4, except for the RE GalNAc4S. While 1,5X0 cleavage may occur on the RE, the resulting product ion is outside the m/z detection range. The preference for GalNAc4S to form the 1,5Xn cleavage can be rationalized by the mechanisms proposed in Schemes 2A and 2B. A radical site located at the sulfate group on GalNAc4S undergoes hydrogen atom rearrangement to create a C6• (Scheme 2A), or loses SO3 and then undergoes hydrogen atom rearrangement to create a C6• (Scheme 2B). The C6• species can undergo facile decomposition to form the 1,5Xn product.
Scheme 2.
EDD of 1, 2, and 3 does not produce cross-ring cleavage within the reducing end residue, GalNAc4S. This is in contrast to our previous results obtained with HS tetrasaccharides, for which cross-ring products were observed for the reducing end sugar [28]. For EDD of the HS tetrasaccharides, products from cleavage of the reducing end were typically observed in the IRMPD mass spectra, suggesting formation of these products through a non-radical pathway. As no products from the cleavage of the reducing end are observed in EDD or IRMPD spectra, these data suggest that the reducing end is more stable toward fragmentation for DS oligosaccharides than for HS oligosaccharides, perhaps as a result of the β1-3 linkage as opposed to β1-4 linkage of the amino sugar.
Product Ion SO3 Loss
Sulfate is labile under most CAD or IRMPD conditions and readily undergoes the cleavage of the half-ester bond, resulting in the loss of SO3. The extent of SO3 loss is lower in EDD than in IRMPD of 1 – 4. Generally, EDD product ions that exhibit SO3 loss are accompanied by the related fragments that have retained SO3. Such product ion pairs are easy to identify as they differ by 79.957 u. For 2 and 3, the only products that are exclusive to the IRMPD mass spectra result from SO3 loss (shown in blue in the annotation scheme). All products observed by IRMPD of 4 are observed for EDD of 4. For EDD of 1 and 2, SO3 loss from the precursor ion is not observed. For EDD of 3 and 4, SO3 loss from the precursor ion is observed as [M-4H-SO3]4− and [M-5H-SO3]5−, respectively. The charge reduced species minus SO3 (e.g. [M-3H-SO3]2−• for 2, [M-4H-SO3]3−• for 3) is observed in the EDD spectra of all four DS oligosaccharides studied here.
While several bond cleavages are observed to occur both with and without SO3 loss, no products are observed with loss of two or more equivalents of SO3. For EDD of 2, 3, and 4 (Figures 3, 4, and 5, respectively), the extent of SO3 loss is related to the amount of charge relative to the number of sulfate modifications on the product ion. Our results indicate that if the charge of the product ion is equal to the number of sulfates, no SO3 loss is observed. If the charge of the product ion is less than the number of sulfates, the product ion is typically observed with and without SO3 loss. For example, in EDD of 2 (Figure 3), the singly-charged peak at m/z 899.117 has been assigned as a B4 glycosidic cleavage, and contains two sulfate groups. The singly-charged peak at m/z 819.160 differs from the B4 product by the exact mass of SO3, and has been assigned as B4-SO3. The doubly-charged peak at m/z 440.056 has also been assigned as a B4 product. However, no product ion is present that differs from the doubly-charged B4 product by the exact mass of SO3. The relationship of charge state to SO3 loss has been previously observed by Zaia and coworkers for heparin-like molecules [18]. During CAD, SO3 loss can be minimized and glycosidic cleavages maximized if the number of charges on the GAG precursor is equal to the number of sulfate groups, suggesting that protonated form of sulfate is unstable toward SO3 loss. The exception to this observation can be found in the EDD mass spectrum of 2, in which the [Z5-SO3]2− product has no corresponding Z5 fragment. Also, for EDD of 3 and 4, the singly-charged B3 and C3 products, which contain one sulfate, and are accompanied by peaks corresponding to B3-SO3 and C3-SO3. These products with SO3 loss are also observed in the IRMPD spectra of these compounds, and are therefore expected in the EDD spectra.
CONCLUSIONS
EDD of GAG oligosaccharides produces glycosidic and cross-ring cleavages at more sites than are observed by IRMPD, presumably as a result of the radical-site induced fragmentation processes that can occur by EDD but not by IRMPD. EDD produces predominately even-electron product ions; although some odd-electron product ions are also observed. EDD products have lower intensity compared to IRMPD products in part because fragmentation is divided among a much large number of mass channels. The large number of glycosidic cleavages permits the determination of the degree of sulfation for each residue, while cross-ring fragmentation can locate the site of sulfation within each residue. Cross-ring cleavages occur predominately on IdoA saccharides. 1,5Xn cleavages are observed for most residues except the NRE and RE, and are observed for all IdoA residues. The preference for cross-ring fragmentation of the IdoA residue suggests a radical site on the IdoA residue, either formed initially by EDD, or by hydrogen atom transfer. Also, the stability of the GalNAc4S, evidenced by the small number of observed cross-ring products of GalNAc4S residues may result from the linkage location at C3 instead of C4. EDD produces far fewer product ions observed only with SO3 loss compared to IRMPD. For longer oligosaccharides, many EDD products are observed with SO3 loss. Where SO3 loss does occur, fragment pairs separated by the exact mass of SO3 generally occur, facilitating the assignment of these peaks. Overall, the large degree of fragmentation from EDD permits the analysis of sulfated GAG oligosaccharides through a single MS/MS experiment.
Supplementary Material
Structures.
Acknowledgments
We gratefully acknowledge financial support from the National Institutes of Health grant #2R01-GM038060-16.
Footnotes
Publisher's Disclaimer: This is a PDF file of an unedited manuscript that has been accepted for publication. As a service to our customers we are providing this early version of the manuscript. The manuscript will undergo copyediting, typesetting, and review of the resulting proof before it is published in its final citable form. Please note that during the production process errors may be discovered which could affect the content, and all legal disclaimers that apply to the journal pertain.
References
- 1.Perrimon N, Bernfield M. Cellular functions of proteoglycans--an overview. Semin Cell Dev Biol. 2001;12:65–67. doi: 10.1006/scdb.2000.0237. [DOI] [PubMed] [Google Scholar]
- 2.Fannon M, Forsten KE, Nugent MA. Potentiation and Inhibition of bFGF Binding by Heparin: A Model for Regulation of Cellular Response. Biochemistry. 2000;39:1434–1445. doi: 10.1021/bi991895z. [DOI] [PubMed] [Google Scholar]
- 3.Wu ZL, Zhang L, Yabe T, Kuberan B, Beeler DL, Love A, Rosenberg RD. The Involvement of Heparan Sulfate (HS) in FGF1/HS/FGFR1 Signaling Complex. J Biol Chem. 2003;278:17121–17129. doi: 10.1074/jbc.M212590200. [DOI] [PubMed] [Google Scholar]
- 4.Sadir R, Imberty A, Baleux F, Lortat-Jacob H. Heparan Sulfate/Heparin Oligosaccharides Protect Stromal Cell-derived Factor-1 (SDF-1)/CXCL12 against Proteolysis Induced by CD26/Dipeptidyl Peptidase IV. J Biol Chem. 2004;279:43854–43860. doi: 10.1074/jbc.M405392200. [DOI] [PubMed] [Google Scholar]
- 5.Iozzo RV, San Antonio JD. Heparan sulfate proteoglycans: heavy hitters in the angiogenesis arena. J Clin Invest. 2001;108:349–355. doi: 10.1172/JCI13738. [DOI] [PMC free article] [PubMed] [Google Scholar]
- 6.Gotte M. Syndecans in Inflammation. The FASEB Journal. 2003;17:575–591. doi: 10.1096/fj.02-0739rev. [DOI] [PubMed] [Google Scholar]
- 7.Batinic D, Robey FA. The V3 region of the envelope glycoprotein of human immunodeficiency virus type 1 binds sulfated polysaccharides and CD4-derived synthetic peptides. J Biol Chem. 1992;267:6664–6671. [PubMed] [Google Scholar]
- 8.Chen Y, Maguire T, Hileman RE, Fromm JR, Esko JD, Linhardt RJ, Marks RM. Dengue virus infectivity depends on envelope protein binding to target cell heparan sulfate. Nature Med. 1997;3:866–871. doi: 10.1038/nm0897-866. [DOI] [PubMed] [Google Scholar]
- 9.Williams RK, Straus SE. Specificity and affinity of binding of herpes simplex virus type 2 glycoprotein B to glycosaminoglycans. J Virol. 1997;71:1375–1380. doi: 10.1128/jvi.71.2.1375-1380.1997. [DOI] [PMC free article] [PubMed] [Google Scholar]
- 10.Liu DF, Shriver Z, Gi YW, Venkataraman G, Sasisekharan R. Dynamic regulation of tumor growth and metastasis by heparan sulfate glycosaminoglycans. Seminars in Thrombosis and Hemostasis. 2002;28:67–78. doi: 10.1055/s-2002-20565. [DOI] [PubMed] [Google Scholar]
- 11.Chi LL, Amster J, Linhardt RJ. Mass spectrometry for the analysis of highly charged sulfated carbohydrates. Current Analytical Chemistry. 2005;1:223–240. doi: 10.2174/157341105774573929. [DOI] [PMC free article] [PubMed] [Google Scholar]
- 12.Horne A, Gettins P. H-1-Nmr Spectral Assignments for 2 Series of Heparin-Derived Oligosaccharides. Carbohydr Res. 1992;225:43–57. doi: 10.1016/0008-6215(92)80038-3. [DOI] [PubMed] [Google Scholar]
- 13.Takagaki K, Kojima K, Majima M, Nakamura T, Kato I, Endo M. Ion-Spray Mass-Spectrometric Analysis of Glycosaminoglycan Oligosaccharides. Glycoconjugate J. 1992;9:174–179. doi: 10.1007/BF00731162. [DOI] [PubMed] [Google Scholar]
- 14.Juhasz P, Biemann K. Utility of non-covalent complexes in the matrix-assisted laser desorption ionization mass spectrometry of heparin-derived oligosaccharides. Carbohydr Res. 1995;270:131–147. doi: 10.1016/0008-6215(94)00012-5. [DOI] [PubMed] [Google Scholar]
- 15.Dai Y, Whittal RM, Bridges CA, Isogai Y, Hindsgaul O, Li L. Matrix-assisted laser desorption ionization mass spectrometry for the analysis of monosulfated oligosaccharides. Carbohydr Res. 1997;304:1–9. doi: 10.1016/s0008-6215(97)00195-x. [DOI] [PubMed] [Google Scholar]
- 16.Lo-Guidice JM, Herz H, Lamblin G, Plancke Y, Roussel P, Lhermitte M. Structures of sulfated oligosaccharides isolated from the respiratory mucins of a non-secretor (O, Lea+b-) patient suffering from chronic bronchitis. Glycoconjugate J. 1997;14:113–125. doi: 10.1023/a:1018525318185. [DOI] [PubMed] [Google Scholar]
- 17.Schiller J, Arnhold J, Benard S, Reichl S, Arnold K. Cartilage degradation by hyaluronate lyase and chondroitin ABC lyase: a MALDI-TOF mass spectrometric study. Carbohydr Res. 1999;318:116–122. doi: 10.1016/s0008-6215(99)00063-4. [DOI] [PubMed] [Google Scholar]
- 18.Zaia J, Costello CE. Tandem Mass Spectrometry of Sulfated Heparin-Like Glycosaminoglycan Oligosaccharides. Anal Chem. 2003;75:2445–2455. doi: 10.1021/ac0263418. [DOI] [PubMed] [Google Scholar]
- 19.Saad OM, Leary JA. Compositional Analysis and Quantification of Heparin and Heparan Sulfate by Electrospray Ionization Ion Trap Mass Spectrometry. Anal Chem. 2003;75:2985–2995. doi: 10.1021/ac0340455. [DOI] [PubMed] [Google Scholar]
- 20.Saad OM, Leary JA. Heparin Sequencing Using Enzymatic Digestion and ESI-MS with HOST: A Heparin/HS Oligosaccharide Sequencing Tool. Anal Chem. 2005;77:5902–5911. doi: 10.1021/ac050793d. [DOI] [PubMed] [Google Scholar]
- 21.Sweeney MD, Yu Y, Leary JA. Effects of Sulfate Position on Heparin Octasaccharide Binding to CCL2 Examined by Tandem Mass Spectrometry. J Am Soc Mass Spectrom. 2006;17:1114–1119. doi: 10.1016/j.jasms.2006.04.025. [DOI] [PubMed] [Google Scholar]
- 22.Zaia J, Li XQ, Chan SY, Costello CE. Tandem mass spectrometric strategies for determination of sulfation positions and uronic acid epimerization in chondroitin sulfate oligosaccharides. J Am Soc Mass Spectrom. 2003;14:1270–1281. doi: 10.1016/S1044-0305(03)00541-5. [DOI] [PubMed] [Google Scholar]
- 23.Anusiewicz I, Jasionowski M, Skurski P, Simons J. Backbone and side-chain cleavages in electron detachment dissociation (EDD) J Phys Chem A. 2005;109:11332. doi: 10.1021/jp055018g. [DOI] [PubMed] [Google Scholar]
- 24.Budnik BA, Haselmann KF, Zubarev RA. Electron detachment dissociation of peptide di-anions: an electron-hole recombination phenomenon. Chem Phys Lett. 2001;342:299–302. [Google Scholar]
- 25.Cooper HJ, Hakansson K, Marshall AG. The role of electron capture dissociation in biomolecular analysis. Mass Spectrom Rev. 2005;24:201. doi: 10.1002/mas.20014. [DOI] [PubMed] [Google Scholar]
- 26.Kjeldsen F, Silivra OA, Ivonin IA, Haselmann KF, Gorshkov M, Zubarev RA. Cα-C Backbone Fragmentation Dominates in Electron Detachment Dissociation of Gas-Phase Polypeptide Polyanions. Chem Eur J. 2005;11:1803–1812. doi: 10.1002/chem.200400806. [DOI] [PubMed] [Google Scholar]
- 27.McFarland MA, Marshall AG, Hendrickson CL, Nilsson CL, Fredman P, Mansson JE. Structural characterization of the GM1 ganglioside by infrared multiphoton dissociation/electron capture dissociation, and electron detachment dissociation electrospray ionization FT-ICR MS/MS. J Am Soc Mass Spectrom. 2005;16:752. doi: 10.1016/j.jasms.2005.02.001. [DOI] [PubMed] [Google Scholar]
- 28.Wolff JJ, Chi L, Linhardt RJ, Amster IJ. Electron Detachment Dissociation of Glycosaminoglycan Tetrasaccharides. J Am Soc Mass Spectrom. 2006 doi: 10.1016/j.jasms.2006.09.020. Submitted. [DOI] [PMC free article] [PubMed] [Google Scholar]
- 29.Wolff JJ, Chi LL, Linhardt RJ, Amster IJ. Distinguishing glucuronic from iduronic acid in glycosaminoglycan tetrasaccharides by using electron detachment dissociation. Anal Chem. 2007;79:2015–2022. doi: 10.1021/ac061636x. [DOI] [PMC free article] [PubMed] [Google Scholar]
- 30.Lortat-Jacob H, Turnbull JE, Grimaud JA. Molecular-Organization of the Interferon Gamma-Binding Domain in Heparan-Sulfate. Biochem J. 1995;310:497–505. doi: 10.1042/bj3100497. [DOI] [PMC free article] [PubMed] [Google Scholar]
- 31.Spillmann D, Witt D, Lindahl U. Defining the interleukin-8-binding domain of heparan sulfate. J Biol Chem. 1998;273:15487–15493. doi: 10.1074/jbc.273.25.15487. [DOI] [PubMed] [Google Scholar]
- 32.Stringer SE, Gallagher JT. Specific binding of the chemokine platelet factor 4 to heparan sulfate. J Biol Chem. 1997;272:20508–20514. doi: 10.1074/jbc.272.33.20508. [DOI] [PubMed] [Google Scholar]
- 33.Tollefsen DM, Sugimori T, Maimone MM. Effect of Low-Molecular-Weight Heparin Preparations on the Inhibition of Thrombin by Heparin Cofactor-Ii. Seminars in Thrombosis and Hemostasis. 1990;16:66–70. [PubMed] [Google Scholar]
- 34.Maccarana M, Casu B, Lindahl U. Minimal Sequence in Heparin Heparan-Sulfate Required for Binding of Basic Fibroblast Growth-Factor. J Biol Chem. 1993;268:23898–23905. [PubMed] [Google Scholar]
- 35.Barzu T, Lormeau JC, Petitou M, Michelson S, Choay J. Heparin-Derived Oligosaccharides - Affinity for Acidic Fibroblast Growth-Factor and Effect on Its Growth-Promoting Activity for Human-Endothelial Cells. J Cell Physiol. 1989;140:538–548. doi: 10.1002/jcp.1041400320. [DOI] [PubMed] [Google Scholar]
- 36.Pervin A, Gallo C, Jandik KA, Han XJ, Linhardt RJ. Preparation and structural characterization of large heparin-derived oligosaccharides. Glycobiology. 1995;5:83–95. doi: 10.1093/glycob/5.1.83. [DOI] [PubMed] [Google Scholar]
- 37.Heck AJR, de Koning LJ, Pinkse FA, Nibbering NMM. Mass-specific selection of ions in Fourier-transform ion cyclotron resonance mass spectrometry. Unintentional off-resonance cyclotron excitation of selected ions. Rapid Commun Mass Spectrom. 1991;5:406–414. [Google Scholar]
- 38.Domon B, Costello CE. A systematic nomenclature for carbohydrate fragmentations in FAB-MS/MS spectra of glycoconjugates. Glycoconjugate J. 1988;5:397–409. [Google Scholar]
- 39.Saad OM, Leary JA. Delineating mechanisms of dissociation for isomeric heparin disaccharides using isotope labeling and ion trap tandem mass spectrometry. J Am Soc Mass Spectrom. 2004;15:1274–1286. doi: 10.1016/j.jasms.2004.05.008. [DOI] [PubMed] [Google Scholar]
- 40.Brüll LP, Kovácik V, Thomas-Oates JE, Heerma W, Haverkamp J. Sodium-cationized oligosaccharides do not appear to undergo “internal residue loss” rearrangement processes on tandem mass spectrometry. Rapid Commun Mass Spectrom. 1998;12:1520–1532. doi: 10.1002/(SICI)1097-0231(19981030)12:20<1520::AID-RCM336>3.0.CO;2-W. [DOI] [PubMed] [Google Scholar]
Associated Data
This section collects any data citations, data availability statements, or supplementary materials included in this article.


