

Abstract
A computational model of the tibiofemoral joint utilizing the discrete element analysis method has been developed and validated with human cadaveric knees. The computational method can predict load distributions to within a Root Mean Square Error (RMSE) of 3.6%. The model incorporates subject-specific joint geometry and the health of the subjects’ articular cartilage to determine the cartilage stiffness. It also includes the collateral and cruciate ligaments and utilizes stiffness values derived from literature for these elements. Comparisons of the total load, peak load, and peak load location for axial, varus, and valgus loading conditions confirmed that there was less than 4% RMSE between the analytical and experimental results. The model presented in this paper can generate results with minimal computational time and it can be used as a non-invasive method for characterizing and monitoring subject-specific knee loading patterns.
Keywords: DEA, mathematical model, knee, contact force, tibial plateau force
INTRODUCTION
Age, body weight, previous injury, and altered joint loading are key factors for the development of knee OA (Sowers, 2001), (Maquet, 1976). Biomechanical studies have shown that varus malalignment leads to increased medial plateau cartilage pressure, which can damage the cartilage and progress to OA (Mina et al., 2008). Computational models can be used to characterize cartilage loading conditions, which is important for developing optimum therapeutic interventions.
Various models of the tibiofemoral joint have been developed using either the finite element method (FEM) (Schreppers, et al., 1990), (Bendjaballah, et al., 1995), (Perie and Hobatho, 1998), (Li, et al., 1999), (Haut Donahue, et al., 2002) or discrete element analysis (DEA) (Hsu et al., 1990) to predict pressure distribution in articulating joints. Since changes in knee alignment redistribute the joint’s stress (Hsu et al., 1990), it is desirable to study the medial-lateral load distribution across the tibial plateau. DEA can be implemented more quickly than FEM while still effectively and reliably predicting joint load distribution (Li, et al., 1997), making it potentially useful for conducting preoperative planning and making clinical treatment decisions (Chao, et al., 2008).
The purpose of this study was to develop and validate a subject-specific two-dimensional analytical knee model using the DEA approach that incorporates subject-specific geometry, joint health, and loading patterns to predict medial-lateral tibiofemoral load distributions.
METHODS
Model
The tibiofemoral joint was modeled as two rigid bodies with spring elements representing the articular cartilage and the collateral and cruciate ligaments. The model minimizes the strain energy in these elements (An, et al., 1990), assuming that the ligaments and cartilage have linear deformations with the cartilage loaded in compression and the ligaments in tension.
Coronal radiographs were used to find subject-specific geometry and OA grade. A Canny edge detection algorithm (Mathworks, Natick, MA) identified tibial and femoral geometry. The collateral ligaments originated at the respective femoral condyles and inserted three centimeters distal to the joint line. The cruciate ligaments originated at the femoral epicondyles and crossed to insert at the adjacent midpoint of the tibial plateau. The femoral condyle geometry was modeled with circles using a linear least squares method and 44 cartilage springs originated at even intervals along the curves. A vector perpendicular to the femoral curve at each spring extended toward the tibia. The tibial point closest to this vector was the spring’s insertion point. A linear regression of patellar cartilage stiffness data (Kiviranta, et al., 1995) was used to generate the following equations to predict stiffness (kn, N/mm2) for different OA grades (g):
where ko is the stiffness of normal cartilage (Grade 0 OA) and kd is the decrease in cartilage stiffness due to OA (Kiviranta, et al., 1995). The compressive (E) and shear modulus (G) values for the OA cartilage were calculated as a percentage of the normal compressive modulus (Eo) (Shepherd and Seedhom, 1999), (Barker and Seedhom, 2001) and shear modulus (Go) (Hayes and Mockros, 1971) using kd.
For Grade 0 OA the compressive and shear modulus were 10 and 4.1 N/mm2, respectively; while for Grade 1 the compressive and shear modulus were 8.47 and 2.92 N/mm2, respectively. The collateral and cruciate ligaments were modeled as individual springs with a stiffness of 80 and 200 N/mm, respectively (Momersteeg, et al., 1995). The reference strain (ε) was 0.01 for the collateral ligaments (Shelburne and Pandy, 1997) and 0.03 for the cruciate ligaments (Shelburne and Pandy, 1997), (Kucuk, 2006). The following equation used the ligament spring length (l) to determine the ligament reference length (lo):
Experimental Validation
The model was validated experimentally with four fresh-frozen human cadaveric knees (age 65±22). Two knees had Grade 0 OA for both plateaus. One knee had Grade 0 and 1 for the lateral and medial plateaus, respectively, and one knee had Grade 1 for both plateaus.
Pressure at the tibial plateau was recorded using a calibrated thin, flexible sensor (K-scan Model 4000, 9,000 psi; Tekscan Inc., South Boston, MA). The sensor consisted of two separate measurement areas (2.8 × 3.3 cm, 62 sensels/ cm2). The number of cartilage springs directly corresponds to the number of sensor columns. The sensors were calibrated with our lab’s method by applying known loads using a flat platen covered in rubber attached to a load cell (Model N100, NK Biotechnical Engineering Co., Minneapolis, MN). The pressure data was then summed in the anterior-posterior direction for each sensor column to give a two-dimensional representation of the results.
The experimental validation simulated single leg stance (Figure 1). Axial loads were applied, along the knee’s mechanical axis to rigid compressive loads (Table 1) at 1 mm/sec. For varus and valgus loading, the tibia was translated medially and laterally, respectively, in the horizontal plane and the specimens were subjected to compressive loads (Table 1). The specimen’s joint laxity determined the horizontal offset. The analytical and experimentally measured forces were compared by calculating the RMSE normalized to the applied load for both the lateral and medial plateaus.
Figure 1.
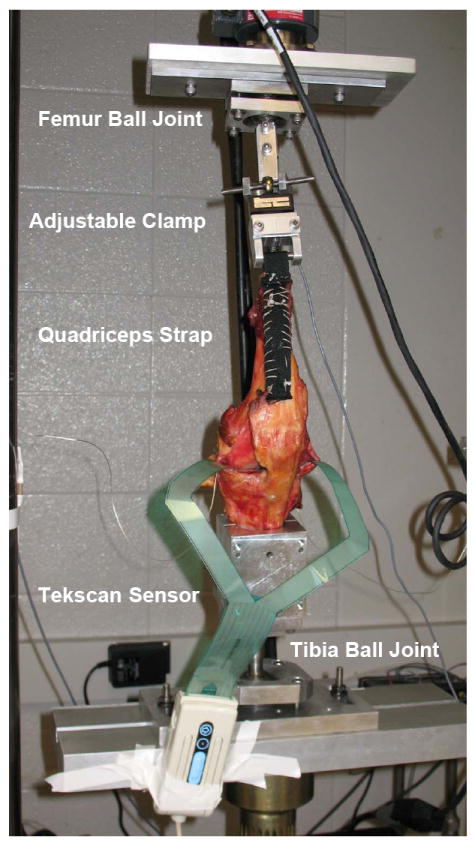
Experimental test set-up for axial loading condition. Knees were mounted on an MTS machine with Tekscan pressure sensors inserted into the medial and lateral plateaus of the knee joint distal to the meniscus. The soft tissue was removed to expose the quadriceps tendon, the joint space, and the collateral ligaments. A nylon strap was sutured to the quadriceps tendon, a steel rod was fixed in the femur and the tibia was potted in a cylindrical bone cement mold. Each specimen was attached to a testing fixture on a material testing machine (Model 312, MTS Systems Corp., Eden Prairie, MN). The tibia and femur were mounted on ball joints to allow natural 6 DOF loading patterns.
Table 1.
Averaged results of % medial load, peak spring load, and peak spring load location for the analytical and experimental results for all specimens; location is percent of total plateau length from medial to lateral.
| Axial Load (N) | Varus Load (N) | Valgus Load (N) | |||||||
|---|---|---|---|---|---|---|---|---|---|
| 692 ± 4 | 972 ± 125 | 1477 ± 2 | 467 ± 6 | 908 ± 12 | 461 ± 5 | 919 ± 0.3 | |||
| MEDIAL PLATEAU | % Load | Analytical | 53 ± 0 | 51 ± 2 | 49 ± 0 | 85 ± 12 | 84 ± 13 | 26 ± 0 | 21 ± 11 |
| Experimental | 55 ± 0 | 66 ± 13 | 49 ± 0 | 88 ± 9 | 84 ± 5 | 34 ± 0 | 51 ± 5 | ||
| Peak Force (N) | Analytical | 24 ± 0.1 | 46 ± 20 | 131 ± 0 | 35 ± 17 | 55 ± 11 | 11 ± 1 | 18 ± 3 | |
| Experimental | 28 ± 0 | 55 ± 9 | 87 ± 1 | 37 ± 21 | 51 ± 4 | 17 ± 0.5 | 52 ± 30 | ||
| Peak Location (%) | Analytical | 45 ± 0 | 55 ± 5 | 55 ± 0 | 50 ± 9 | 51 ± 9 | 27 ± 0 | 53 ± 17 | |
| Experimental | 45 ± 0 | 41 ± 14 | 55 ± 0 | 48 ± 28 | 42 ± 9 | 27 ± 0 | 56 ± 22 | ||
| LATERAL PLATEAU | Peak Force (N) | Analytical | 27 ± 0.1 | 48 ± 19 | 106 ± 0 | 10 ± 9 | 16 ± 15 | 25 ± 0.3 | 79 ± 39 |
| Experimental | 19 ± 0.1 | 40 ± 31 | 92 ± 2 | 6 ± 3 | 10 ± 2 | 22 ± 0.3 | 37 ± 12 | ||
| Peak Location (%) | Analytical | 50 ± 0 | 44 ± 12 | 63 ± 0 | 48 ± 11 | 45 ± 17 | 50 ± 0 | 55 ± 8 | |
| Experimental | 41 ± 0 | 38 ± 22 | 27 ± 0 | 65 ± 24 | 50 ± 19 | 42 ± 3 | 45 ± 8 | ||
RESULTS
For all loading conditions, the load distribution is consistent between the analytical and experimental results, but there are differences in the peak values (Figure 2). For the axial loading condition, the analytical results consistently predicted a fifty percent load on the medial plateau, while the experimental results varied more (Table 1). In the varus loading condition, there was close agreement between the analytical and the experimental results. In the valgus loading condition, the analytical results underestimated the percent medial load. For the peak medial and lateral plateau forces, there was less than 4% RMSE between the analytical and the experimental results for most of the loading conditions and the applied loads (Table 2). However, for some applied loads, the analytical results overestimated the peak plateau force such as for large axial loads. For the locations of the peak medial plateau force, differences between analytical and experimental values were less than 10% except for the 972N axial load. For the lateral location of peak force, 2 out of 7 loading conditions had differences above 10%.
Figure 2.
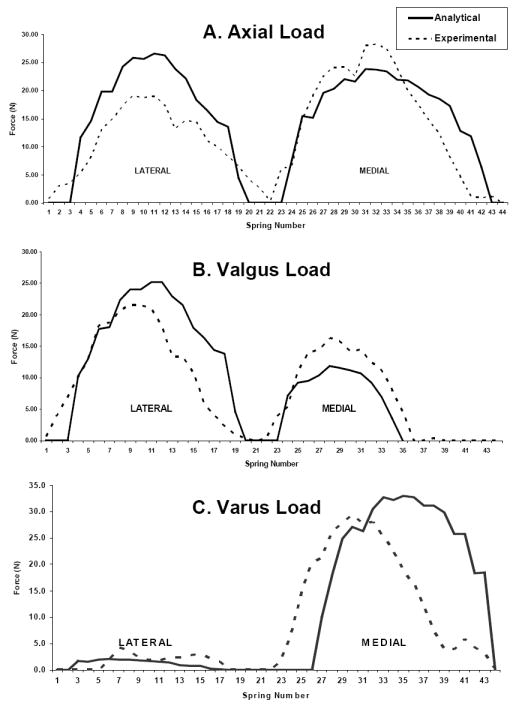
Experimental and analytical tibial plateau force distribution for (A) a 690 N axial load (B) a 462 N valgus load (C) a 462 N varus load. Each plot represents one trial for one of the four specimens tested.
Table 2.
Percent normalized RMSE for the medial and lateral plateaus for axial, valgus, and varus loading conditions; Total Force and Peak Force values were normalized to the applied load.
| Medial Plateau RMSE | Lateral Plateau RMSE | |||||
|---|---|---|---|---|---|---|
| Loading Condition | Total Force | Peak Force | Peak Force Location | Total Force | Peak Force | Peak Force Location |
| Axial | 2.1 ± 0.9 | 1.6 ± 1.1 | 2.3 ± 3.2 | 1.8 ± 1.0 | 1.3 ± 0.8 | 1.7 ± 1.3 |
| Varus | 3.4 ± 2.7 | 1.2 ± 0.6 | 3.6 ± 2.9 | 1.2 ± 0.8 | 1.7 ± 1.2 | 2.6 ± 3.4 |
| Valgus | 2.3 ± 1.8 | 3.2 ± 3.3 | 0.1 ± 0.4 | 2.1 ± 1.7 | 3.2 ± 3.0 | 1.7 ± 1.4 |
DISCUSSION
A computational model of the tibiofemoral joint has been developed and validated for predicting computational load distributions to within an RMSE of 3.6%. For the varus and valgus loading conditions, the knee was placed in an offset position and this may have affected the results, giving rise to larger errors, especially for valgus loading.
While the FEM approach is able to provide information regarding stress within the cartilage and the meniscus (Haut Donahue, et al., 2004), and some models incorporate subject-specific information (Papaioannou, et al., 2008), the FEM approach is currently not practical for quickly creating and generating subject-specific output (Li, et al., 1997). The model presented in this paper can be used as a non-invasive method for characterizing and monitoring subject-specific knee loading patterns. Knowledge of load distributions under these conditions can be beneficial for diagnosing knee symptoms, assessing clinical outcomes, or providing preoperative planning data. Specifically, this model could be used to assess how joint loading changes with knee malalignment. This information could be used to assess if patients might be at risk for developing OA and it could be beneficial for understanding knee OA etiology.
There were limitations and assumptions associated with this study. The Tekscan sensor was used due to its ability to collect real-time continuous data and be reused. However, calibration challenges (Baer, et al., 2005), (Brimacombe, et al., 2005) and measurement errors on the order of 1-4% for contact force and peak pressure (Fregley and Sawyer, 2003) have been reported. Additionally, while it has been shown that the menisci greatly affect joint contact stress distribution (Haut Donahue, et al., 2004) and the menisci were included in the experimental validation, the analytical results showed less than 4% RMSE without the inclusion of the menisci directly. Since it has been shown that the current 2D model quickly and accurately calculates joint contact forces, a more time consuming 3D model may not be necessary. The collateral ligaments increase in stiffness secondary to knee OA (Fishkin, et al., 2002), but this data was not characterized by OA grade so these effects were not incorporated into the model. While the bones were assumed to be rigid (Haut Donahue, et al., 2002), and the cartilage elements linearly elastic (Li, et al., 1997), (Garcia and al, 1998), (Donzelli, et al., 1999), (Chao, et al., 2008) the model was still validated within 4% RMSE.
In summary, a subject-specific analytical model of the knee utilizing the DEA approach was developed and validated (to within 4% RMSE) to predict loading on the tibial plateaus. This model incorporates subject-specific joint geometry, the health of the subjects’ articular cartilage, and collateral and cruciate ligaments. Since this model can generate results in minutes with minimal computation time, the results of this study demonstrate that this knee model can be used to analyze tibiofemoral load distributions for clinical applications to monitor patients or quickly assess potential clinical outcomes.
Acknowledgments
This study was funded by NIH grant #R01 AR048768.
Footnotes
Conflict of Interest Statement The authors have no conflict of interest regarding any of the material in the manuscript and meet the criteria for authorship as defined in your submission guidelines.
Publisher's Disclaimer: This is a PDF file of an unedited manuscript that has been accepted for publication. As a service to our customers we are providing this early version of the manuscript. The manuscript will undergo copyediting, typesetting, and review of the resulting proof before it is published in its final citable form. Please note that during the production process errors may be discovered which could affect the content, and all legal disclaimers that apply to the journal pertain.
References
- 1.An K, Himeno S, Tsumura H, Kawai T, Chao Y. Pressure distribution on articular surfaces: application to joint stability evaluation. Journal of Biomechanics. 1990;23:1013–1020. doi: 10.1016/0021-9290(90)90316-u. [DOI] [PubMed] [Google Scholar]
- 2.Baer T, Pederson D, Rudert M, Kallemeyn N, Grosland N, Brown T. Calibration and monitoring of piezoresistive contact stress sensor arrays using traveling pressure wave protocol. Proceedings of the 20th International Society of Biomechanics; Cleveland, OH. 2005. [Google Scholar]
- 3.Barker MK, Seedhom BB. The relationship of the compressive modulus of articular cartilage with its deformation response to cyclic loading: does cartilage optimize its modulus so as to minimize the strains arising in it due to the prevalent loading regime? Rheumatology (Oxford) 2001;40:274–284. doi: 10.1093/rheumatology/40.3.274. [DOI] [PubMed] [Google Scholar]
- 4.Bendjaballah MZ, Shirazi-Adl A, Zukor DJ. Biomechanics of the human knee joint in compression: reconstruction, mesh generation and finite element analysis. The Knee. 1995;2:69–79. [Google Scholar]
- 5.Brimacombe J, Anglin C, Hodgson A, Wilson D. Validation of calibration techniques for Tekscan pressure sensors. Proceedings of the 20th International Society of Biomechanics; Cleveland, OH. 2005. [Google Scholar]
- 6.Chao E, Vologh K, Yoshida H, Shiba N, Ide T. Discrete element analysis in musculoskeletal biomechanics. Molecular & Cellular Biomechanics. 2008;118:1–17. [PubMed] [Google Scholar]
- 7.Donzelli P, Spilker R, Ateshian G, Mow V. Contact analysis of biphasic transversely isotropic cartilage layers and correlations with tissue failure. Journal of Biomechanics. 1999;32:1037–1047. doi: 10.1016/s0021-9290(99)00106-2. [DOI] [PubMed] [Google Scholar]
- 8.Fishkin Z, Miller D, Ritter C, Ziv I. Changes in human knee ligament stiffness secondary to osteoarthritis. J Orthop Res. 2002;20:204–207. doi: 10.1016/S0736-0266(01)00087-0. [DOI] [PubMed] [Google Scholar]
- 9.Fregley B, Sawyer W. Estimation of discretization errors in contact pressure measurements. Journal of Biomechanics. 2003:609–613. doi: 10.1016/s0021-9290(02)00436-0. [DOI] [PubMed] [Google Scholar]
- 10.Garcia J, et al. An approach for the stress analysis of transversely isotropic biphasic cartilage under impact load. Journal of Biomedical Engineering. 1998;120:608–613. doi: 10.1115/1.2834751. [DOI] [PubMed] [Google Scholar]
- 11.Haut Donahue TL, Hull ML, Rashid MM, Jacobs CR. A finite element model of the human knee joint for the study of tibio-femoral contact. Journal of Biomechanical Engineering. 2002;124:273–280. doi: 10.1115/1.1470171. [DOI] [PubMed] [Google Scholar]
- 12.Haut Donahue TL, Hull ML, Rashid MM, Jacobs CR. The sensitivity of tibiofemoral contact pressure to the size and shape of the lateral and medial menisci. J Orthop Res. 2004;22:807–814. doi: 10.1016/j.orthres.2003.12.010. [DOI] [PubMed] [Google Scholar]
- 13.Hayes W, Mockros L. Viscoelastic properties of human articular cartilage. Journal Applied Physiology. 1971;31:562–568. doi: 10.1152/jappl.1971.31.4.562. [DOI] [PubMed] [Google Scholar]
- 14.Hsu RW, Himeno S, Coventry MB, Chao EY. Normal axial alignment of the lower extremity and load-bearing distribution at the knee. Clinical Orthopaedics and Related Research. 1990;255:215–227. [PubMed] [Google Scholar]
- 15.Kiviranta I, Lyyra T, Vaatainen U, Seuri R, Jaroma H, T M, Jurvelin J. Knee join articular cartilage shows general softening in patients with chondromalacia of the patella. Transact Orthop Res Soc. 1995;20:197. [Google Scholar]
- 16.Kucuk H. The effect of modeling cartilage on predicted ligament and contact forces at the knee. Comput Biol Med. 2006;36:363–375. doi: 10.1016/j.compbiomed.2004.10.003. [DOI] [PubMed] [Google Scholar]
- 17.Li G, Gil J, Kanamori A, Woo SL. A validated three-dimensional computational model of a human knee joint. Journal of Biomechanical Engineering. 1999;121:657–662. doi: 10.1115/1.2800871. [DOI] [PubMed] [Google Scholar]
- 18.Li G, Sakamoto M, Chao EYS. A comparison of different methods in predicting static pressure distribution in articulating joints. Journal of Biomechanics. 1997;30:635–638. doi: 10.1016/s0021-9290(97)00009-2. [DOI] [PubMed] [Google Scholar]
- 19.Maquet PGJ. Biomechanics of the knee. Springer-Verlag; Berlin: 1976. [Google Scholar]
- 20.Mina C, Garrett WE, Pietrobon R, Glisson R, Higgins L. High Tibial Osteotomy for Unloading Osteochondral Defects in the Medial Compartment of the Knee. American Journal of Sports Medicine. 2008;36:949–955. doi: 10.1177/0363546508315471. [DOI] [PubMed] [Google Scholar]
- 21.Momersteeg TJ, Blankevoort L, Huiskes R, Kooloos JG, Kauer JM, Hendriks JC. The effect of variable relative insertion orientation of human knee bone-ligament-bone complexes on the tensile stiffness. J Biomech. 1995;28:745–752. doi: 10.1016/0021-9290(94)00121-j. [DOI] [PubMed] [Google Scholar]
- 22.Morrison JB. The mechanics of the knee joint in relation to normal walking. Journal of Biomechanics. 1970;3:51–61. doi: 10.1016/0021-9290(70)90050-3. [DOI] [PubMed] [Google Scholar]
- 23.Papaioannou G, Nianios G, Mitrogiannis C, Fyhrie D, Tashman S, Yang KH. Patient-specific knee joint finite element model validation with high-accuracy kinematics from biplane dynamic Roentgen stereogrammetric analysis. J Biomech. 2008;41:2633–2638. doi: 10.1016/j.jbiomech.2008.06.027. [DOI] [PubMed] [Google Scholar]
- 24.Perie D, Hobatho MC. In vivo determination of contact areas and pressure of the femorotibial joint using non-linear finite element analysis. Clinical Biomechanics. 1998;13:394–402. doi: 10.1016/s0268-0033(98)00091-6. [DOI] [PubMed] [Google Scholar]
- 25.Schreppers GJMA, Sauren AAHJ, Huson A. A numerical model of the load transmission in the tibio-femoral contact area. Journal of Engineering in Medicine. 1990;204:53–59. doi: 10.1243/PIME_PROC_1990_204_228_02. [DOI] [PubMed] [Google Scholar]
- 26.Setton LA, Elliott DM, Mow VC. Altered mechanics of cartilage with osteoarthritis: human osteoarthritis and an experimental model of joint degeneration. Osteoarthritis and Cartilage. 1999;7:2–14. doi: 10.1053/joca.1998.0170. [DOI] [PubMed] [Google Scholar]
- 27.Shelburne KB, Pandy MG. A musculoskeletal model of the knee for evaluating ligament forces during isometric contractions. J Biomechanics. 1997;30:163–176. doi: 10.1016/s0021-9290(96)00119-4. [DOI] [PubMed] [Google Scholar]
- 28.Shepherd D, Seedhom B. The ‘instantaneous’ compressive modulus of human articular cartilage in joints of the lower limb. Rheumatology. 1999;38:124–132. doi: 10.1093/rheumatology/38.2.124. [DOI] [PubMed] [Google Scholar]
- 29.Sowers M. Epidemiology of risk factors for osteoarthritis systemic factors. Current opinion in Rheumatology. 2001;13:447–451. doi: 10.1097/00002281-200109000-00018. [DOI] [PubMed] [Google Scholar]
- 30.Wirz D, Becker R, Li SF, Friederich NF, Muller W. Validation of the Tekscan system for statistic and dynamic pressure measurements of the human femorotibial joint. Biomed Tech (Berl) 2002;47:195–201. doi: 10.1515/bmte.2002.47.7-8.195. [DOI] [PubMed] [Google Scholar]
- 31.Zhang H, Totterman S, Perucchio R, Lerner AL. Magnetic resonance image based 3D poroelastic finite element model of tiobio-menisco-femoral contact. 23rd Proceedings of the Amercian Society of Biomechanics. 1999:198. [Google Scholar]