

Abstract
How does attention optimize our visual system for the task at hand? Two mechanisms have been proposed for how attention improves signal processing: gain and tuning. To distinguish between these two mechanisms we use the equivalent-noise paradigm, which measures performance as a function of external noise. In the present study we explored how spatial and feature-based attention affect performance by assessing their threshold-vs-noise (TvN) curves with regard to the signature behavioral effects of gain and tuning. Furthermore, we link our psychophysical results to neurophysiology by implementing a simple, biologically-plausible model to show that attention affects the gain and tuning of population responses differentially, depending on the type of attention being deployed: Whereas spatial attention operates by boosting the gain of the population response, feature-based attention operates by both boosting the gain and sharpening the tuning of the population response.
Keywords: Spatial attention, Feature-based attention, Gain, Tuning, Global motion, Population response
Spotting a friend in a crowd is much easier if you are cued to two types of information: where to look, and what to look for. Indeed, numerous studies have shown that directing attention to a spatial location or to distinguishing features of a target can enhance its discriminability (e.g. Baldassi & Verghese, 2005; Carrasco, Penpeci-Talgar, & Eckstein, 2000; Lee, Itti, Koch, & Braun, 1999; Ling & Carrasco, 2006b; Lu & Dosher, 2000) and its related neural response (e.g. Ghandi, Heeger, & Boynton, 1999; Liu, Larsson, & Carrasco, 2007; Liu, Pestilli, & Carrasco, 2005; Martinez-Trujillo & Treue, 2002; Martinez-Trujillo & Treue, 2004; Reynolds & Chelazzi, 2004). What neural mechanisms underlie these attentional benefits? It is likely that our percept does not arise from one single neuron, but rather from the activity of a population of neurons (Deneve, Latham, & Pouget, 1999; Jazayeri & Movshon, 2006; Pouget, Dayan, & Zemel, 2000; Pouget, Dayan, & Zemel, 2003). Thus, in the present study we ask what influence attention may have on this population response.
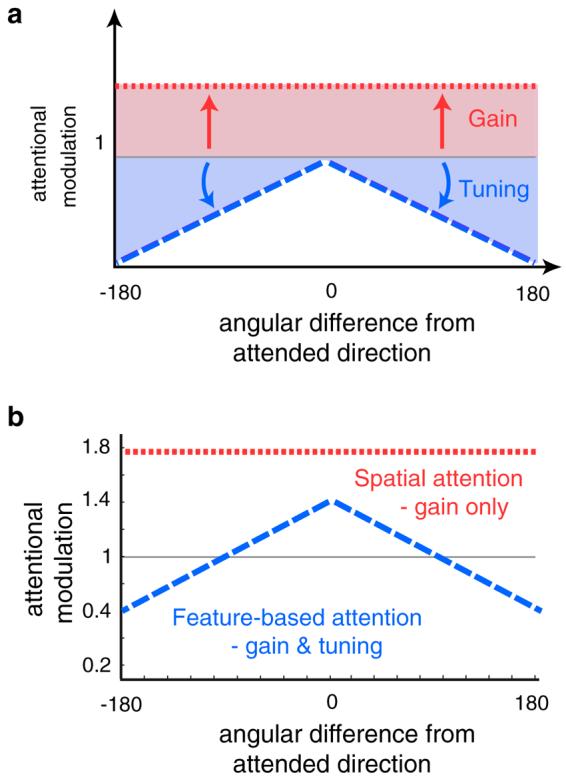
Given that spatial and feature-based attention differ in their nature of deployment (Liu, Stevens, & Carrasco, 2007; Saenz, Buracas, & Boynton, 2002; Treue & Martinez Trujillo, 1999), is it possible that their underlying mechanisms also differ? Two prominent neural mechanisms have been proposed for how attention might affect neural responses: gain and tuning (Martinez-Trujillo & Treue, 2002; Martinez-Trujillo & Treue, 2004; McAdams & Maunsell, 1999; Reynolds & Chelazzi, 2004; Williford & Maunsell, 2007). A gain model predicts that the overall population response to a stimulus is increased by a multiplicative factor across all feature detectors, as if the effective signal strength was “turned up” (Fig. 1a, top panel). A tuning model predicts that attention does not increase the response to attended stimuli, but rather it suppresses the response to irrelevant noise, leading to a narrower population response profile (Fig. 1b, top panel). A third possibility is that attention acts on the population response through a combination of both gain and tuning.
Fig. 1.
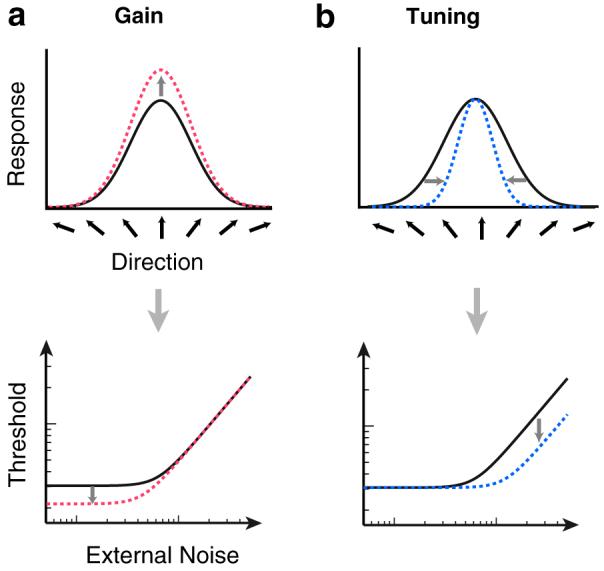
The effect of gain and tuning on neural population responses and equivalent-noise curves. (a) A hypothetical population response to an attended upwards-moving stimulus. Dotted lines correspond to changes with attention. A gain model proposes an overall multiplicative increase in the population response to a stimulus (top panel). This amplified response would only lead to a benefit in discriminability at low levels of external noise (bottom panel). (b) A tuning model proposes a sharpening of the population response around the attended stimulus feature (top panel). This narrowed response would only lead to a benefit in discriminability at high levels of external noise, when there is noise to suppress (bottom panel).
What mechanisms underlie attentional modulation? By using the equivalent-noise paradigm (Dakin, Mareschal, & Bex, 2005; Lu & Dosher, 2000; Pelli & Farell, 1999), we were able to characterize the attentional mechanisms of gain and tuning, and link psychophysical performance with neurophysiological responses via a biologically-plausible model based on population responses. The equivalent-noise paradigm measures sensitivity for a signal embedded in external noise as a function of increasing levels of external noise, i.e., variance in the signal (Pelli, 1985; Pelli & Farell, 1999). This relation between discriminability thresholds and external noise yields threshold versus noise (TvN) functions.
Gain and tuning models make distinct predictions regarding how attention will affect TvN functions. On the one hand, gain causes an overall multiplicative increase in the population response, increasing discriminability only when the external noise is low (Fig. 1a, bottom panel). A gain model proposes that as more external noise is added to the stimulus, the gain of the irrelevant external noise is increased as well. Because the signal-to-noise ratio does not improve with boosted gain, once the external noise outweighs the system's internal noise, this precludes any benefit of a gain modulation with high external noise. Thus, in terms of TvN functions the signature of an attentional gain model is a benefit (decreased threshold) strictly at low noise levels. On the other hand, tuning suppresses the population response to irrelevant external noise, which increases discriminability only when the external noise is high (Fig. 1b, bottom panel). Assuming that we rely on the response across all detectors to make judgments, “tuning out” external noise can only lead to a benefit when there is sufficient external noise present for the system to suppress - thereby precluding a benefit at low noise levels. Thus, in terms of TvN functions the signature of an attentional tuning model is a decreased threshold strictly at high noise levels.
In this study, we explore the mechanisms underlying spatial and feature-based attention. Specifically, we ask whether these two types of attention affect motion processing via gain or tuning. Motion is a fundamental visual dimension mediated by directionally tuned cortical neurons (Britten, Shadlen, Newsome, & Movshon, 1993; Movshon & Newsome, 1996; Rust, Mante, Simoncelli, & Movshon, 2006; Treue & Maunsell, 1996). Neurophysiological investigations of visual motion processing provide critical constraints for modeling the link between behavior and physiology. Here we exploit the behavioral signature effects of attentional gain and tuning on TvN functions in conjunction with a model that allows us to connect behavior to expected modulations in neural population responses.
1. Experiment
We obtained TvN functions when observers voluntarily directed either their spatial attention to the upcoming target location, or their feature-based attention to the upcoming target's global motion direction. Observers performed a 2-alternative forced choice (2AFC) direction-discrimination task for stochastic random-dot cinematograms. External noise was manipulated by changing the variance of the distribution of local motion directions (Dakin et al., 2005; Fig. 2). In the spatial attention experiment a precue appeared near fixation, directing observers to deploy their covert attention to one of the four upcoming stimulus locations. The observer's task was to report whether the global motion was clockwise or counterclockwise relative to upwards (Fig. 3a). In the baseline, neutral condition, the trial sequence was identical, only observers were not precued as to the target location.
Fig. 2.
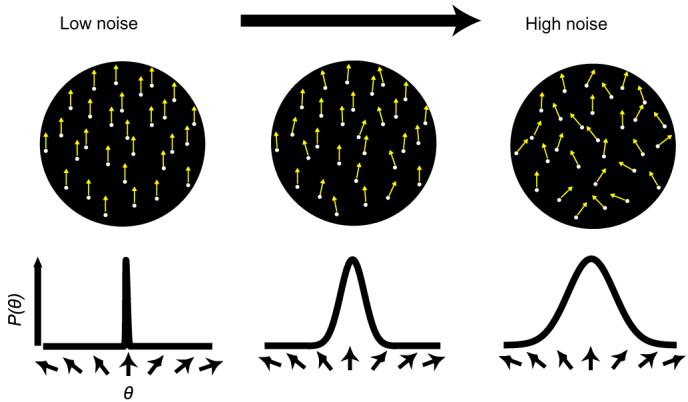
External noise with global motion. The local motion directions of individual dots are drawn from a circular wrapped-Gaussian distribution centered around the global motion direction. External noise is manipulated by varying the standard deviation of the distribution. As external noise increases, motion coherence decreases. Yellow arrows indicate the local motion direction of each dot element.
Fig. 3.

Sequence of events in a single trial. (a) In the spatial attention experiment, observers were shown four moving dot patterns, presented iso-eccentrically. External noise was manipulated by varying the motion coherence of the dot fields (Fig. 2). In the spatial-attention condition a small line at fixation instructed observers to attend to the upcoming target location. In the neutral condition, only a tone was played, with the line appearing simultaneously with the stimuli. Observers performed a 2AFC direction discrimination task for the field of dots at the cued location, reporting its global motion direction. To obtain equivalent-noise functions, we measured direction thresholds for different levels of motion coherence (external noise). (b) In the feature-based attention experiment, observers were shown a moving dot cinematogram at fixation. In the feature-attention condition a small precue at fixation instructed observers to attend to one of four directions prior to the stimuli presentation. In the neutral condition, only a tone was played, and the line cue appeared simultaneously with the stimulus. Observers performed a 2AFC direction discrimination task, reporting whether the global motion was clockwise or counterclockwise relative to the cued direction.
In the feature-based attention experiment the random dot cinematogram appeared at one location (fixation), with global motion moving clockwise or counterclockwise relative to one of four reference directions (Fig. 3b). To manipulate feature-based attention, observers were precued to the reference direction of the upcoming stimulus. The observers performed a 2AFC direction-discrimination task, reporting whether the global motion was clockwise or counterclockwise relative to the cued reference direction. In the neutral condition the trial sequence was identical, only observers were not precued with the reference direction. In both experiments, directional thresholds were measured as the directional offset of global motion needed for the observers to perform at 75% accuracy. Whereas a gain mechanism predicts a benefit of attention strictly at low levels of external noise, a tuning mechanism predicts benefits of attention exclusively at high levels of external noise.
2. Methods
2.1. Observers
Three observers participated in the study, aged 20–33. All were trained observers, and observer AC was naïve as to the purpose of the experiment. All had normal or corrected-to-normal vision.
2.2. Apparatus
The stimuli were created and presented on a G4 Power Macintosh using Matlab and the Psychophysics Toolbox (Brainard, 1997; Pelli, 1997). Eye movements were monitored via an ISCAN infrared camera (ISCAN Inc., Burlington, MA).
2.3. Stimuli & design
A gray circle (0.5° × 0.5°) was presented in the center of a uniform background (21 cd/m2), serving as a fixation point. The fixation point was presented at the center of the screen throughout the entire experiment, and observers were told to maintain fixation.
In the spatial-attention experiment (Fig. 3a), there were two types of precues: attentional and neutral. The attentional precue was a small line appearing adjacent to fixation pointing towards the upcoming target location (100% valid), accompanied by a brief auditory tone. The neutral precue was simply the auditory tone, informing observers of the upcoming stimuli, but not of the impending target location. The stimulus display consisted of four stochastic random dot cinematograms (diameter: 8°), appearing equidistant from fixation centered at 11° eccentricity, which appeared simultaneous with a response cue. The global-motion stimulus was composed of 80 local motion dot elements, with the direction of each local motion element (size: 0.1°, unlimited lifetime, speed: 4 deg/s, luminance: 87 cd/m2) sampled from a circular Gaussian distribution centered on the global motion direction. To manipulate external noise, the standard deviation of this sampling distribution varied (0°, 2°, 4°, 8°, 16°, 32°, 45°, 64°; Fig. 2). The direction of global motion was either clockwise or counter-clockwise relative to upwards. The simultaneous response cue pointed towards the stimulus observers were to perform the direction discrimination.
The feature-based attention experiment was similar (Fig. 3b); there was only one random dot cinematogram (diameter: 8°) presented at the center of the screen, with a 1.6° occluder surrounding the fixation point and cues. The global motion was either clockwise or counter-clockwise relative to four reference directions (45°, 135°, 225°, or 315°). There were two types of precues: attentional and neutral. The attentional precue was a small line appearing within the fixation point, pointing towards the upcoming reference motion direction (100% valid), accompanied by a brief tone. The neutral precue was simply the auditory tone, informing observers of the upcoming stimuli, but not of the impending reference direction. The simultaneous response cue indicated the reference direction for which observers had to base their response on.
The method of constant stimuli was used to obtain directional thresholds; the range of angular directions of global motion was sampled individually for each observer and external noise level. The range was determined for each noise level during practice sessions such that the psychometric functions ranged from chance to asymptote. Weibull functions were fit to the psychometric functions using maximum likelihood estimation, from which the angular direction needed to attain 75% (threshold) was estimated. By obtaining threshold at a fixed level of performance, the difficulty of the task remained fixed from condition to condition. Thus, in principle, attentional effort remained constant across noise levels and conditions.
2.4. Procedure
For both the spatial attention and feature-based attention experiments, each observer participated in two practice blocks of 448 trials, followed by 10 experimental blocks of 448 trials each. Each block lasted approximately 30 min. Within each block, the external-noise level was constant, but the order of the blocked noise conditions was randomized.
Observers viewed the display binocularly at a distance of 57 cm from the monitor, with their heads stabilized by a chinrest. They were asked to fixate on the fixation point throughout the experiment. The timing of events was identical between the spatial and feature-based attention experiment - only the display differed. In each trial, observers were presented with a fixation point for 1.5 s, after which either an attentional or neutral precue appeared (600 ms). Observers were told to either attend to the precued location (spatial attention experiment) or the precued direction (feature-based attention experiment). The precue was followed by the random-dot cinematogram stimuli and response cue display (100 ms). The response cue appeared simultaneously with the stimuli, and in the spatial-attention experiment it informed observers for which of the four stimuli to report the direction of motion. The spatial attention precue always corresponded to this location. In the feature-based attention experiment, the response cue corresponded to the reference direction, informing observers to report the direction of motion with regard to the reference direction. Observers performed a 2AFC direction discrimination task, reporting whether the target stimulus moved clockwise or counter-clockwise in reference to upwards (spatial-attention experiment), or in reference to the response-cued direction (feature-based attention experiment).
The 600 ms interval between the precue and target display was chosen to ensure that both the spatial attention and feature-based attention precues were maximally effective (Liu et al., 2007). To ensure observers maintained fixation, eye movements were monitored using an infrared camera. Breaks from fixation were very rare (<1%), and blocks in which breaks were observed were re-run.
3. Results
3.1. Psychophysics
3.1.1. Main experiments
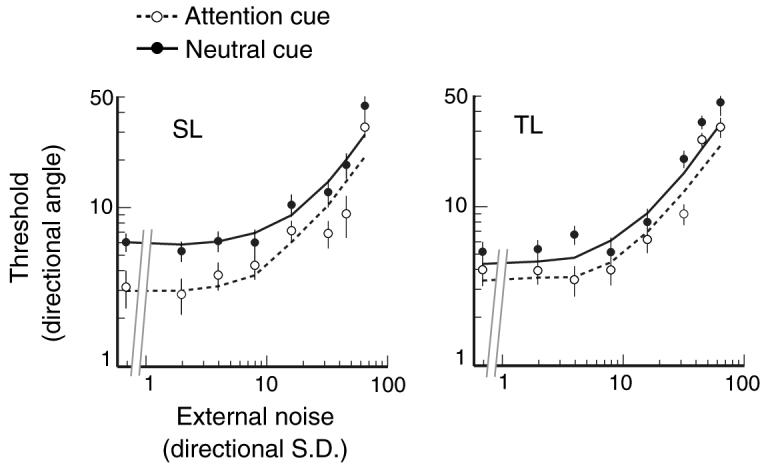
There were clear differences in the patterns of results between spatial attention and feature-based attention. The results for the two types of attention are depicted in the TvN functions (Fig. 4). In the baseline, neutral conditions of both experiments, the functions show what has typically been found with external noise: Thresholds increase as a function of external noise, such that on a log-log scale, thresholds are constant at low levels of external noise until reaching an inflection point, at which thresholds increase with external noise (Dakin et al., 2005; Lu & Dosher, 2000; Pelli & Farell, 1999).
Fig. 4.

Threshold versus noise (TvN) functions under the spatial and feature-based attention conditions. Each panel plots data of an individual observer. (a) Spatial attention reduced thresholds at high motion coherence levels (low external noise), but had no impact on low coherence (high external noise). Fits for spatial attention were best modeled by a boost in gain of population response (dashed line). (b) Feature-based attention reduced thresholds across all motion coherence levels, i.e., for both low and high external noise levels. Fits for feature-based attention were best modeled by a combination of boost in gain, as well as sharpened tuning of the population response (dashed line). Error bars correspond to ±1 bootstrapped s.d.
When the target location was cued, for all three observers there was a consistent reduction of thresholds at low noise levels, with no benefit at high noise levels (Fig. 4a). This result suggests that the behavioral benefits of spatial attention arise from a gain mechanism that intensifies the signal representation.
In contrast, when the target direction was cued, for all observers there was a marked reduction of threshold at both low and high levels of external noise (Fig. 4b). This result suggests that the behavioral benefits of feature-based attention arise from a hybrid of gain and tuning mechanisms, which both intensifies the gain of the attended signal representation, and attenuates the representation of the irrelevant noise.
3.2. Control experiment: Feature-based attention at a peripheral location
The spatial and feature-based attention experiments differed in the location and the number of the motion stimulus, with the former presented in the periphery (4 stimuli), and the latter presented at fovea (1 stimulus). The stimuli were presented at fovea in the feature-based attention experiment so that very little covert spatial attention would be deployed, thus isolating the effects of feature-based attention from those of spatial attention. However, to ensure that the differential effects we found between spatial and feature-based attention were not due to differences in stimulus configuration, but to genuine differences in attentional mechanisms, we conducted a control experiment where feature-based attention was directed to a stimulus presented in the periphery rather than at fovea. The task was identical to the original feature-based experiment, but the stimulus configuration and timing were identical to the spatial attention experiment (4 stimuli at 11° eccentricity). To equate spatial attention between the neutral and feature-based cueing conditions, the location of the target stimulus was fixed to one location throughout the entire experiment (lower-left quadrant). Although spatial attention is likely directed to this eccentric stimulus, this is the case for both the neutral and feature cueing conditions, thereby any difference between these two conditions can be attributed solely to feature-based attention.
In this experiment, when eccentricity for the feature-based attention was equated to that of the spatial-based attention experiment, the qualitative dissociation in TvN signatures remained: feature-based attention still reduced thresholds across all levels of external noise (Fig. 5). A nested hypothesis test (see below for model fitting) revealed that the hybrid model was necessary to best account for the data (p's < .05; F test). These findings further support a model in which feature-based attention acts by both increasing the gain and sharpening the tuning of the population response.
Fig. 5.
Threshold versus noise (TvN) functions under the peripheral, feature-based attention condition. Regardless of stimulus location, feature-based attention reduced thresholds across all motion coherence levels. Fits were best modeled by a combination of boost in gain, as well as sharpened tuning of the population response (dashed line). Error bars correspond to ±1 bootstrapped s.d.
3.3. Model
Can these results be explained by changes in the gain or tuning of cortical population responses? To quantify the relation between our TvN data and attentional mechanisms, we implemented a model that links behavioral performance to expected neural population responses (Fig. 6). Numerous studies implicate visual area MT in the perception of global motion (e.g. Britten et al., 1993; Martinez-Trujillo & Treue, 2004; Movshon & Newsome, 1996; Rust et al., 2006; Treue & Martinez-Trujillo, 1999; Treue & Maunsell, 1996). The percept of global motion does not arise from an individual neuron in MT, but rather from the contributions of many neurons (Deneve et al., 1999; Jazayeri & Movshon, 2006; Pouget et al., 2000; Pouget et al., 2003). We assume that the behavioral thresholds that yield the TvN curves are the result of noisy population responses in area MT, and that performance is primarily governed by two factors: the sensitivity of the detectors, and the number of local motion responses that are spatially integrated (Dakin et al., 2005). In the proposed model, attention can further influence thresholds by changing the gain or tuning of the population response.
Fig. 6.
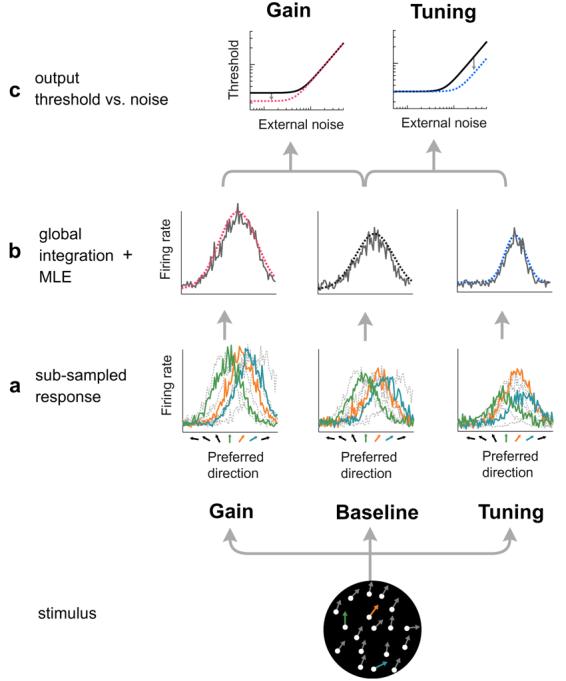
Equivalent-noise model of global motion perception. Consider a collection of neurons in visual area MT, each with direction-tuned selectivity and spatially overlapping receptive fields. (a) When presented with a global-motion stimulus, each local motion element has the potential to evoke a population response from this bank of detectors. However, responses from a sub-sample of local elements are globally integrated to perform the task (sub-sampled responses shown here as solid colored lines) (b). Maximum likelihood estimation (MLE) is used to read out an estimate of global-motion direction from this pooled sub-sample, yielding expected thresholds as a function of external noise that mimics behavioral equivalent-noise functions. (c) Changing the gain and tuning of the population response causes changes in the model output: gain lowers thresholds solely at low external-noise levels, while tuning lowers thresholds primarily at high external-noise levels.
The basic model consists of a bank of direction-selective detectors, with response profiles corresponding to direction-selective neurons in visual area MT (Albright, 1984; Britten & Newsome, 1998; Kohn & Movshon, 2004). With a global motion display, each local motion element (a single dot) of the display has the potential to evoke a population response across detectors (Fig. 6a). These potential responses are assumed to be independent and to have Gaussian profiles, each centered on the local motion direction. The population response at each direction to an individual dot is denoted by
| (1) |
where Rij is the mean magnitude of response elicited at a given direction j by a local motion element i. θi is the direction of local motion element i, and μj is the preferred direction of the jth detector at each location. The amplitude of neuronal response to the stimulus is represented by parameter F (spikes/s), and b represents spontaneous neural activity (which we fix at 10 spikes/s; Shadlen, Britten, Newsome, & Movshon, 1996). Each detector's tuning bandwidth is dictated by σ, which we fix at 90° to approximate the broad bandwidth of MT neurons reported in single-unit recordings (Albright, 1984; Britten & Newsome, 1998; Kohn & Movshon, 2004). Although there is some evidence suggesting that neurons in MT exhibit a weak firing-rate correlation (e.g. Shadlen & Newsome, 1998), we assume these correlations largely contribute to quantitative, rather than qualitative differences in terms of the effect of attention. Thus, for computational brevity, here we model the detector responses as independent. Response variability in area MT is Poisson-distributed, such that at each point the response variance is equal to its mean firing rate (e.g., Britten et al., 1993). To model this stochastic neural response, the response at each direction is randomly sampled from a normal distribution with variance equal to the mean response (Rij). We denote this noisy response as .
To obtain a readout of global direction, the responses for each local motion element are integrated by MT (Fig. 6b). We assume that area MT spatially integrates responses across multiple local motion inputs from earlier cortical areas, such as V1. However, this spatial integration is imperfect, and as information is transmitted downstream, there is a loss of local motion information from earlier cortical areas to MT (Dakin et al., 2005). Assuming that each dot element is represented by a population of local motion detectors prior to area MT, but that MT integrates sensory inputs incompletely, the model represents this loss of information as a subsampling of the total number of integrated local motion elements (hence Eq. (1) only represents the potential contribution of each local motion element to the MT population response). Thus, the model assumes that observers integrate these responses with varying proportions of sampling (Dakin et al., 2005; Simpson, Falkenberg, & Manahilov, 2003), and with varying levels of neuronal sensitivity (F). We define the global integration of local motion responses as
| (2) |
where Rj is the pooled population response to the subsampled global motion display. S represents the number of subsampled responses; it is assumed that observers' global motion response relies on an incompletely pooled sample of local motion responses (Dakin et al., 2005; Simpson et al., 2003), which are integrated and normalized. Given that for Poisson noise, the variance is proportional to the mean response, and that variance is additive, implementing the noise before or after pooling is equivalent.
To obtain a read-out of global motion direction, maximum likelihood estimation (MLE) is used. MLE estimates the stimulus most likely to have produced the observed responses. The MLE for a randomly noise-corrupted response is
| (3) |
where θMLE is the estimate of global-motion direction. This estimate corresponds to direction θ that maximizes the likelihood of N detectors producing the noisy response . In this case, MLE is equivalent to fitting the log response with a Gaussian template (Eq. (1)), with its mean, variance and amplitude free to vary. This returns a single estimate for the global motion direction of the stimulus, which corresponds to the peak of the fitted template (Dakin et al., 2005; Deneve et al., 1999; Pouget et al., 2000).
A plausible model for human performance in a direction-discrimination task involves a comparison of the global-direction estimate (θMLE) with a reference direction. In our model, estimates of global motion direction are classified as either clockwise or counter-clockwise relative to the reference direction (reference direction: upwards for spatial attention condition; diagonal for feature-based attention condition). Based on the model's performance in this binary discrimination, directional thresholds can be obtained for each level of external noise (Fig. 6c; see Section 2). The shape of the TvN curve rests on only two free parameters: the amplitude of neuronal response (F), and the number of sub-sampled responses (S). The amplitude of neuronal response (F) determines the observer's sensitivity; the greater the firing rate of the detectors, the lower the directional thresholds. The number of local motion elements sampled (S) affects where the inflection point emerges on the curve; the smaller the subsample, the lower the external noise level at which the thresholds begin to rise.
Due to the stochastic nature of the model, the equivalent-noise model was fit to the behavioral threshold data using an exhaustive search of a discrete parameter space. Model estimates for every combination of parameters were obtained via Monte Carlo simulations for each external-noise level (1000 repetitions). The distribution of direction estimates obtained through model simulation allows us to assess the variance in directional estimates for each combination of parameters. Given the standard deviations of these estimates, using SDT we can obtain the model thresholds for each noise level as
| (4) |
where θT is the model directional threshold estimate at a specified d′ (at 75% accuracy, d′ = 0.95 for 2AFC) for a particular combination of parameters, given the standard deviation of model estimates σs, obtained via simulation. The model was fit to the data by choosing the combination of model parameters with threshold estimates yielding the highest R2.
3.3.1. Neutral condition
We first examined how well the model accounted for the baseline, neutral data. The model did a good job accounting for observers' performance in both neutral conditions.
In the spatial attention experiment, these two free model parameters (firing rate F and sub-sampling S) accounted for 89–95% of the variance in the results (AC, R2 = 0.89; TL, R2 = 0.95; SL, R2 = 0.93; Fig. 4a, solid lines). The best-fitting models were based on a sub-sample (S) between 17.5 and 40% of the total global motion elements (AC:20%, TL:17.5%, SL:40%), and the corresponding cortical population response (F) ranged from 30 to 52.5 spikes/s (AC:30 spikes/s, TL:52.5 spikes/s, SL:35 spikes/s).
In the feature-based attention experiment, the model accounted for 90–93% of the variance results of each observer (AC, R2 = 0.93; TL, R2 = 0.90; SL, R2 = 0.93; Fig. 4b, solid lines). The best-fitting models were based on a sub-sample of 7–12.5% of the global motion elements (AC:7.5%, TL:10%, SL:12.5%), and the corresponding cortical population response ranged from 20 to 25 spikes/s (AC:25 spikes/s, TL:20 spikes/s, SL:22.5 spikes/s).
3.3.2. Attention conditions
Having accounted for the performance in the neutral condition with our simple model we next examined whether attention operates by changing the gain or tuning of population responses using a formal derivation of the intuition introduced earlier for how gain and tuning influence TvN functions. For each observer, we fixed the previously estimated firing rate F and sub-sampling S parameters in the neutral conditions, and incorporated additional attentional components to the model, in which the population response was modulated by attentional gain or tuning.
3.3.3. Attentional gain model
Attentional gain proposes that the gain of the entire population response is boosted by a multiplicative factor. We denote this attentional gain coefficient as AG, which acts as a multiplicative scaling coefficient across all detector responses (Fig. 7a). Combined with Eq. (2), a pure gain model of attention on the response is expressed as
| (5) |
where represents the response given a gain modulation with attention, which is perturbed by Poisson noise and followed by sub-sampled integration as in Eq. (2). Hence, the response at every detector is boosted by a multiplicative factor. Given that for neural responses the response variance scales proportionally with the mean response, an attentional gain mechanism would predict a square-root improvement in discriminability with increases in the mean response amplitudes. In terms of TvN functions, on a log–log scale this yields the greatest benefits at low external noise levels, with the benefit tapering off as external noise increases.
Fig. 7.
Attentional tuning filters visualized. (a) The attentional filter describes the magnitude of attentional modulation as a function of angular difference from the unit's preferred direction to the attended direction. Gain and tuning have distinct attentional filters, with gain causing a constant attentional gain modulation (AG) regardless of the angular difference (dotted red line). Tuning is characterized by suppressive attentional modulation of responses to features that differ from the attended stimulus. This suppressive filter is modeled as a linear suppression, where the slope (TA) of the linear suppression prescribes how narrow the resulting population tuning becomes (dashed blue line). (b) Average estimated attentional filters for all three observers. Spatial attention was modulated exclusively by gain, with an average attentional gain of 1.77. Feature-based attention was modulated by both gain and tuning, with an average attentional gain of 1.4 and a tuning slope of 0.0032 deg−1. (For interpretation of color mentioned in this figure the reader is referred to the web version of the article.)
3.3.4. Attentional tuning model
Attentional tuning proposes that the gain of individual detector responses is suppressed for detectors whose preferred feature differs from the attended feature, with stronger suppression for detectors preferring less similar features to the attended one (Martinez-Trujillo & Treue, 2004). This suppression of individual detectors could potentially lead to a narrowed tuning for the population response. Thus, we modeled the effect of tuning as a suppression of detector responses that scaled linearly as a function of the angular distance from the attended direction, assuming that the magnitude of attentional suppression increases as the attended direction and detector-preferred direction become more dissimilar. To characterize this linear suppression, we modeled the attentional tuning filter as
| (6) |
where is an attentional scaling coefficient designating how much response is suppressed at each individual detector with preferred direction μj (Fig. 7a), with the attended motion direction represented by θA. TA denotes the slope of the linear suppression such that steeper slopes lead to sharper tuning of the population response profile. To avoid negative gain, the tuning filter is half-wave rectified (denoted by ⌊…⌋), which clips any potential negative gain to zero. Although it is likely that tuning is physiologically realized in a less-linear fashion, this model for tuning allows us to describe the width of the tuning function with one scaling coefficient, . Combined with Eq. (2), a pure tuning model of attention on the population response is expressed by
| (7) |
where represents the expected population response after a tuning modulation with attention, which is corrupted by Poisson noise and followed by subsampled integration as in Eq. (2). Here, the amount of attentional gain at each detector varies depending on how similar its preference is to the attended direction. By attenuating the gain of detectors as a function of how similar its preference is to the attended direction, the net result is a narrower population response profile. Tuning aids performance through external noise exclusion (e.g. Lu & Dosher, 1998; Lu & Dosher, 2000), which is functionally equivalent to a physical reduction in the noisiness of the stimulus. Because noise exclusion is most effective when there is plenty of external noise to filter out, tuning results in greater reduction of thresholds at high noise levels.
3.3.5. Hybrid model
The psychophysical results suggest that feature-based attention influences motion processing via a combination of both gain and tuning mechanisms (see Fig. 4b). To explore the possibility that attention could act via a hybrid model, we tested a third model that incorporated both a multiplicative increase in population response (AG), as well as a suppression of unattended features . We express this hybrid model as
| (8) |
where represents the expected population response given a combination of both gain and tuning modulation with attention, which is corrupted by Poisson noise and followed by subsampled integration as in Eq. (2). This results in a constant overall multiplicative boost across detectors, in addition to a selective suppression of detectors differing in preference from the attended direction.
In sum, gain and tuning have distinct effects on the output of the model. Whereas the gain model predicts an amplified MT population response that leads to a reduction of threshold at low levels of external noise, tuning predicts that a reduction of thresholds would occur primarily at high levels of external noise. The hybrid model of both gain and tuning predicts attentional benefits across all levels of external noise. For the spatial attention results, we found that a pure gain model of attention best accounted for the data, with attention boosting the firing rate (AG) to an attended stimulus by a factor of 1.77 on average (AC: AG = 1.6, R2 = 0.95; TL: AG = 1.9, R2 = 0.92; SL: AG = 1.8, R2 = 0.96; Fig. 7a, dashed lines). Because there were no observed reductions in behavioral thresholds with high noise, the tuning model led to poorer fits (R2 ranging from 0.73 to 0.81), and a nested hypothesis test revealed that the hybrid model did not provide a significantly superior account of the data for any observer (p's > .05; F test).
For the feature-based attention results, we found that neither a pure gain model nor a pure tuning model could sufficiently account for the pattern of results. Rather, a nested hypothesis test revealed that the hybrid model, comprising both gain and tuning, was necessary to best account for the data (p's < .05; F test). Feature-based attention boosted the firing rate (AG) to an attended signal by a factor of 1.4 on average, as well as sharpened the tuning filter's slope by an average of 0.0032 deg−1 (AC: AG = 1.8, TA = 0.0026, R2 = 0.84; TL: AG = 1.3, TA = 0.0017, R2 = 0.90; SL: AG = 1.1, TA = 0.0052 R2 = 0.80; Fig. 7b, dashed lines). Feature-based attention not only boosted the overall population response by a factor of 1.4, but for every single degree that a detector's preference differed from the attended stimulus, the gain of that detector's response was suppressed by a factor of 0.0032.
4. Discussion
How does attention optimize our visual system for the task at hand? The present results, in conjunction with model estimates, suggest that directing spatial or feature-based attention to a stimulus causes distinct changes in global motion processing. The model proposes that observers' behavioral performance in a global-motion task arises from population responses in visual area MT: performance is largely driven by the sensitivity of the visual detectors, as well as by the efficiency with which local motion responses are integrated (Dakin et al., 2005; Simpson et al., 2003). Attention influences performance by changing the gain and tuning of the population response, which exhibit different performance signatures depending on the amount of external noise in the display. Whereas gain predicts attentional benefits at low noise levels, tuning predicts benefits at high noise levels.
The data showed that spatial attention yielded benefits strictly with low external noise, and no benefits with high external noise. These results support a model in which spatial attention boosts the overall firing rate of the population response, with no change in the shape of the tuning profile. In contrast, feature-based attention led to benefits with both low and high external noise. These results support a model in which feature-based attention affects the population response by both amplifying the response to the attended signal, while attenuating the response to the irrelevant noise. Our model was able to account for the spatial-attention results with only three free parameters (firing rate F, sub-sampling S, and attentional gain AG), and the feature-based attention results were accounted for with these and the additional parameter of tuning slope TA.
To illustrate the influence of spatial and feature-based attention on the population response of visual area MT, Fig. 8 shows the expected population response based on the averaged parameter estimates. Spatial attention boosts the overall magnitude of population response by a constant factor, regardless of the preferred direction of individual detectors. This leads to an amplified firing rate, but no change in the bandwidth of the population response profile. In contrast, feature-based attention both amplifies the overall population response and reduces the gain for detectors that differ in preference from the attended direction. This leads to an amplified firing rate, as well as a narrower population response bandwidth.
Fig. 8.
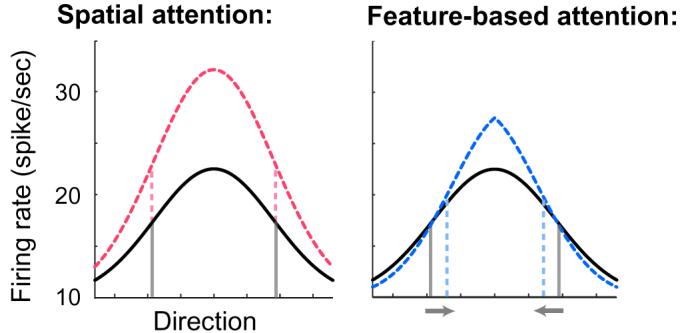
How attention modulates population response. Population responses are illustrated based on average model parameter estimates. Attention-modulated population response depicted by dotted lines. Spatial attention increases the overall firing rate of the population response, with no change in tuning, whereas feature-based attention both increases the overall firing rate, and sharpens the tuning of the population response. The dashed line indicates width at half-height of the population response.
Why might spatial attention and feature-based attention differ in their underlying mechanisms? These two types of attention optimize our visual system based on different types of information: whereas spatial attention guides an observer to a particular location, feature-based attention guides an observer to a particular feature of the stimulus. A strict gain increase of the population response is independent from the preference of a detector - it simply scales the overall response by a multiplicative factor. Both spatial- and feature-based attention benefit from this multiplicative factor. An optimal tuning mechanism necessarily requires the observer's knowledge of the feature around which to sharpen the population response. Feature-based attention provides such information, but spatial attention does not. Perhaps this precludes spatial attention from any potential tuning mechanism, while feature-based attention can take advantage of this information to improve discriminability.
Although it seems that spatial attention does not filter out noise in the direction domain, it may be that the nature of tuning is dependent on the nature of the attentional deployment. For instance, it is likely that spatial attention is better suited for filtering out information in the spatial domain, rather than direction. Neurophysiologically, this spatial tuning could reveal itself through a shrinking of receptive field size, which has been shown with spatial attention in macaque area MT (Womelsdorf, Anton-Erxleben, Pieper, & Treue, 2006). This would suggest that tuning, like gain, is a pervasive element of attention deployment, but that the domain where tuning occurs is dependent on the dimension in which attention is being deployed.
The present experiments were designed to tap into one or the other type of attention exclusively. However, it is possible that in the feature-based attention condition there was a spatial attention component, and vice versa. For instance, for the feature-based attention condition, the location of target stimulus was always fixed: in the original experiment, the stimulus was always located at fixation; in the control experiment, the stimulus was always located to the lower left of fixation. Because the target location was held constant across both the feature cueing and neutral conditions, effects of spatial attention were equated, and any difference between the conditions can be attributed to feature-based attention. Likewise, for the spatial attention condition, although we directed observers' spatial attention towards a target location, the target global motion reference direction was always upwards, thus it is possible that observers also directed their feature-based towards this reference direction. However, because the reference direction was held constant across both the spatial cueing and neutral conditions, effects of feature-based attention were equated and any effect can be attributed to spatial attention.
This line of reasoning relies on the common assumption that there is a linear relation between spatial and feature-based attention, which may not necessarily be the case. For instance, in the spatial attention condition, perhaps the mere presence of feature-based attention towards the reference direction, although equated between the cued and attended condition, causes a non-linear interaction with feature-based attention. The same argument could be made for spatial attention: although feature-based attention is equated between the spatial cued and neutral condition, the effects may not be additive. In principle, this theoretical issue would apply to most all studies attempting to test either pure spatial attention, or pure feature-based attention.
However, there is evidence that the effects of spatial attention and feature-based attention are indeed additive. Treue and Martinez-Trujillo (1999) measured attentional modulation in macaque area MT, and found that the sum of effects by feature-based attention and spatial attention was equivalent to a condition where attention was directed to both the feature and spatial location of a stimulus, which led them to conclude that their effects are additive. Analogous results have been shown in human fMRI, where the effects of spatial attention and feature-based attention were shown to be additive across V1, V2, V3a, V4, and MT+ (Saenz, Boynton, & Koch, 2006).
Furthermore, in reference to our results, were spatial attention and feature-based attention not additive, we would expect differences between the results of the original experiment and the control study, as the former stimulus was presented at fovea, and the latter in the periphery. However, the pattern of results was very similar, even though there was no covert spatial attention deployed to the stimulus at fixation compared to the stimulus in the periphery. This similarity further suggests that the effects of spatial attention and feature-based attention are additive in nature.
Previous psychophysical studies have explored the effect of attention on tuning curves (Baldassi & Verghese, 2005; Eckstein, Shimozaki, & Abbey, 2002; Lee et al., 1999; Lu & Dosher, 2000; Talgar, Pelli, & Carrasco, 2004). The equivalent-noise paradigm has been used in a series of psychophysical studies to infer the effect of attention on ‘perceptual templates’ (e.g. Lu & Dosher, 1998; Lu, Liu, & Dosher, 2000), which can be considered as tuning curves. By implementing their Perceptual Template Model (PTM), one can distinguish between signal enhancement and external noise reduction theories of attentional modulation. However, the external noise used to infer these perceptual templates does not always correspond to the relevant dimension for which the visual cortical responses are tuned. For instance, to assess the effect of spatial attention on motion-sensitive perceptual templates, static white noise was used as external noise (Lu et al., 2000). White noise does not affect the shape of the directionally selective tuning curve, but rather only the variance of response. By manipulating directional variance, our approach to external noise allows us to assess the global subsampling inefficiency that influences the shape of a directionally selective response. The model we propose is similar in spirit to the PTM, but also provides a physiologically plausible implementation of the PTM's theoretical framework: whereas increased gain modulation is the physiological realization of signal enhancement, narrowed tuning is the physiological realization of external noise reduction. By assessing the shape of direction-selective population responses, we were able to construct a biologically inspired model for motion perception that can make specific predictions as to how attention affects cortical response.
Using the method of noise masking, a psychophysical study has suggested that spatial attention and feature-based attention affect orientation-selective tuning curves differently (Baldassi & Verghese, 2005). The authors reported a reduction in threshold across the orientation-tuning curve with spatial attention, and a dip at the peak of the orientation-tuning curve with feature-based attention. They interpreted the spatial attention results as a reweighting of detectors similar to a gain change, whereas feature-based attention was proposed to affect orientation selectivity through a boost of the detector corresponding to the attended feature, with no change in any other detectors. Our findings differ in that they support a model in which feature-based attention operates both by increasing the overall strength of the population response and selectively suppressing irrelevant detector responses. This could be due to the difference in visual dimensions being studied (orientation vs. direction), or perhaps due to the different methods used to obtain the tuning curves (critical-band masking vs. equivalent noise).
The finding that spatial attention is strictly mediated by a gain mechanism supports neurophysiological and psychophysical studies showing that attention increases the gain of a signal. The nature of this gain mechanism has been debated, with varying accounts of the signal intensity at which attention most amplifies the effective signal strength; whereas some have found evidence for either a contrast gain (Ling & Carrasco, 2006a; Reynolds & Chelazzi, 2004) or response gain (Kim, Grabowecky, Paller, Muthu, & Suzuki, 2007; Morrone, Denti, & Spinelli, 2004) mechanism, others have found evidence for mixed models or an additive effect (Buracas & Boynton, 2007; Huang & Dobkins, 2005; Williford & Maunsell, 2006). However, the neurophysiological findings are specific to the gain of individual neurons - not the overall gain of the population response. Our findings suggest that the gain mechanism found at the single-unit level extends to the level of population response: spatial attention is driven by a multiplicative boost to the overall population response to a stimulus.
The findings for feature-based attention corroborates neurophysiological studies suggesting that neuronal gain caused by attending to a feature depends on how similar that neuron's preference is to the attended feature (Martinez-Trujillo & Treue, 2004; Treue & Martinez-Trujillo, 1999). The feature-similarity gain model of attention proposes a suppression of gain for detectors with preference dissimilar to the attended feature, and an enhancement for detectors that match the attended feature (Martinez-Trujillo & Treue, 2004). This selective change in gain could lead to sharpened tuning at the level of the population response. However, it is not necessarily the case that a decrease in response for detectors of dissimilar preferences must lead to a narrowing of the width of the population response. For instance, if attention were to suppress the responses of detectors preferring dissimilar features below baseline levels, it is possible there would to be no change in the bandwidth of the population response.
What influence would a change in baseline response have on our model? Our model assumes that attention modulates the population in three possible ways: gain, tuning, and a hybrid of both. However, another possibility remains, which is that attention suppresses activity for directions dissimilar to the attended one below baseline, spontaneous activity. In terms of the model, this would correspond to a suppression of responses below the specified baseline response (b) for detectors that differ enough from the attended direction. Functionally, decreasing the response of distant detectors below spontaneous activity is equivalent to increasing the gain of a population response, as the magnitude of relative response (difference between maximum and minimum firing rate) increases regardless of whether it is the peak response that increases while the baseline remains fixed, or it is the baseline response that decreases while the peak response remains fixed. This is similar to the PTM (Lu & Dosher, 1998; Lu et al., 2000), in which signal enhancement cannot be distinguished from a reduction in additive internal noise; in our model a boost in gain has the same effect as attenuating the response for distant detectors below baseline levels: in terms of TvN curves, both benefit performance at low external noise levels. By restricting the attentional tuning filter from suppressing responses below baseline, spontaneous activity (b), our model exhibits mutually exclusive effects on the TvN curve for gain and tuning, hence allowing us to isolate and distinguish the contribution of the two mechanisms. Additional research is necessary to further distinguish a gain mechanism vs. suppression of response below baseline.
Our brains are surprisingly limited in the amount of information that can be processed at any given moment. Biophysical calculations based on the cortical energy consumption suggest that only as little as 1% of our neurons can be significantly active at a time (Lennie, 2003). Attention serves the critical role of selecting what information to grant priority of processing. Our results show that the means by which attention prioritizes information depends on the type of attention deployed and that the locus of this modulation can be traced back to cortical areas of visual processing. Whereas attending to the location of a stimulus boosts the overall population response, attending to the relevant feature of a stimulus both amplifies and sharpens the tuning of the population response.
Acknowledgments
This work was funded by an NRSA to S.L. (5 F31 NS051111-03) and NIH to M.C. (R01 EY016200-01A2). We thank M. Landy and all the members of the Carrasco Lab for their valuable comments.
References
- Albright TD. Direction and orientation selectivity of neurons in visual area MT of the macaque. Journal of Neurophysiology. 1984;52:1106–1130. doi: 10.1152/jn.1984.52.6.1106. [DOI] [PubMed] [Google Scholar]
- Baldassi S, Verghese P. Attention to locations and features: Different top-down modulation of detector weights. Journal of Vision. 2005;5:556–570. doi: 10.1167/5.6.7. [DOI] [PubMed] [Google Scholar]
- Brainard DH. The Psychophysics Toolbox. Spatial Vision. 1997;10:433–436. [PubMed] [Google Scholar]
- Britten KH, Newsome WT. Tuning bandwidths for near-threshold stimuli in area MT. Journal of Neurophysiology. 1998;80:762–770. doi: 10.1152/jn.1998.80.2.762. [DOI] [PubMed] [Google Scholar]
- Britten KH, Shadlen MN, Newsome WT, Movshon JA. Responses of neurons in macaque MT to stochastic motion signals. Visual Neuroscience. 1993;10:1157–1169. doi: 10.1017/s0952523800010269. [DOI] [PubMed] [Google Scholar]
- Buracas GT, Boynton GM. The effect of spatial attention on contrast response functions in human visual cortex. Journal of Neuroscience. 2007;27:93–97. doi: 10.1523/JNEUROSCI.3162-06.2007. [DOI] [PMC free article] [PubMed] [Google Scholar]
- Carrasco M, Penpeci-Talgar C, Eckstein M. Spatial covert attention increases contrast sensitivity along the CSF: Support for signal enhancement. Vision Research. 2000;40:1203–1215. doi: 10.1016/s0042-6989(00)00024-9. [DOI] [PMC free article] [PubMed] [Google Scholar]
- Dakin SC, Mareschal I, Bex PJ. Local and global limitations on direction integration assessed using equivalent noise analysis. Vision Research. 2005;45:3027–3049. doi: 10.1016/j.visres.2005.07.037. [DOI] [PubMed] [Google Scholar]
- Deneve S, Latham PE, Pouget A. Reading population codes: A neural implementation of ideal observers. Nature Neuroscience. 1999;2:740–745. doi: 10.1038/11205. [DOI] [PubMed] [Google Scholar]
- Eckstein MP, Shimozaki SS, Abbey CK. The footprints of visual attention in the Posner cueing paradigm revealed by classification images. Journal of Vision. 2002;2:25–45. doi: 10.1167/2.1.3. [DOI] [PubMed] [Google Scholar]
- Ghandi SP, Heeger DJ, Boynton GM. Spatial attention affects brain activity in human primary visual cortex. Proceedings of the National Academy of Sciences USA. 1999;96:3314–3319. doi: 10.1073/pnas.96.6.3314. [DOI] [PMC free article] [PubMed] [Google Scholar]
- Huang L, Dobkins KR. Attentional effects on contrast discrimination in humans: Evidence for both contrast gain and response gain. Vision Research. 2005;45:1201–1212. doi: 10.1016/j.visres.2004.10.024. [DOI] [PubMed] [Google Scholar]
- Jazayeri M, Movshon JA. Optimal representation of sensory information by neural populations. Nature Neuroscience. 2006;9:690–696. doi: 10.1038/nn1691. [DOI] [PubMed] [Google Scholar]
- Kim YJ, Grabowecky M, Paller KA, Muthu K, Suzuki S. Attention induces synchronization-based response gain in steady-state visual evoked potentials. Nature Neuroscience. 2007;10:117–125. doi: 10.1038/nn1821. [DOI] [PubMed] [Google Scholar]
- Kohn A, Movshon JA. Adaptation changes the direction tuning of macaque MT neurons. Nature Neuroscience. 2004;7:764–772. doi: 10.1038/nn1267. [DOI] [PubMed] [Google Scholar]
- Lee DK, Itti L, Koch C, Braun J. Attention activates winner-take-all competition among visual filters. Nature Neuroscience. 1999;2(4):375–381. doi: 10.1038/7286. [DOI] [PubMed] [Google Scholar]
- Lennie P. The cost of cortical computation. Current Biology. 2003;13:493–497. doi: 10.1016/s0960-9822(03)00135-0. [DOI] [PubMed] [Google Scholar]
- Ling S, Carrasco M. Sustained and transient covert attention enhance the signal via different contrast response functions. Vision Research. 2006a;46:1210–1220. doi: 10.1016/j.visres.2005.05.008. [DOI] [PMC free article] [PubMed] [Google Scholar]
- Ling S, Carrasco M. When sustained attention impairs perception. Nature Neuroscience. 2006b;9:1243–1245. doi: 10.1038/nn1761. [DOI] [PMC free article] [PubMed] [Google Scholar]
- Liu T, Larsson J, Carrasco M. Feature-based attention modulates orientation-selective responses in human visual cortex. Neuron. 2007;55:313–323. doi: 10.1016/j.neuron.2007.06.030. [DOI] [PMC free article] [PubMed] [Google Scholar]
- Liu T, Pestilli F, Carrasco M. Transient attention enhances perceptual performance and fMRI response in human visual cortex. Neuron. 2005;45:469–477. doi: 10.1016/j.neuron.2004.12.039. [DOI] [PMC free article] [PubMed] [Google Scholar]
- Liu T, Stevens ST, Carrasco M. Comparing the time course and efficacy of spatial and feature-based attention. Vision Research. 2007;47:108–113. doi: 10.1016/j.visres.2006.09.017. [DOI] [PubMed] [Google Scholar]
- Lu Z-L, Dosher BA. External noise distinguishes attention mechanisms. Vision Research. 1998;38:1183–1198. doi: 10.1016/s0042-6989(97)00273-3. [DOI] [PubMed] [Google Scholar]
- Lu Z-L, Dosher BA. Spatial attention: Different mechanisms for central and peripheral temporal precues? Journal of Experimental Psychology: Human Perception and Performance. 2000;26:1534–1548. doi: 10.1037//0096-1523.26.5.1534. [DOI] [PubMed] [Google Scholar]
- Lu ZL, Liu CQ, Dosher BA. Attention mechanisms for multi-location first- and second-order motion perception. Vision Research. 2000;40:173–186. doi: 10.1016/s0042-6989(99)00172-8. [DOI] [PubMed] [Google Scholar]
- Martinez-Trujillo JC, Treue S. Attentional modulation strength in cortical area MT depends on stimulus contrast. Neuron. 2002;35:365–370. doi: 10.1016/s0896-6273(02)00778-x. [DOI] [PubMed] [Google Scholar]
- Martinez-Trujillo JC, Treue S. Feature-based attention increases the selectivity of population responses in primate visual cortex. Current Biology. 2004;14:744–751. doi: 10.1016/j.cub.2004.04.028. [DOI] [PubMed] [Google Scholar]
- McAdams CJ, Maunsell JHR. Effects of attention on orientation-tuning functions of single neurons in macaque cortical area V4. Journal of Neuroscience. 1999;19:431–441. doi: 10.1523/JNEUROSCI.19-01-00431.1999. [DOI] [PMC free article] [PubMed] [Google Scholar]
- Morrone MC, Denti V, Spinelli D. Different attentional resources modulate the gain mechanisms for color and luminance contrast. Vision Research. 2004;44(12):1389–1401. doi: 10.1016/j.visres.2003.10.014. [DOI] [PubMed] [Google Scholar]
- Movshon JA, Newsome WT. Visual response properties of striate cortical neurons projecting to area MT in macaque monkeys. Journal of Neuroscience. 1996;16:7733–7741. doi: 10.1523/JNEUROSCI.16-23-07733.1996. [DOI] [PMC free article] [PubMed] [Google Scholar]
- Pelli DG. Uncertainty explains many aspects of visual contrast detection and discrimination. Journal of the Optical Society of America A. 1985;2:1508–1532. doi: 10.1364/josaa.2.001508. [DOI] [PubMed] [Google Scholar]
- Pelli DG. The VideoToolbox software for visual psychophysics: Transforming numbers into movies. Spatial Vision. 1997;10:437–442. [PubMed] [Google Scholar]
- Pelli DG, Farell B. Why use noise? Journal of the Optical Society of America A, Optics, image science, and vision. 1999;16:647–653. doi: 10.1364/josaa.16.000647. [DOI] [PubMed] [Google Scholar]
- Pouget A, Dayan P, Zemel R. Information processing with population codes. Nature Reviews Neuroscience. 2000;1:125–132. doi: 10.1038/35039062. [DOI] [PubMed] [Google Scholar]
- Pouget A, Dayan P, Zemel RS. Inference and computation with population codes. Annual Reviews Neuroscience. 2003;26:381–410. doi: 10.1146/annurev.neuro.26.041002.131112. [DOI] [PubMed] [Google Scholar]
- Reynolds JH, Chelazzi L. Attentional modulation of visual processing. Annual Reviews Neuroscience. 2004;27:611–647. doi: 10.1146/annurev.neuro.26.041002.131039. [DOI] [PubMed] [Google Scholar]
- Rust NC, Mante V, Simoncelli EP, Movshon JA. How MT cells analyze the motion of visual patterns. Nature Neuroscience. 2006;9:1421–1431. doi: 10.1038/nn1786. [DOI] [PubMed] [Google Scholar]
- Saenz M, Boynton GM, Koch C. Combined effects of spatial and feature-based attention in human visual cortex [Abstract] Journal of Vision. 2006;6(6):599. http://journalofvision.org/6/6/599/. 599a, doi:10.1167/6.6.599. [Google Scholar]
- Saenz M, Buracas GT, Boynton GM. Global effects of feature-based attention in human visual cortex. Nature Neuroscience. 2002;5(7):631–632. doi: 10.1038/nn876. [DOI] [PubMed] [Google Scholar]
- Shadlen MN, Britten KH, Newsome WT, Movshon JA. A computational analysis of the relationship between neuronal and behavioral responses to visual motion. Journal of Neuroscience. 1996;16:1486–1510. doi: 10.1523/JNEUROSCI.16-04-01486.1996. [DOI] [PMC free article] [PubMed] [Google Scholar]
- Shadlen MN, Newsome WT. The variable discharge of cortical neurons: Implications for connectivity, computation and information coding. Journal of Neuroscience. 1998;18:3870–3896. doi: 10.1523/JNEUROSCI.18-10-03870.1998. [DOI] [PMC free article] [PubMed] [Google Scholar]
- Simpson WA, Falkenberg HK, Manahilov V. Sampling efficiency and internal noise for motion detection, discrimination, and summation. Vision Research. 2003;43:2125–2132. doi: 10.1016/s0042-6989(03)00336-5. [DOI] [PubMed] [Google Scholar]
- Talgar CP, Pelli DG, Carrasco M. Covert attention enhances letter identification without affecting channel tuning. Journal of Vision. 2004;4:23–32. doi: 10.1167/4.1.3. [DOI] [PubMed] [Google Scholar]
- Treue S, Martinez-Trujillo JC. Feature-based attention influences motion processing gain in macaque visual cortex. Nature. 1999;39:575–579. doi: 10.1038/21176. [DOI] [PubMed] [Google Scholar]
- Treue S, Maunsell JH. Attentional modulation of visual motion processing in cortical areas MT and MST. Nature. 1996;382:539–541. doi: 10.1038/382539a0. [DOI] [PubMed] [Google Scholar]
- Williford T, Maunsell JH. Effects of spatial attention on contrast response functions in macaque area V4. Journal of Neurophysiology. 2006;96:40–54. doi: 10.1152/jn.01207.2005. [DOI] [PubMed] [Google Scholar]
- Womelsdorf T, Anton-Erxleben K, Pieper F, Treue S. Dynamic shifts of visual receptive fields in cortical area MT by spatial attention. Nature Neuroscience. 2006;9:1156–1160. doi: 10.1038/nn1748. [DOI] [PubMed] [Google Scholar]