Abstract
Purpose
The purpose of this study was to validate a newly developed diffuse optical tomography (DOT) system on benign cysts in the breast.
Procedures
Eight patients with 20 benign cysts were included. Study procedures consisted of optical breast imaging and breast magnetic resonance imaging (MRI) for comparison. A reconstruction algorithm computed three-dimensional images for each of the four near-infrared wavelengths used by our DOT system (Philips Healthcare, Best, The Netherlands). These images were combined using a spectroscopic model to assess tissue composition and lesion size.
Results
Twenty cysts were analyzed in eight patients. By using the spectroscopic information, 13 of 20 cysts (65%) were visualized with DOT, confirming their high water and low total hemoglobin content. Lesion size and location showed good agreement with MRI; Pearson correlation coefficient was 0.7 (p < 0.01).
Conclusions
DOT can visualize benign cysts in the breast and elucidate their high water and low total hemoglobin content by spectroscopic analysis.
Key words: Optical Tomography, Spectroscopy, Breast, Absorption, Continuous wave, DOT
Introduction
Diffuse optical tomography (DOT) is a novel imaging technique that uses near-infrared (NIR) light in the wavelength range of ∼700 to 1,000 nm to assess optical properties of tissue [1]. Light absorption at these wavelengths is minimal, allowing for sufficient tissue penetration (up to 15 cm) in breast imaging. Information on tissue composition, i.e., concentrations of oxy- and deoxyhemoglobin, water, and lipid, can be obtained by combining images acquired at various wavelengths (spectroscopic imaging). In a malignant tumor, hemoglobin (Hb) concentration is directly related to angiogenesis, a key factor required for tumor growth and metastases [2]. In addition, the proportions of oxy- and deoxyhemoglobin change in such a tumor due to its metabolism [3]. By measuring concentrations of the main chromophores in the breast, discrimination of benign and malignant tumors may be possible with DOT. This technique could complement currently used breast imaging modalities, ultrasound, X-ray mammography, and magnetic resonance imaging (MRI) in the diagnosis and early detection of breast cancer. Ultrasound can easily distinguish cysts from solid lesions but is less specific than X-ray mammography in differentiating benign from malignant masses [4]. It is used as an adjunct to X-ray mammography, not as stand-alone screening tool, and is limited by its operator dependence as well as the lack of standardized examination criteria [5]. The overall sensitivity of X-ray mammography for breast cancer detection is moderate (75%), though in (young) women with dense breasts, the sensitivity drops to near 62% [6]. Since these women are at a four to six times increased breast cancer risk, this is a major disadvantage of X-ray mammography [7]. Magnetic resonance imaging has high sensitivity (>90%), also in dense breasts, but is very costly [8, 9]. Positive predictive value of MRI is decreased in lesions <5 mm [10]. As lesion size upon diagnosis decreases with more efficient screening programs, the need for a non-invasive tool that provides more specific information on lesions becomes relevant. DOT has great potential in the early detection of breast cancer if target-specific fluorescent probes allow for in vivo imaging of molecular changes associated with cancer formation [11]. Moreover, DOT uses no ionizing radiation and can thus be used repeatedly, also in younger women. The technique is relatively inexpensive leading to relatively easy access which is an important advantage in regions where no MRI scanner is available.
Optical imaging systems are still in their infancy, and several research groups are investigating different techniques [12]. Three distinct illumination methods are being employed: time domain [13–15], frequency domain [16, 17], and continuous wave [18–20]. Some groups combine their optical system with another modality, such as ultrasound or MRI [17, 21]. Furthermore, compression of the breast [13–15], optical fluid [13], and various wavelengths in the NIR range are being investigated. To create a robust platform for optical breast imaging, it is important to validate systems in an adequate manner. We started our validation process in a simple breast model, benign cysts, with the aim to determine the optical characteristics of these lesions. MRI was the benchmark for DOT because it also provides three-dimensional data and has excellent soft-tissue contrast.
The purpose of this study was to validate a newly developed DOT system on benign cysts in the breast.
Methods
Patients
Eight women (mean age 48, range 38–60) diagnosed with a total of 20 cystic breast lesions were prospectively included between October 2006 and September 2007 at the University Medical Center Utrecht, the Netherlands. Patients were asked to participate in the study if a benign cyst larger than 10 mm was found by ultrasound and needle aspiration had not yet been performed, since this would influence the optical images. Additional to the normal clinical diagnostic procedure of mammography and ultrasound, patients underwent optical imaging and noncontrast-enhanced MRI as part of the study protocol. Patients with contra-indications for MRI were excluded. The protocol was approved by the ethics committee of the University Medical Center Utrecht, and written informed consent was obtained from all patients.
Optical Imaging
Data Acquisition
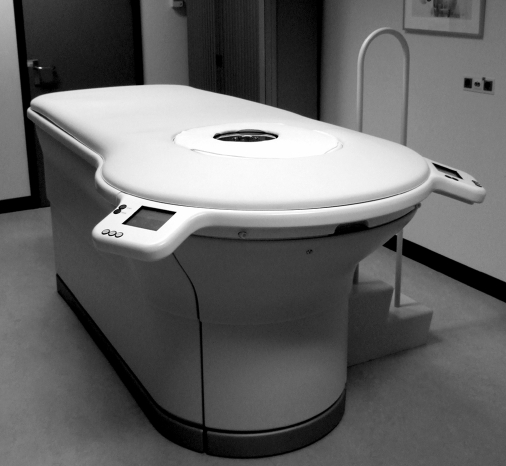
Diffuse optical tomography scans were performed on a Philips Diffuse Optical Tomography system (Philips Healthcare, Best, the Netherlands). A patient was placed in the prone position on the system bed with one breast suspended in the cup (Fig. 1). The scanning module of the DOT system consists of a cup with a total of 507 optical fibers mounted on the surface. The 253 source fibers on all sides of the cup are connected to a fiber switch to direct the light of four continuous-wave solid-state lasers into the cup. These fibers are interleaved with 254 detector fibers connected to 254 detectors. For each scan, the cup was filled with a matching fluid that has optical properties approximately equal to those of the average breast. This matching fluid enables a stable optical coupling between the fibers and the breast, and it eliminates optical shortcuts of the diffuse light around the breast. During imaging, the breast was sequentially illuminated with continuous-wave near-infrared light from all source positions. Light emanating from the breast was detected for each source position by the detector fibers on all sides of the cup. Images were obtained at four discrete wavelengths (690, 730, 780, and 850 nm). Each breast is scanned separately. The duration of the examination was approximately 1 min per wavelength, in total about 10 min per patient.
Fig. 1.
The Philips diffuse optical tomography system.
Image Reconstruction
After optical data acquisition, three-dimensional absorption images were reconstructed by a linear reconstruction algorithm based on the Rytov approximation [22–24]. One image was calculated for each wavelength. Since the reconstruction algorithm assumes constant scattering throughout the measurement cup, there is an influence of scattering variations on the reconstructed absorption images. If the average scattering of the breast is different from the scattering of the fluid, there will be an offset on the reconstructed breast absorption. If there is a variation of the scattering within the breast, the reconstructed image also shows features due to these variations.
Spectral Post-processing
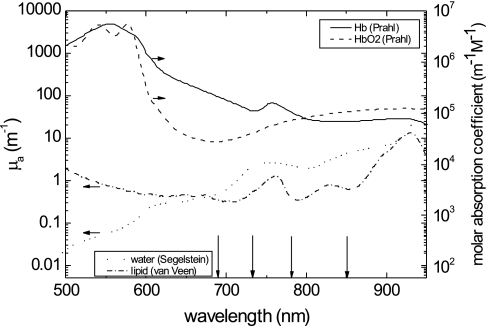
In addition, optical images of the four wavelengths were combined to convert the absorption coefficients into hemoglobin, oxyhemoglobin (HbO2), water, and lipid concentrations. We assumed that these were the only chromophores present in the breast. To determine the concentrations, we used the relation  , where c refers to the concentrations of the four chromophores, [ɛ] is a 4 × 4 matrix of molar absorption values of the four chromophores for the four wavelengths used by the DOT machine, and μa is the vector of reconstructed absorption coefficients at each wavelength. The spectra that were used to fill [ɛ] are shown in Fig. 2 (data taken from [25–27] for water, lipid, hemoglobin, and oxyhemoglobin, respectively). Finally, the Hb and HbO2 concentrations were added to obtain a measure of the total hemoglobin concentration. However, as a consequence of using continuous-wave light, our reconstruction algorithm could not account for scattering variations in the breast, in contrast with other research groups using time domain or frequency domain techniques [13–17]. In addition, since the breast contains more than the four chromophores mentioned, this model only approximates the breast composition. We therefore choose to discuss “enhancement” by chromophores rather than their absolute concentration. Three-dimensional enhanced-water maps, with high signal intensity for high water concentration, and three-dimensional enhanced-blood maps, with high signal intensity for high blood concentration (and low signal intensity in case of blood depletion), were generated.
Fig. 2.
Absorption spectra of the main constituents of breast tissue, represented in terms of absorption coefficients for water and lipid, and molar absorption coefficients for hemoglobin and oxyhemoglobin. Data were taken from [25–27] for water, lipid, Hb, and HbO2, respectively. The wavelengths of the lasers used for the DOT measurements are indicated by the vertical black arrows.
MRI
Non-contrast enhanced breast MRI was performed on a 3.0T clinical MR system (3.0T Achieva, Philips Healthcare, Best, The Netherlands). Patients were placed in prone position on a dedicated four-element SENSitivity Encoding (SENSE)-compatible phased-array bilateral breast coil (MRI devices, Würzburg, Germany) utilized for simultaneous imaging of both breasts. The scan protocol included an axial high-resolution T1-weighted fast gradient echo fat-suppressed series (TE/TR 1.7/4.5 ms; inversion delay SPAIR 130 ms; flip angle 10°; field of view (FOV) 340 × 340 mm2, acquired voxel size 0.66 × 0.66 × 1.6 mm3, reconstructed voxel size 0.66 × 0.66 × 0.80 mm3) and an axial T2-weighted fat-suppressed series (TE/TR 120/9,022 ms; inversion delay Spectral Selection Attenuated Inversion Recovery (SPAIR) 125 ms; flip angle 90°; FOV 340 × 340 mm2, acquired voxel size 1.01 × 1.31 × 2.0 mm3, reconstructed voxel size 0.66 × 0.66 × 2.00 mm3).
Image Interpretation and Statistics
MRI data was used to derive the location of the cysts. Size measurements were performed on the axial MR slices showing the largest diameters of the cysts. This information was used as a reference standard for the optical measurements.
All four absorption images were viewed on the console of the DOT system. The visibility of the lesions on DOT was assessed in a qualitative manner. When the reconstructed values at the lesion site (derived from MRI) were clearly lower or higher than those of the surrounding tissue (background), the cyst was considered visible. Lower values can be expected when absorption and/or scattering properties of the lesion are lower than those of the background. The physiological maps of water and total hemoglobin were evaluated and compared to the MRI data.
Maximum diameters of the lesions were measured on the axial view of the physiological maps from the full width at half maximum of the signal intensity through the center of the cyst region, and compared to the maximum diameters measured on the axial MR images. The Bland Altman method was used to measure the agreement of lesion size between the MRI and DOT measurements [28]. The Pearson correlation coefficient was calculated to estimate the correlation between the two methods.
Results
Eight women with 20 benign cysts underwent optical breast imaging with the new DOT system and breast MRI for comparison. All cysts were clearly visible on MRI, showing high signal intensity on the T2 weighted images. Maximum lesion sizes measured on the MR images ranged from 8 to 40 mm (median size 21 mm). Cysts smaller than 5 mm detected on MRI were not taken into account in this study.
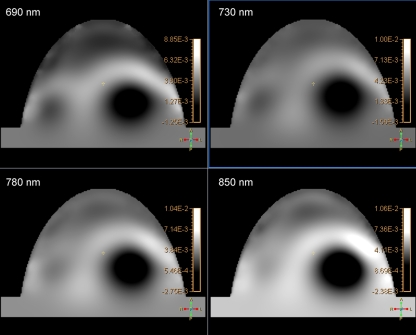
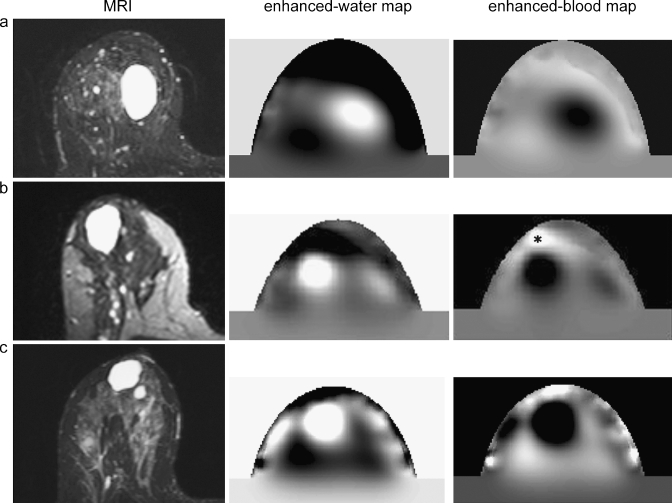
Based on the absorption images only, six of the 20 benign cysts (30%) were clearly distinguishable with DOT. These lesions had lower absorption compared to the surrounding tissue for all of the four wavelengths (Fig. 3). By using the information from the physiological maps, 13 of 20 benign cysts (65%) were evident on DOT. The enhanced-water and -blood maps showed high water content and low total hemoglobin content at the position of these cysts (Fig. 4).
Fig. 3.
Example of the optical absorption images of one patient for the four wavelengths (690, 730, 780, and 850 nm). The cyst (40 mm in diameter) shows low signal intensity (low absorption) in all of the four wavelengths.
Fig. 4.
Examples of images of three patients (a, b, c): T2 weighted MRI with fat suppression compared to the enhanced-water maps and the enhanced-blood maps of the optical data sets. The cysts show a high signal intensity on the MRI and the enhanced-water maps (high water content) and a low signal intensity on the enhanced-blood maps (low blood content). Asterisk nipple.
Detected lesions had maximum diameters of 15 mm and larger. Two cysts with diameters of 10 and 8 mm on MRI were not visible with DOT. Five cysts that were located close to the chest wall were not detected because they were outside the field of view of the current DOT system.
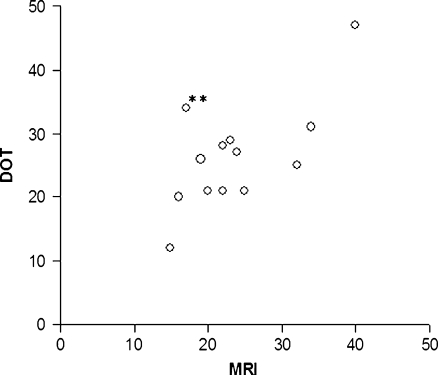
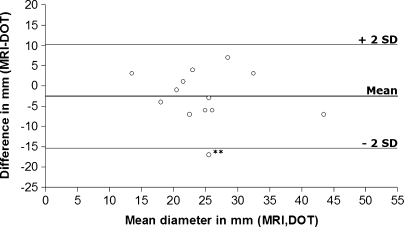
The maximum diameters of the detected lesions are plotted in Fig. 5. There was a good agreement between the optical measurements and MRI, with a Pearson correlation coefficient of 0.7 (p < 0.01). Figure 6 displays the Bland Altman plot in which the absolute differences between MRI and DOT are plotted against the mean of the two methods. The three horizontal lines represent the mean difference (middle line) and the limits of agreement (outer lines: mean difference ± 2SD) [28]. DOT overestimated the lesion size on average by 2.5 mm (mean difference MRI-DOT, −2.5 mm; 95% confidence interval, −6.4 to 1.3).
Fig. 5.
Scatter plot of diameters in millimeters measured with MRI (x-axis) and DOT (y-axis). Pearson correlation coefficient, 0.7 (p < 0.01). If merged lesions (double asterisk) were excluded from analysis, Pearson correlation coefficient increased to 0.8 (p < 0.01).
Fig. 6.
Bland Altman plot of lesion sizes in millimeters. Absolute differences between MRI and DOT (y-axis) are plotted against the mean of the two methods (x-axis). The horizontal lines represent the mean difference (middle line) and limits of agreement (mean difference ± 2SD). Double asterisk merged lesions.
Discussion
In this study, we validated a new DOT system for breast imaging on benign cysts with MRI as a benchmark. Cysts were visible with DOT, and spectroscopic analysis showed high water and low total hemoglobin content. Lesion sizes on DOT correlated well with MRI measurements.
As described previously, most recent optical imaging studies focused on solid tumors. They showed higher absorption for carcinomas than for the surrounding normal parenchyma due to increased hemoglobin content [13–19, 21]. Few studies reported on the characterization of cysts with optical imaging devices. Ntziachristos et al. reported on low absorption for cysts [21], and Taroni et al. described low scattering in cysts [15]. In Gu et al. [20], it was shown that cysts had a lower optical attenuation than the background. They described both low absorption and low scattering in four of the cysts and only low scattering in one case.
In our study, the cysts visible on optical absorption images appeared as regions darker than the surrounding tissue (Fig. 3). This could be caused by either lower absorption properties, lower scattering properties, or the combination of both. The use of continuous-wave light transmission hampers the distinction between scattering and absorption [29]. With other illumination techniques, time domain (e.g., used by the groups of Intes, Rinneberg, and Taroni [13–15]) and frequency domain (e.g., used by the groups of Tromberg and Zhu [16, 17]), it is more straightforward to make this distinction. These methods have the disadvantage of being more expensive and requiring longer acquisition times than the continuous-wave technique.
In one of the patients in our study, an opposite effect was seen: the cyst had a higher signal intensity (higher absorption/scattering) compared to the surrounding tissue, with lower water and higher total hemoglobin content on the physiological maps. On MRI and ultrasound, this cyst had similar characteristics as the other cysts in our study. Such an opposite effect was also reported by Gu et al. who described a cyst with both higher absorption and higher scattering compared to the surrounding tissue [20]. As suggested by Gu et al., an explanation for this opposite effect could be a different content of the cyst. To verify this hypothesis, future aspiration and evaluation of cyst contents could be considered.
Spectroscopic analysis of the cysts in our study elucidated their high water content and low hemoglobin content (Fig. 4). Combining the four wavelengths improved lesion detection: without spectral information only six cysts were visible, while with spectroscopic analysis 13 of the 20 lesions could be detected.
Seven of the 20 cysts were not detected by our DOT system. We believe there are two reasons for this. First, five cysts were located too close to the chest wall for the current dimensions of the optical scanner to image. These lesions were most likely physically located too far above the upper optical fibers in the cup to influence the light pathways. Advances in cup geometry are feasible and would result in improved visualization of lesions near the chest wall. Second, spatial resolution of DOT is poor [1, 30], resulting in a lower signal-to-noise ratio and limited detectability for small lesions: two lesions of 10 and 8 mm were too small to be visualized by our DOT system. One of these cysts was probably merged with the nearby larger lesion in the optical image, leading to a significant overestimation of that cyst (Fig. 5). All detected lesions had diameters of at least 15 mm. For lesions visible on DOT images, a good agreement in lesion size with MRI was found (Figs. 5 and 6). Pearson correlation coefficient was 0.7 (p < 0.01). If the lesion that we believed to be merged with the nearby lesion was excluded from the analysis, Pearson correlation coefficient increased to 0.8 (p < 0.01). On average, lesion size was overestimated by 2.5 mm with DOT, and most optical size measurements did not differ more than 6 mm from MRI measurements. By exclusion of the supposedly merged lesion, overestimation was reduced to 1.3 mm (mean difference MRI–DOT, −1.3 mm; 95% confidence interval, −4.4 to 1.7). Lesions overestimated by more than 6 mm with DOT were located in a central position in the cup where the spatial resolution of the system is the lowest, leading to partial volume effects.
Lesion detection is more difficult and size measurement less precise in the center of the cup compared to the edge of the cup because longer light pathways decrease spatial resolution. This may be a limitation in large breasts with centrally located lesions. Optical data acquisition using slab geometry with slight breast compression could offer a solution to this problem. We did not encounter variations in lesion visibility for different breast densities in this data set.
Typically, close to the boundary of the cup, structures were noted with very high signal intensities (e.g., Fig. 4, patient c). These are reconstruction artifacts caused by inconsistencies in the data. They show up strongest at the source and detector positions and can be identified as artifacts due to their position at the cup wall. Also, in most patients, the nipples were visible as regions of high signal intensity on the enhanced-blood maps (Fig. 4, patient b) and low signal intensity on the enhanced-water maps.
For evaluation of the optical data, we used the knowledge of lesion location from the MRI data. This approach in image interpretation possibly resulted in the exclusion of false-positive findings, such as the high signal intensities caused by artifacts. Blinded reading of images should be performed to give a better estimate of the diagnostic value.
This study was the first step in the validation of a new DOT system. Further steps will involve validation on malignant breast lesions (including discrimination of malignant from benign lesions, such as cysts) and feasibility studies with fluorescent optical probes to increase specificity. Such fluorescent probes emit photons at predefined wavelengths after excitation by laser light and have already been used successfully in animal experiments [31, 32].
In conclusion, we initiated the validation of a new DOT system on benign cysts in the breast. DOT was able to visualize cysts and elucidate their high water and low total hemoglobin content by spectroscopic analysis.
Acknowledgments
Open Access This article is distributed under the terms of the Creative Commons Attribution Noncommercial License which permits any noncommercial use, distribution, and reproduction in any medium, provided the original author(s) and source are credited.
References
- 1.Gibson AP, Hebden JC, Arridge SR (2005) Recent advances in diffuse optical imaging. Phys Med Biol 50:R1–R43 [DOI] [PubMed]
- 2.Rice A, Quinn CM (2002) Angiogenesis, thrombospondin, and ductal carcinoma in situ of the breast. J Clin Pathol 55:569–574 [DOI] [PMC free article] [PubMed]
- 3.Vaupel P, Harrison L (2004) Tumor hypoxia: causative factors, compensatory mechanisms, and cellular response. Oncologist 9(Suppl 5):4–9 [DOI] [PubMed]
- 4.Irwig L, Houssami N, van Vliet C (2004) New technologies in screening for breast cancer: a systematic review of their accuracy. Br J Cancer 90:2118–2122 [DOI] [PMC free article] [PubMed]
- 5.Elmore JG, Armstrong K, Lehman CD, Fletcher SW (2005) Screening for breast cancer. JAMA 293:1245–1256 [DOI] [PMC free article] [PubMed]
- 6.Carney PA, Miglioretti DL, Yankaskas BC et al (2003) Individual and combined effects of age, breast density, and hormone replacement therapy use on the accuracy of screening mammography. Ann Intern Med 138:168–175 [DOI] [PubMed]
- 7.Boyd NF, Guo H, Martin LJ et al (2007) Mammographic density and the risk and detection of breast cancer. N Engl J Med 356:227–236 [DOI] [PubMed]
- 8.Peters NH, Borel R, Zuithoff NP, Mali WP, Moons KG, Peeters PH (2008) Meta-analysis of MR imaging in the diagnosis of breast lesions. Radiology 246:116–124 [DOI] [PubMed]
- 9.Kuhl CK (2007) Current status of breast MR imaging. Part 2. Clinical applications. Radiology 244:672–691 [DOI] [PubMed]
- 10.Liberman L, Mason G, Morris EA, Dershaw DD (2006) Does size matter? Positive predictive value of MRI-detected breast lesions as a function of lesion size. AJR Am J Roentgenol 186:426–430 [DOI] [PubMed]
- 11.Hoffman JM, Gambhir SS (2007) Molecular imaging: the vision and opportunity for radiology in the future. Radiology 244:39–47 [DOI] [PubMed]
- 12.Leff DR, Warren OJ, Enfield LC et al (2008) Diffuse optical imaging of the healthy and diseased breast: a systematic review. Breast Cancer Res Treat 108(1):9–22 [DOI] [PubMed]
- 13.Intes X (2005) Time-domain optical mammography SoftScan: initial results. Acad Radiol 12:934–947 [DOI] [PubMed]
- 14.Rinneberg H, Grosenick D, Moesta KT et al (2005) Scanning time-domain optical mammography: detection and characterization of breast tumors in vivo. Technol Cancer Res Treat 4:483–496 [DOI] [PubMed]
- 15.Taroni P, Torricelli A, Spinelli L et al (2005) Time-resolved optical mammography between 637 and 985 nm: clinical study on the detection and identification of breast lesions. Phys Med Biol 50:2469–2488 [DOI] [PubMed]
- 16.Tromberg BJ, Cerussi A, Shah N et al (2005) Imaging in breast cancer: diffuse optics in breast cancer: detecting tumors in pre-menopausal women and monitoring neoadjuvant chemotherapy. Breast Cancer Res 7:279–285 [DOI] [PMC free article] [PubMed]
- 17.Zhu Q, Cronin EB, Currier AA et al (2005) Benign versus malignant breast masses: optical differentiation with US-guided optical imaging reconstruction. Radiology 237:57–66 [DOI] [PMC free article] [PubMed]
- 18.Chance B, Nioka S, Zhang J et al (2005) Breast cancer detection based on incremental biochemical and physiological properties of breast cancers: a six-year, two-site study. Acad Radiol 12:925–933 [DOI] [PubMed]
- 19.Floery D, Helbich TH, Riedl CC et al (2005) Characterization of benign and malignant breast lesions with computed tomography laser mammography (CTLM): initial experience. Invest Radiol 40:328–335 [DOI] [PubMed]
- 20.Gu X, Zhang Q, Bartlett M, Schutz L, Fajardo LL, Jiang H (2004) Differentiation of cysts from solid tumors in the breast with diffuse optical tomography. Acad Radiol 11:53–60 [DOI] [PubMed]
- 21.Ntziachristos V, Yodh AG, Schnall MD, Chance B (2002) MRI-guided diffuse optical spectroscopy of malignant and benign breast lesions. Neoplasia 4:347–354 [DOI] [PMC free article] [PubMed]
- 22.Bakker L, van der Mark MB, van Beek M et al. Optical Imaging of Breast Cancer. Biomedical Optics 2006 Technical Digest SH 56. Washington, DC., Optical Society of America
- 23.Bakker L, van der Mark MB, van Beek M et al. Optical fluorescence imaging of breast cancer. International Symposium on Biophotonics, Nanophotonics and Metamaterials 2006. IEEE conference proceedings 06EX1462, 23–25
- 24.Colak SB, van der Mark MB, ‘t Hooft GW, Hoogenraad JH, van der Linden ES, Kuijpers FA (1999) Clinical optical tomography and NIR spectroscopy for breast cancer detection. IEEE J Sel Topics Quantum Electron 5:1143–1158 [DOI]
- 25.Segelstein DJ (1981) The complex refractive index of water. MS thesis, University of Missouri-Kansas City
- 26.van Veen RL, Sterenborg HJ, Pifferi A, Torricelli A, Cubeddu R (2004) Determination of VIS-NIR absorption coefficients of mammalian fat, with time- and spatially resolved diffuse reflectance and transmission spectroscopy. OSA Annual BIOMED Topical Meeting [DOI] [PubMed]
- 27.Prahl S (1999) Optical absorption of hemoglobin. Available at: http://omlc.ogi.edu/spectra/hemoglobin
- 28.Bland JM, Altman DG (1986) Statistical methods for assessing agreement between two methods of clinical measurement. Lancet 1:307–310 [PubMed]
- 29.Arridge SR, Lionheart WR (1998) Nonuniqueness in diffusion-based optical tomography. Opt Lett 23:882–884 [DOI] [PubMed]
- 30.Boas DA, Brooks DH, Miller EL, DiMarzio CA, Kilmer ME (2001) Imaging the body with diffuse optical tomography. IEEE Signal Process Mag 18:57–75 [DOI]
- 31.Hilger I, Leistner Y, Berndt A et al (2004) Near-infrared fluorescence imaging of HER-2 protein over-expression in tumour cells. Eur Radiol 14:1124–1129 [DOI] [PubMed]
- 32.Montet X, Ntziachristos V, Grimm J, Weissleder R (2005) Tomographic fluorescence mapping of tumor targets. Cancer Res 65:6330–6336 [DOI] [PubMed]


