

Abstract
Furan is a liver toxicant and carcinogen in rodents. Based on these observations and the large potential for human exposure, furan has been classified as a possible human carcinogen. The mechanism of tumor induction by furan is unknown. However, the toxicity requires cytochrome P450 catalyzed oxidation of furan. The product of this oxidation, cis-2-butene-1,4-dial (BDA), reacts readily with glutathione, amino acids and DNA and is a bacterial mutagen in Ames assay strain TA104. Characterization of the urinary metabolites of furan is expected to provide information regarding the structure(s) of the reactive metabolite(s). Recently, several urinary metabolites have been identified. We reported the presence of a mono-glutathione-BDA reaction product, N-[4-carboxy-4-(3-mercapto-1H-pyrrol-1-yl)-1-oxobutyl]-L-cysteinylglycine cyclic sulfide. Three additional urinary metabolites of furan were also characterized: R-2-acetylamino-6-(2,5-dihydro-2-oxo-1H-pyrrol-1-yl)-1-hexanoic acid, N-acetyl-S-[1-(5-acetylamino-5-carboxypentyl)-1H-pyrrol-3-yl]-L-cysteine and its sulfoxide. It was postulated that these three metabolites are derived from degraded protein adducts. However, the possibility that these metabolites result from reaction of BDA with free lysine and/or cysteine was not ruled out. In this latter case, one might predict that the reaction of thiol-BDA with free lysine would not occur exclusively on the ε-amino group. Reaction of BDA with N-acetylcysteine or GSH in the presence of lysine indicated that both the α- and ε-amino groups of lysine can be modified by thiol-BDA. The N-acetylcysteine-BDA-N-acetyllysine urinary metabolites were solely linked through the ε-amino group of lysine. A GSH-BDA-lysine crosslink was a significant hepatocyte metabolite of furan. In this case, the major product resulted from reaction with the ε-amino group of lysine, however, small amounts of the α-amino reaction product were also observed. Western analysis of liver and hepatocyte protein extracts using anti-GSH antibody indicated that GSH was covalently linked to proteins in tissues or cells exposed to furan. Our data support the hypothesis that GSH-BDA can react with either free lysine or protein lysine groups. These data suggest that there are multiple pathways by which furan can modify cellular nucleophiles. In one pathway, BDA reacts directly with proteins to form cysteine-lysine reaction products. In another, BDA reacts with GSH to form GSH-BDA conjugates which then reacts with cellular nucleophiles like free lysine or lysine moieties in proteins. Both pathways will give rise to N-acetyl-S-[1-(5-acetylamino-5-carboxypentyl)-1H-pyrrol-3-yl]-L-cysteine. Given the abundance of these metabolites in urine of furan-treated rats, these pathways appear to be major pathways of furan biotransformation in vivo.
Keywords: furan, metabolism, stable isotope methods, capillary LC-MS, urinary metabolites, GSH, hepatocyte metabolites
INTRODUCTION
Furan is an important industrial compound that is used both as a solvent and as a synthetic intermediate (1). It is also present in the environment. It has been detected in many foods and beverages (2) as well as in smog, engine exhaust, wood smoke and cigarette smoke (1,3). The levels in food are estimated to range from 10 to 5000 μg/kg (4). The exhaled air from smokers contained up to 98 μg/h (5). In rodents, furan is toxic to liver and kidney and induces cholangiocarcinoma and hepatocellular neoplasms (6). Its human health effects are unknown. However, its toxicological properties, as well as the potential for significant human exposure, led the National Toxicology Program and the International Agency for Research on Cancer (IARC) to list furan as a possible human carcinogen (Group 2B) (1,5).
While the mechanistic details of furan-induced toxicity and carcinogenicity are unknown, experimental evidence indicated that metabolism plays a critical role in these processes. Furan is converted into a protein binding intermediate via a P450-dependent process both in vitro and in vivo (7,8). Its toxic effects are inhibited by P450 inhibitors such as 1-phenylimidazole and induced by acetone pretreatment (induction of CYP2E1), paralleling the effects of P450 inhibitors and P450 inducers on furan metabolism (9). The initial product of P450 catalyzed oxidation, cis-2-butene-1,4-dial (BDA), is a reactive molecule and could be responsible for the toxic and carcinogenic products of furan (10–12). BDA reacts readily with glutathione and amino acids (11,13). This metabolite also reacts with DNA and is mutagenic in the Ames assay (14–17). All these data suggest that BDA is a good candidate for the ultimate reactive metabolite(s) responsible for furan’s toxicities. However, it is possible that metabolites of BDA also contribute to the toxicological properties of this chemical.
Our understanding of furan metabolism is incomplete. Furan is extensively metabolized in rats (7). Forty percent of an 8 mg/kg dose of radiolabeled furan was eliminated in exhaled air as either unchanged furan (14%) or carbon dioxide (26%). The pathway to carbon dioxide is likely initiated by oxidation of furan to BDA (Scheme 1). In addition, a significant amount of radioactivity was excreted in urine (22%) and feces (20%). Recently, several urinary metabolites have been identified. We reported the presence of a BDA-glutathione reaction product, N-[4-carboxy-4-(3-mercapto-1H-pyrrol-1-yl)-1-oxobutyl]-L-cysteinylglycine cyclic sulfide (1, Scheme 1) in the urine of furan-treated rats (18). A downstream metabolite of this product, S-[1-(5-acetylamino-5-carboxypentyl)-1H-pyrrol-3-yl]methanethiol (2, Scheme 1) has also been identified (19). Three additional urinary metabolites of furan were also characterized: R-2-acetylamino-6-(2,5-dihydro-2-oxo-1H-pyrrol-1-yl)-1-hexanoic acid (3), N-acetyl-S-[1-(5-acetylamino-5-carboxypentyl)-1H-pyrrol-3-yl]-L-cysteine (4a) and its sulfoxide (5a) (19). Metabolite 3 results from the reaction of BDA with lysine whereas metabolites 4a and 5a result from the crosslinking of cysteine and lysine by BDA (13).
Scheme 1.

Identified pathways of furan metabolism.
It was postulated that these three metabolites are derived from degraded protein adducts (19). This is possible since a large percentage of an 8 mg/kg dose of [14C]furan becomes covalently bound to liver protein (7). However, these metabolites could also result from reaction of thiol-BDA with free lysine since the concentration of lysine is 0.5 mM in rat plasma and 0.3 μmol/g in rat liver (20). One might predict that the reaction of thiol-BDA with unbound lysine would not occur exclusively on the ε-amino group. Some reaction would be expected with the α-amino group, leading to the formation of S-[1-(5-amino-1-carboxypentyl)-1H-pyrrol-3-yl]-cysteine. Acetylation of this metabolite would generate N-acetyl-S-[1-(5-acetylamino-1-carboxypentyl)-1H-pyrrol-3-yl]-L-cysteine (4b). This possibility was not considered in the previous report (19).
To gain more information about the possible precursors to the cysteine-BDA-lysine crosslink metabolites in rat urine, we determined the regioselectivity of the reaction between BDA and free lysine in the presence of N-acetylcysteine or GSH in vitro. We then determined if both regioisomers of this reaction appear as metabolites in the urine of furan-treated rats or as furan metabolites in rat hepatocytes. As described below, we demonstrate that the lysine-derived metabolites of furan result primarily from reaction of a BDA-thiol conjugate with the epsilon nitrogen of lysine. In addition, we provide evidence that GSH is likely a major source of the cysteine in metabolites derived from cysteine-BDA-lysine crosslinks. Combined, these data strongly support a hypothesis in which GSH conjugates with BDA to form a reactive intermediate which further reacts with cellular nucleophiles.
Experimental Methods
Caution
BDA is toxic and mutagenic in cell systems. Furan is toxic and carcinogenic in laboratory animals. Both chemicals should be handled with proper safety equipment and precautions.
Chemicals
[13C4]Furan, BDA, 1, 4a and the bis-GSH-BDA conjugates and their metabolites were prepared as previously described (11,13,15,18,21). Furan and trifluoroacetic acid were purchased from Acros Organics (Pittsburgh, PA). Cocktail protease inhibitors were purchased from Sigma (St. Louis, MO). All other reagents were purchased from Aldrich Chemical (Milwaukee, WI) unless stated otherwise. All solvents used for HPLC were of chromatography grade.
Instrumentation
HPLC was carried out on a Shimadzu LC-10AD system coupled to a Shimadzu SCL-10A UV-Vis detector, using a Phenomenex (Torrence, CA) Synergi 4μ Hydro-RP column (250 × 10.00 mm, 4 micron) with a flow rate of 4 mL/min. Two different HPLC methods were employed. In Method 1, solvent A was 50 mM ammonium formate, pH 2.8, and solvent B was 50% acetonitrile in H2O. After 10 min at 100% A, the column was eluted with a 26 min linear gradient to 75% A, 25% B, followed by a 10 min linear gradient to 50% A, 50% B and a subsequent 4 min linear gradient to 100% B. In Method 2, solvent A was 20 mM ammonium acetate, pH 6.8, and solvent B was methanol with 5% water. The column was eluted with a linear gradient from 100% A to 50% A, 50% B over 30 min followed by a second linear gradient to 100% B over 20 min.
Collision-induced mass spectra of standards were obtained from an Agilent 1100 series LC/MSD Trap SL mass spectrometer operating in either positive or negative ion mode by direct infusion of the sample dissolved in 10 mM ammonium formate, pH 2.8, into the ion source. Helium was the nebulizing and drying gas (15 psi, 5 L/min) which had a temperature set at 200 °C. High resolution mass spectral data for the metabolites were obtained on a Thermo Ultra AM Triple Quadrupole mass spectrometer. High resolution mass spectral data for the synthetic standards were obtained on a Bruker BioTOF II mass spectrometer in the Department of Chemistry, University of Minnesota.
1H NMR, 13C NMR and 2D-NMR (COSY and HMQC) spectra were recorded on a Varian Inova spectrometer operating at 300, 500 or 600 MHz. Chemical shifts are reported in parts per million as referenced to the residual solvent peak.
N-Acetyl-S-[1-(5-acetylamino-5-carboxypentyl)-1H-pyrrol-3-yl]-L-cysteine sulfoxide, 5a
mCPBA (35.8 μmol) was added to a stirred solution of 4a (35.8 μmol) in methanoldichloromethane (1:1) at −78 °C. After 1 h, the reaction was warmed to room temperature. HPLC analysis with HPLC Method 1 demonstrated the presence of two major UV-absorbing products eluting at 34.8 min and 38.3 min. The products were isolated by semi-preparative HPLC. The organic solvent was removed under reduced pressure and the buffer salts were removed by solid phase extraction using Strata-X cartridges (Phenomenex, Torrance, CA). The compound eluting at 34.8 min was identified as N-acetyl-S-[1-(5-acetylamino-5-carboxypentyl)-1H-pyrrol-3-yl]-L-cysteine sulfoxide (5a). 1H NMR analysis showed the presence of two diastereomers in an 11:9 ratio. The major diastereomer: 1H NMR (600 MHz, CD3OD): δ 7.30 (s, 1H, H2′), 6.92-6.91 (m, 1H, H5′), 6.55-6.53 (m, 1H, H4′), 4.32-4.27 (m, 2H, Cys α-CH, Lys α-CH), 3.97-3.94 (m, 2H, Lys ε-CH2), 3.61-3.44 (m, 1H, Cys β-CHa), 3.43-3.38 (m, 1H, Cys β-CHb), 1.93 (s, 3H, CH3), 1.92 (s, 3H, CH3), 1.83-1.76 (m, 3H, Lys β-CHa, Lys δ-CH2), 1.70-1.63 (m, 1H, Lys β-CHb), 1.35-1.31(m, 2H, Lys γ-CH2). The minor diastereomer: 1H NMR (600 MHz, CD3OD): δ 7.30 (s, 1H, H2′), 6.89-6.88 (m, 1H, H5′), 6.52-6.51 (m, 1H, H4′), 4.32-4.27 (m, 2H, Cys α-CH, Lys α-CH), 3.97-3.94 (m, 2H, Lys ε-CH2), 3.61-3.44 (m, 1H, Cys β-CHa), 3.43-3.38 (m, 1H, Cys β-CHb), 1.93 (s, 3H, CH3), 1.92 (s, 3H, CH3), 1.83-1.76(m, 3H, Lys β-CHa, Lys δ-CH2), 1.70-1.63 (m, 1H, Lys β-CHb), 1.35-1.31(m, 2H, Lys γ-CH2). 13C NMR (150 MHz, CDCl3): δ 124.9, 124.0, 105.8, 57.5, 52.6, 49.8, 49.5, 31.1, 30.6, 22.6, 21.3. The mass spectral data are presented in Table 1.
Table 1.
Mass spectral data for the metabolites and standards.
| Compound | m/z | RT (min) | MS2 (fragment ions, m/z) | HRMS (measured) | HRMS (calculated) |
|---|---|---|---|---|---|
| Standard 1 | 356 | 28.8 | 338, 210 | 356.0894 (M+H)+ (18) | 356.0916 (M+H)+ |
| 1 from [12C4]furan | 356 | 28.9 | 338, 210 | n.d. | |
|
| |||||
| Standard 4a | 400 | 49.5 | 382, 364, 336, 295, 271 | 422.1356 (M+Na)+ | 422.1362 (M+Na)+ |
| 4a from [12C4]furan | 400 | 49.4 | 382, 364, 336, 295, 271 | 400.1532 (M+H)+ | 400.1537 (M+H)+ |
| 4a from [13C4]furan | 404 | 49.3 | 384, 368, 340, 299, 275 | n.d. | |
| Standard 4b | 400 | 45.1 | 384, 364, 340, 322, 295, 271, 253, 211 | n.d. | |
|
| |||||
| Standard 5a | 416 | 31.8 | 398, 380 339, 321, 269, 241, 239, 234, 223, 182 | 414.1343(M−H)− | 414.1340 (M−H)− |
| 5a from [12C4]furan | 416 | 31.9 | 398, 380, 339, 321, 269, 241, 239, 234, 223, 182, 134 | 416.1480 (M+H)+ | 416.1486 (M+H)+ |
| 5a from [13C4]furan | 420 | 31.6 | 402, 384, 343, 325, 273, 245, 243, 238, 227, 186, 138 | n.d. | |
| Standard 5b | 416 | 29.6 | 398, 380, 362, 339, 321, 293, 269, 239, 227, 210, 193, 178 | n.d. | |
|
| |||||
| Standard 6a | 358 | 36.6 | 340, 295,294, 229 | 356.1282 (M−H)− | 356.1286 (M−H)− |
| 6a from [12C4]furan | 358 | 36.5 | 340, 295,294, 229 | n.d. | |
| Standard 6b | 358 | 30.9 | 340, 298, 253, 229, 211, 197 | n.d. | |
|
| |||||
| Standard 7a | 502 | 28.5 | 484, 373, 356, 227 | 502.1954 (M+H)+ | 502.1966 (M+H)+ |
| 7a from [12C4]furan | 502 | 29.1 | 484, 373, 356, 227 | 502.1962 (M+H)+ | 502.1966 (M+H)+ |
|
| |||||
| Standard 7b | 502 | 25.0 | 484, 373, 356, 227 | n.d. | |
| Standard 9a | 502 | 25.1 | 427, 373, 356, 227 | n.d. | |
| metabolites from [12C4]furan | 502 | 25.1 | 484, 427, 373, 356, 227 | n.d. | |
|
| |||||
| Standard 9b | 502 | 26.2 | 427, 373, 356, 227 | 502.1600 (M+H)+ | 502.1602 M+H)+ |
| 9b from [12C4]furan | 502 | 26.1 | 427, 373, 356, 227 | 502.1598 (M+H)+ | 502.1602 M+H)+ |
|
| |||||
| Standard 10 | 544 | 45.4 | 469, 415, 398, 269, 241 | 544.2066 | 544.2072 (M+H+) |
| 10 from [12C4]furan | 544 | 45.9 | 469, 415, 398, 269, 241 | 544.2042 | 544.2072 (M+H+) |
n.d. = not determined
The compound eluting at 38.3 min was characterized as N-acetyl-S-[1-(5-acetylamino-5-carboxypentyl)-1H-pyrrol-3-yl]-L-cysteine sulfone. 1H NMR (600 MHz, DMSO-d6): δ 7.84 (d, 1H, J=8.4 Hz, NH), 7.66 (d, 1H, J=7.2 Hz, NH), 7.28 (s, 1H, H2′), 6.83 (s, 1H, H5′), 6.24 (s, 1H, H4′), 4.21 (t, 1H, J=9.0 Hz, Cys α-CH), 3.97-3.94 (m, 1H, H5), 3.90-3.84 (m, 2H, H1), 3.55 (d, 1H, J=13.2 Hz, Cys β-CHa), 3.29 (dd, 1H, J=10.2, 15.0 Hz, Cys β-CHb), 1.77 (s, 3H, COCH3), 1.63 (s, 3H, COCH3), 1.60-1.56 (m, 2H, H2), 1.53-1.48 (m, 2H, H4), 1.14-1.08 (m, 2H, H3); 13C NMR (150 MHz, DMSO-d6): δ 126.2, 123.1, 109.1, 59.6, 53.9, 50.6, 49.7, 32.1, 30.8, 23.5, 22.7. ESI-MS m/z 432 [M+H], 414, 390, 344, 327, 285.
Derivatization of 5a with acidic methanol
Compound 5a (5 mg, 12 μmol) or HPLC fractions of furan-treated urine containing 5a were dissolved in 1 mL of 3N methanolic HCl solution. The reaction was incubated in water bath (50 °C) for 20 min. HPLC coupled with MS analysis of reaction mixture indicated the formation of multiple products with the major product having a retention time of 43.7 min. The compound was purified by semi-preparative HPLC and identified as N-acetyl-S-[1-(5-acetylamino-6-oxo-6-methoxyhexyl)-1H-(2-methoxy)pyrrol-3-yl]-L-cysteine methyl ester (8). 1H NMR (500 MHz, CDCl3): δ 6.28 (d, 1H, J=2.5 Hz, H4′), 6.27 (t, 2H, J=6.0 Hz, NH), 5.29 (d, 1H, J=2.0 Hz, H5′), 4.78-4.75 (m, 1H, Cys α-CH), 4.63-4.59 (m, 1H, H5), 3.81-3.68 (m, 2H, H1), 3.79 (s, 3H, OCH3), 3.75 (s, 3H, OCH3), 3.67 (s, 3H, OCH3), 3.11-3.07 (m, 1H, Cys β-CHa), 3.01-2.98 (m, 1H, Cys β-CHb), 2.02 (s, 3H, COCH3), 1.99 (s, 3H, COCH3), 1.82-1.65 (m, 4H, H2 and H4), 1.34-1.24 (m, 2H, H3). HRMS C20H31N3NaO7S [M+Na] calculated 480.1771, observed 480.1775.
Reaction of L-lysine and N-acetyl-L-cysteine with BDA
N-Acetyl-L-cysteine (130 μmol) and cis-2-butene-1,4-dial (130 μmol) were incubated in 1 M sodium phosphate buffer, pH 7.4, at 37 °C for 15 min before adding L-lysine (130 μmol; total volume: 1.5 mL). The reaction was shaken for 15 hours. HPLC analysis with HPLC Method 1 demonstrated the presence of two major UV-absorbing products eluting at 32.8 min and 40.1 min in a ratio of 2:1. A similar ratio was observed when the concentration of all three reactants was 2 mM. The first peak was identified as N-acetyl-S-[1-(5-amino-1-carboxypentyl)-1H-pyrrol-3-yl]-L-cysteine (6b). 1H NMR (600 MHz, DMSO-d6): δ 7.83 (d, 1H, J=8.0 Hz, NH), 6.87 (s, 1H, H2′), 6.73 (s, 1H, H5′), 5.99 (s, 1H, H4′), 4.39-4.36 (m, 1H, H1), 4.11-4.06 (m, 1H, Cys α-CH), 2.92 (dd, 1H, J=4.5, 13.5 Hz, Cys β-CHa), 2.74 (dd, 1H, J=8.0, 13.5 Hz, Cys β-CHb), 2.68-2.67 (m, 2H, H5), 1.97-1.95 (m, 1H, H2a), 1.85 (s, 3H, COCH3), 1.82-1.78 (m, 1H, H2b), 1.50-1.36 (m, 2H, H4), 1.23-1.09 (m, 2H, H3); 13C NMR (150 MHz, DMSO-d6): δ 126.2, 122.2, 113.7, 54.6, 53.6, 49.5, 39.9, 31.2, 23.4, 22.6. The mass spectral data are presented in Table 1.
The second peak was identified as N-acetyl-S-[1-(5-amino-5-carboxypentyl)-1H-pyrrol-3-yl]-L-cysteine (6a). 1H NMR (500 MHz, DMSO-d6): δ 7.99 (d, 1H, J=7.8 Hz, NH), 6.79 (s, 1H, H2′), 6.67 (s, 1H, H5′), 5.97 (s, 1H, H4′), 4.09-4.06 (m, 1H, Cys α-CH), 3.78-3.76 (m, 1H, H5), 3.18-3.16 (m, 2H, H1), 2.94 (dd, 1H, J=5.4, 13.2 Hz, Cys β-CHa), 2.65 (dd, 1H, J=7.8, 13.2 Hz, Cys β-CHb), 1.80 (s, 3H), 1.63-1.55 (m, 4H, H2 and H4), 1.22-1.13 (m, 2H, H3); 13C NMR (150 MHz, DMSO-d6): δ 126.0, 122.1, 112.9, 64.2, 54.0, 40.3, 39.7, 33.5, 27.6, 24.0, 23.5. The mass spectral data are presented in Table 1.
Reaction of Nε-acetyl-L-lysine and N-acetyl-L-cysteine with BDA
N-Acetyl-L-cysteine (130 μmol) and cis-2-butene-1,4-dial (130 μmol) were incubated in 1.5 mL of 1 M sodium phosphate buffer, pH 7.4, at 37 °C for 15 min before adding Nε-acetyl-L-lysine (130 μmol). The reaction was kept shaking for 15 hours. HPLC analysis with HPLC Method 1 demonstrated the presence of one major UV-absorbing product eluting at 46.0 min. After preparative isolation of the reaction product by HPLC, the organic solvent was removed under reduced pressure and the buffer salts were removed by solid phase extraction using a Strata-X cartridge. The product was identified as N-acetyl-S-[1-(5-acetylamino-1-carboxypentyl)-1H-pyrrol-3-yl]-L-cysteine (4b). 1H NMR (600 MHz, CDCl3): δ 7.93-7.92 (m, 1H, NH), 7.76 (s, 1H, NH), 6.84 (s, 1H, H2′), 6.72 (d, 1H, J=1.8 Hz, H5′), 5.98 (s, 1H, H4′), 4.37-4.34 (m, 1H, H1), 4.18-4.16 (m, 1H, Cys α-CH), 2.91-2.89 (m, 3H, H5, Cys β-CHa), 2.70 (t, 1H, J=9.6 Hz,, Cys β-CHb), 1.93-1.89 (m, 2H, H2), 1.83 (s, 3H, COCH3), 1.72 (s, 3H, COCH3), 1.35-1.28 (m, 2H, H4), 1.09-0.99 (m, 2H, H3); 13C NMR (75 MHz, DMSO-d6): δ 173.7, 173.5, 169.7, 165.3, 125.2, 122.0, 112.7, 110.0, 64.0, 53.2, 40.1, 38.9, 33.3, 29.3, 23.9, 23.3. The mass spectral data are presented in Table 1.
Air oxidation of 4b resulted in the formation of N-acetyl-S-[1-(5-acetylamino-1-carboxypentyl)-1H-pyrrol-3-yl]-L-cysteine sulfoxide (5b) as indicated by the presence of a peak in the LC mass chromatogram at m/z 416 eluting at 45.1 min. The mass spectral data are in Table 1.
Reactions between GSH, BDA and amino acids
L-Lysine, glutamine or Nα-acetyl-L-lysine (67.5 μmol) and glutathione (67.5 μmol) were added to a solution of cis-2-butene-1,4-dial (67.5 μmol) in 1 M sodium phosphate, pH 7.4 (total volume of 2 mL). The reactions were performed at high concentrations to obtain sufficient material for chemical characterization. The reaction was incubated at 37 °C for 2 hours. Products were separated by semi-preparative HPLC employing HPLC Method 1. The solvent was removed under reduced pressure and the buffer salts were removed by solid phase extraction using Strata-X cartridges.
When the reaction was performed with lysine, the resulting reaction mixture was complex. However, there were only two UV-absorbing products which had molecular ions at m/z 502, consistent with the cross link of L-lysine to GSH via BDA. The compound eluting at 28.0 min was identified as S-[1-(5-amino-1-carboxypentyl)-1H-pyrrol-3-yl]-glutathione (7b). 1H NMR (600 MHz, D2O): δ 6.79 (s, 1H, H2′), 6.70 (s, 1H, H5′), 6.08 (d, 1H, J = 2.5 Hz,, H4′), 4.43-4.35 (m, 1H, H1), 4.22-4.14 (m, 1H, Cys α-CH), 3.68-3.62 (m, 1H, Glu α-CH), 3.62(s, 2H, Gly α-CH2), 3.05-2.99 (m, 1H, Cys β-CHa), 2.82-2.75 (m, 2H, H5), 2.74-2.68 (m, 1H, Cys β-CHb), 2.43-2.30 (m, 2H, Glu γ-CH2), 2.04-1.98 (m, 2H, Glu β-CH2), 1.98-1.93 (m, 1H, H2a), 1.89-1.80 (m, 1H, H2b), 1.57-1.43 (m, 2H, H4), 1.21-1.09 (m, 1H, H3a), 1.07-1.03 (m, 1H, H3b); 13C NMR (150 MHz, D2O): δ 125.8, 122.9, 113.3, 64.7, 54.4, 53.6, 42.9, 39.8, 38.9, 32.1, 31.6, 26.5, 26.4, 22.8. The mass spectral data are presented in Table 1.
The compound eluted at 32.7 min was characterized as S-[1-(5-amino-5-carboxypentyl)-1H-pyrrol-3-yl]-glutathione (7a). 1H NMR (600 MHz, D2O): δ 6.90 (s, 1H, H2′), 6.72 (s, 1H, H5′), 6.11 (s, 1H, H4′), 4.22-4.18 (m, 1H, Cys α-CH), 3.82-3.73 (m, 2H, H1), 3.64-3.60 (m, 1H, Glu α-CH), 3.60-3.58 (m, 2H, Gly α-CH2), 3.58-3.53 (m, 1H, H5), 3.06-2.96 (m, 1H, Cys β-CHa), 2.78-2.71 (m, 1H, Cys β-CHb), 2.43-2.30 (m, 2H, γ Glu-CH2), 2.04-1.95 (m, 2H, Glu β-CH2), 1.76-1.68 (m, 2H, H4), 1.66-1.61 (m, 2H, H2), 1.23-1.09 (m, 2H, H3); 13C NMR (150 MHz, D2O): δ 127.0, 125.7, 115.7, 56.0, 51.7, 56.9, 45.6, 57.4, 46.4, 34.2, 29.0, 32.8, 33.0, 24.4. The mass spectral data are presented in Table 1.
The GSH-BDA-glutamine reaction mixture was similarly complex. There were two UV-absorbing products which had the expected molecular ion, m/z 502, for the GSH-BDA-glutamine reaction products. These products eluted at 29.1 min and 29.7 min displayed a ratio of 1:14 when HPLC Method 1 was employed. The major isomer that eluted at 29.7 min was identified as S-[1-(4-amino-1-carboxy-4-oxobuty)-1H-pyrrol-3-yl]-glutathione (9b). 1H NMR (500 MHz, D2O): δ 6.74 (s, 1H, H2′), 6.64 (d, 1H, J = 2.5 Hz, H5′), 6.04 (d, 1H, J = 2.5 Hz, H4′), 4.41 (dd, 1H, J = 4.5, 10.5 Hz, H1), 4.17 (dd, 1H, J = 4.5, 10 Hz, Cys α-CH), 3.65 (s, 2H, Gly α-CH), 3.57 (t, 1H, J = 6.5 Hz, Glu α-CH), 2.95 (dd, 1H, J = 4.0, 14.0 Hz, Cys β-CHa), 2.67 (dd, 1H, J = 10.0, 14.0 Hz, Cys β-CHb), 2.35-2.29 (m, 1H, H3a), 2.29-2.25 (m, 1H, H3b), 2.23-2.17 (m, 1H, Glu γ-CHa), 2.08-2.04 (m, 1H, Glu γ-CHb), 2.03-1.99 (m, 1H, H2a), 1.98-1.96 (m, 1H, H2b), 1.97-1.95 (m, 2H, Glu β-CH2). 13C NMR (125 MHz, D2O): δ 122.3, 113.1, 63.0, 54.1, 53.3, 42.1, 37.9, 31.7, 31.4, 28.3, 26.3. The mass spectral data are presented in Table 1.
The minor isomer eluting at 29.1 min was tentatively identified as S-[1-(4-amino-4-carboxy-1-oxobutyl)-1H-pyrrol-3-yl]-glutathione (9a). NMR data were not obtained since it was difficult to obtain sufficient amounts of this isomer without significant amounts of the major isomer, 9b. The mass spectral data are presented in Table 1.
A single compound with a molecular ion of m/z 544 was observed in the GSH-BDA-Nα-acetyllysine reaction mixture. This compound eluted at 45.5 min when HPLC Method 1 was employed. This product was identified as S-[1-[5-(acetylamino)-5-carboxypentyl]-1H-pyrrol-3-yl]-glutathione (10). 1H NMR (500 MHz, D2O): δ 6.80 (s, 1H, H2′), 6.71 (br s, 1H, H5′), 6.11 (br s, 1H, H4′), 4.31-4.26 (m, 1H, Cys α-CH), 4.07-4.01 (m, 1H, H5), 3.85-3.76 (m, 2H, H1), 3.69-3.66 (m, 1H, Glu α-CH), 3.64 (s, 2H, Gly α-CH), 3.08-3.02 (m, 1H, Cys β-CHa), 2.85-2.77 (m, 1H, Cys β-CHb), 2.46-2.38 (m, 2H, Glu γ-CH2), 2.09-2.02 (m, 2H, Glu β-CH2), 1.88 (s, 3H, COCH3), 1.73-1.61 (m, 3H, H2 and H4a), 1.61-1.51 (m, 1H, H4b), 1.23-1.11 (m, 2H, H3). The mass spectral data are presented in Table 1.
Subsequent GSH-BDA-lysine reactions were performed with lower, more physiologically relevant concentrations of reactants (20): 0.5 or 2 mM L-lysine, 2 mM GSH and 100 μM BDA in a pH 7.4 buffer or RPMI 1640 media with or without 10 mM HEPES, pH 7.3 (total volume of 1 mL). These buffers included 6.17, 10, 100 or 1000 mM sodium phosphate, Tris-HCl or HEPES. The reaction was incubated at 37 °C for 2 hours and then analyzed using LC-MS Method 1.
Animal Studies
F344 male rats (200-300 g) were purchased from Charles River Laboratories (Kingston, NY). Groups of three rats were treated with 8 mg/kg [12C4]- or [13C4]furan or 40 mg/kg [12C4]furan in 5 mL/kg corn oil by gavage. Control group received only corn oil. Immediately after treatment, rats were transferred to individual metabolism cages. Urine was collected on dry ice for 24 hours and stored at −80 °C. The rats were euthanized with CO2 and tissues were removed. The livers were rinsed twice in ice cold 5 mM sodium phosphate, pH 7.4, containing 0.25 M sucrose and 1 mM desferroximine. The livers were then minced in 30 mL of the same ice cold buffer and homogenized while on ice. The homogenate was transferred in 7.5 mL aliquots to 20 mL centrifuge tubes. Each aliquot was diluted to 18 mL with buffer and centrifuged at 1500 × g for 10 min at 0 °C. The resulting supernatant was further centrifuged at 8500 × g for 10 min at 0 °C. The subsequent supernatant (liver S9) was removed and stored at −80 °C.
Hepatocyte Incubations
Freshly isolated hepatocytes were prepared from Sprague-Dawley or F344 rats according to published methods (22). The viability of the cells was greater than 85%. Furan’s volatility required that the hepatocyte incubations be performed in sealed screw-capped 25 mL Erlenmeyer flasks as previously reported (23). The cells were suspended at a concentration of 2 × 10⁶ cells/mL in RPMI Media 1640, containing 10 mM HEPES, pH 7.3. In some cases, the media was supplemented with 2 mM glutamine or 0.5 mM [4,4,5,5-2H4]-L-lysine (Cambridge Isotope Laboratories, Inc., Andover, MA). After a 10 min pre-incubation period at 37 °C in an atmosphere of 5% CO2, the flasks were capped tightly. A solution of furan was added with a syringe through a septum to a final concentration of 100 μM. Controls were performed in the absence of furan or in the presence of 50 μM SKF-525A (Sigma, St. Louis, MO) or 200 μM 1-phenylimidazole. The mixtures were then incubated at 37 °C with gentle shaking. After 4 h, the mixture was centrifuged at 3000 rpm for 5 minutes. The supernatant was removed and stored at −20 °C for LC-MS/MS analysis and the cell pellets were flash frozen and stored at −80° C. Incubations were performed in duplicate and were repeated with different hepatocytes preparations.
LC-MS Analysis of Urine, Hepatocyte Media or in vitro Reaction Mixtures
Urine was acidified with TFA to a final concentration of 2%, centrifuged to remove any particulate matter and filtered through a 0.45 μm syringe filter. The hepatocyte medium was analyzed directly. In some cases, the urine was treated with tris-(carboxyethyl)phosphine (Strem Chemicals, Newburyport, MA) to reduce any disulfide bonds (11,24,25).
LC-MS/MS analyses of urine, hepatocyte extracts or in vitro reaction mixtures were conducted with an Agilent (Palo Alto, CA) Zorbax SB-C18 column (5 μm, 150 × 0.5 mm) at a flow rate of 15 μL/min. The column was eluted with the gradient described in Method 1, substituting 10 mM ammonium formate, pH 2.8, for solvent A. In some cases, the gradient described in Method 2 was employed. The HPLC was coupled to an Agilent 1100 series LC/MSD Trap SL mass spectrometer operating in either positive or negative ion mode. Helium was the nebulizing and drying gas (15 psi, 5 L/min) which had a temperature set at 200 °C. Initial analyses were performed with the mass spectrometer set to full scanning mode with a scan range of 100–750 m/z. Urine from individual animals treated with [12C4]- or [13C4]furan were analyzed separately as well as a 1:1 mixture. The resulting data were searched for compounds that were present in the furan exposed samples and absent in the samples from control rats. The urinary metabolites were confirmed as furan-derived by demonstrating that the mass of the metabolites were shifted by four amu in the urine from [13C4]furan-treated rats relative to that from [12C4]furan-treated rats. The samples were then reanalyzed with the mass spectrometer set in the autoMSn mode to obtain fragmentation patterns for each of the metabolites.
The entire volume of urine from one furan-treated rat was treated with TFA as described above (total volume = ~4 mL), filtered and fractionated by HPLC. The urinary metabolites were eluted from a Phenomenex (Torrance, CA) Bondclone semi-prep scale column (250 × 10 mm, 10 micron) with 50 mM ammonium formate, pH 2.8. A 10 min isocratic period was followed by a 40 min linear gradient to 37.5 mM ammonium formate, pH 2.8, containing 12.5% acetonitrile and then a 10 min gradient to water containing 50% acetonitrile (flow rate = 4 mL/min). The UV absorbance was monitored at 254 nm. The fraction containing 5a was used to obtain HRMS information as well as to perform the derivatization with acidic methanol.
To more accurately determine the ratio of 7a and 7b in the hepatocyte extracts or reaction mixtures, LC-MS/MS analyses were conducted on a Nano Acquity UPLC pump (Waters, Milford, MA) coupled to a Finnigan TSQ Quantum Ultra AM mass spectrometer (Thermo Electron, San Jose, CA) operating in positive mode. The mixtures were separated at a flow rate of 12.5 μL/min. The Phenomenex (Torrence, CA) Synergi hydro-RP 80A column (4 μm, 250 × 0.5 mm) was eluted with Method 1 gradient, substituting 10 mM ammonium formate, pH 2.8, for solvent A. Selected reaction monitoring (neutral loss 129) was performed to determine the relative amount of 7a to 7b (m/z 502 to m/z 373) or [2H4]7a to [2H4]7b (m/z 506 to m/z 377).
Cell extracts
The pelleted hepatocytes were reconstituted in 200 μL of ice cold lysis buffer (50 mM sodium phosphate, pH 7.4, containing 0.25% SDS, 30% glycerol, and 0.5% Triton X-100) with 5 μL/mL cocktail protease inhibitor. The cells were homogenized in microtissue grinders and the resulting solution was stored at −20 °C for Western analysis.
Western Analysis
All proteins concentrations were determined by means of a Bradford assay with BSA standard. Prior to loading on the gel, tissue or cell extracts (50 μg protein, volume range: 10–50 μL) were heated for 10 min at 95 °C in 62.5 mM Tris-HCl, pH 6.8, containing 1.5% SDS, 7.5% glycerol, 0.01% bromophenol blue in the presence or absence of 75 mM DTT (dithiothreitol). In some cases, samples were heated in the presence of 50 mM DTT for 10 min at 95 °C prior to the addition of the solution containing SDS, glycerol, DTT and bromophenol blue buffer (final DTT concentration: 135 mM). DTT was included to remove any protein-GSH mixed disulfide bonds. Protein solutions (50 μg) were loaded on a 10% 1.5mm SDS-PAGE gel and run at 200 Volts until the dye ran off the gel (about 45 minutes). Proteins bands were then electroblotted on nitrocellulose membranes (300 mA, 60 min) with 25 mM Tris-base containing 192 mM glycine and 20% methanol in a Mini-Trans Blot Cell (Bio-Rad, Hercules, CA). The membranes were blocked overnight in phosphate buffered saline containing 5% dry nonfat milk and 0.2% Tween 20 with shaking at 4 °C. Membranes were then reacted with a 1:1000 dilution of rabbit anti-GSH antibody (Virogen, Watertown, MA) for 1 h at room temperature. After washing the membranes three times for 5 min each with phosphate buffered saline containing 0.2% Tween 20 (PBST), the membranes were incubated for 1 hr with a 1:20,000 dilution of goat anti-rabbit pAb to MSIgG (HRP) secondary antibody (Abcam, Cambridge, MA). The membranes were then washed three times with PBST prior to development with Super Signal West Pico chemiluminescent substrate (Thermo Scientifc, Rockford, IL).
RESULTS
Regioselectivity of reaction of BDA with lysine and N-acetylcysteine/GSH
BDA was combined with equal molar amounts of L-lysine and N-acetyl-L-cysteine or GSH in 1 M sodium phosphate, pH 7.4. HPLC analysis of the reaction mixture indicated the formation of multiple products (Figure 1). Mass spectral analysis was employed to determine which peaks were associated with the expected thiol-BDA-lysine cross-links. Two peaks with the appropriate molecular ion (m/z 358) for the expected N-acetylcysteine-BDA-lysine reaction products were observed in the BDA-lysine-N-acetylcysteine reaction mixture in a ratio of 2:1 (n = 5; retention times: 32.8 and 39.9 min; Figure 1A). The relative ratio of reaction products was independent of reactant concentration. Preparative isolation and characterization by NMR analysis indicated that the peak that elutes at 32.8 min incorporates the lysinyl α-amino group as the pyrrole amino group (N-acetyl-S-[1-(5-amino-1-carboxypentyl)-1H-pyrrol-3-yl]-L-cysteine, 6b) whereas the compound that elutes at 39.9 min incorporates the ε-amino group as the pyrrole amino group (N-acetyl-S-[1-(5-amino-5-carboxypentyl)-1H-pyrrol-3-yl]-L-cysteine, 6a).
Figure 1.

HPLC trace of lysine incubation with BDA and N-acetylcysteine (A) or GSH (B), monitoring at 254 nm. GS = glutathione.
Similarly, there were two compounds in the GSH-BDA-lysine reaction mixture (retention times of 28.0 and 32.7 min) with the expected molecule ion of m/z 502 for the GSH-BDA-lysine reaction products in a ratio of ~1:1 (Figure 1B, Table 2). As with N-acetylcysteine, the relative ratio of GSH-BDA-lysine reaction products was not strongly influenced by the concentration of the reactants (Table 2). Preparative isolation and characterization of the reaction products indicated that the earlier eluting compound is the product resulting from crosslinkage of GSH-BDA with the α-amino group of lysine (S-[1-(5-amino-1-carboxypentyl)-1H-pyrrol-3-yl]-glutathione, 7b) and the later eluting compound has lysine crosslinked to GSH-BDA through the ε-amino group (S-[1-(5-amino-5-carboxypentyl)-1H-pyrrol-3-yl]-glutathione, 7a). Therefore, independent of the thiol, the α-amino group of lysine is equally or more reactive with thiol-BDA conjugates than the ε-amino group in 1 M sodium phosphate, pH 7.4.
Table 2.
Ratio of 7b to 7a in in vitro reactions and media from furan-exposed hepatocytes.
| Reaction conditions | α/ε (7b/7a)a | ||
|---|---|---|---|
| Equal amounts of GSH, BDA and lysine in 1 M phosphate, PH 7.4b | m/z 502 | n = 3 | 1.3 ± 0.3 |
|
| |||
| 2 mM GSH + 0.1 mM BDA + 2 mM lysine in 1 M phosphate, PH 7.4 | m/z 502 | n = 4 | 0.914 ± 0.186 |
| 2 mm GSH + 0.1 mm BDA + 2 mm lysine in media containing HEPESb | m/z 502 | n = 3 | 0.154 ± 0.013 |
| 2 mM GSH + 0.1 mM BDA in media containing HEPESc | m/z 502 | n = 2 | 0.135, 0.178 |
| Hepatocytes | m/z 502 | n = 4 | 0.096 ± 0.008 |
| Hepatocytes with media containing 0.5 mM [4,4,5,5-2H4]-L-lysine | m/z 506 | n = 2 | 0.234, 0.237 |
| Hepatocytes time course | |||
| 1 h | m/z 502 | n = 3 | 0.167 ± .016 |
| 2 h | m/z 502 | n = 3 | 0.115 ± 0.014 |
| 4 h | m/z 502 | n = 4 | 0.083 ± 0.021 |
Relative peak areas were determined by LC-MS or LC-MS/MS selected reaction monitoring as described in Experimental Methods.
Reactions performed with 0.1, 0.5 or 33.75 mM GSH, BDA, and lysine
Media contains 0.2 mM lysine
When the reaction was conducted in RPMI 1640 media, the ratio of 7b to 7a dropped to 0.155 (Table 2). This ratio was independent of the lysine concentration (Table 2). These observations indicate that the ε-amino reaction product is favored in the hepatocyte media. Further investigations demonstrated that the concentration of sodium phosphate might influence the relative reaction rate since the ratio of 7b to 7a was 0.3 when the reaction was performed in 6.17 mM sodium phosphate, pH 7.4, the concentration of sodium phosphate in RPMI media. Similar reactions in Tris or HEPES, pH 7.4, generated an α/ε ratio of ~0.3 as well. These ratios were not influenced by Tris or HEPES concentrations, contrasting with the sodium phosphate results. The mechanism by which sodium phosphate is influencing the regioselectivity of this reaction is not clear. The preference for reaction of GSH-BDA with the ε-amino group of lysine is under investigation. While the pKa of the α-amino group is more than 1 unit lower than that of the ε-amino group (9.2 vs 10.8) (26), preliminary molecular modeling studies indicate that the ε-reaction product is thermodynamically more stable.1
Regiochemistry of the urinary metabolites of furan
Two metabolites, one with a molecular weight 399 (4a) and a second with a molecular weight 415 (5a) were identified in the urine of furan-treated rats (19). These metabolites were assigned the following structures: 4a as N-acetyl-S-[1-(5-acetylamino-5-carboxypentyl)-1H-pyrrol- 3-yl]-L-cysteine and 5a as its sulfoxide. Chemical characterization consisted of co-elution of the metabolite with the corresponding standards and MS analysis. However, the authors did not confirm that N-acetylcysteine was linked to the ε-amino group of lysine via BDA; it is possible that the α- and ε-substituted metabolites co-elute with one another under the reported HPLC conditions. Therefore, we prepared both possible regioisomers of the N-acetylcysteine-BDA-lysine crosslinks 4a and 4b by reacting Nα-acetyl-L-lysine or Nε-acetyl-L-lysine, respectively, with equal molar amounts of BDA and N-acetyl-L-cysteine according to published methods (13). The products were confirmed by NMR and MS analysis. MS analysis of the two isomer demonstrated that they were similar with the exception of three ions in the mass spectrum of 4b at m/z 211, 322 and 253 (Table 1, Supplemental Figure 1).
The metabolite with a molecular ion of 400 amu had a similar retention time as standard 4a (49 min) but not 4b (45 min, Figure 2). There were no significant levels of 4b detected in the urine from furan-treated rats. In addition, the collision induced mass spectrum of the metabolite was identical to 4a (Table 1, Supplemental Figure 1). The metabolite co-eluted with 4a in two different HPLC systems (data not shown). Further support for the identity of this furan metabolite was obtained by high resolution mass spectral analysis (Table 1). There was also a smaller peak with m/z 400 that eluted immediately after 4a in the urine. This smaller peak is presumably the 2-substituted compound as previously reported (13).
Figure 2.
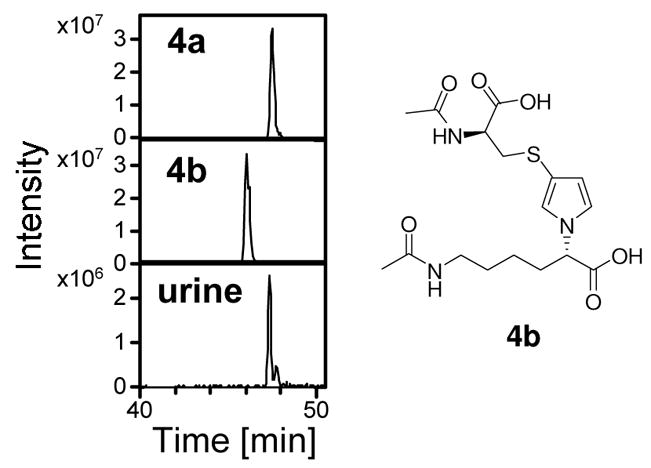
Extracted chromatograms at 400 amu for the standards 4a and 4b as well as for urine from [12C4]furan-treated rats.
Oxidation of compounds 4a and 4b generated compounds 5a and 5b, respectively. NMR analysis of 5a indicated that the oxidation had occurred on the sulfur atom as demonstrated by the 0.5 ppm downfield shift of the N-acetylcysteinyl β-methylene protons of 5a as compared to those observed in compound 4a. On the other hand, the methylene protons adjacent to the pyrrole nitrogen had the same chemical shift (3.85 ppm) for both compounds 4a and 5a. Furthermore, the mass spectra of 5a and 5b have a fragment ion at m/z 239, which is consistent with the loss of N-acetylcysteine sulfoxide (M+H+ −177). The mass spectra of 5a and 5b had similar fragment ions but the intensity of these ions was significantly different between the two compounds (Table 1, Supplemental Figure 2). The other metabolite (m/z 416) co-eluted with 5a not 5b (Figure 3). There were no detectable levels of 5b in the urine. High resolution mass spectral analysis of the metabolite indicates that the exact mass of this metabolite is within 5 ppm of the calculated exact mass for the proposed structure (Table 1).
Figure 3.
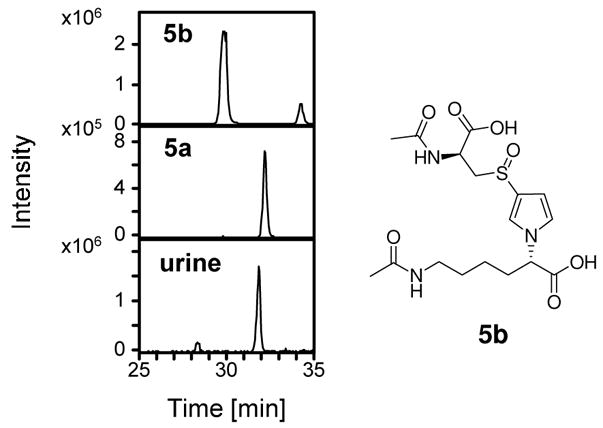
Extracted chromatograms at 416 amu for the standards 5a and 5b as well as for urine from [12C4]furan-treated rats.
When 5a was incubated in 3 N methanolic HCl at 50 °C for 10 min, the major reaction product had a molecular ion at 458 amu, indicating the addition of three methyl groups. Esterification of the N-acetylcysteine and the N-acetyllysine moieties was expected. The addition of a third methyl group was initially unexpected. 1H NMR analysis of this product confirmed the presence of three singlet methoxy groups at 3.79, 3.75 and 3.67 ppm. The NMR spectrum indicated that one of the pyrrole protons was missing. The two remaining aromatic protons resonated as doublets at 6.28 and 5.29 ppm and were assigned to the pyrrole ring protons C4 and C5, respectively, since a COSY experiment exhibited a cross peak between those two resonances. These data support the formation of two methyl esters and the presence of a third methoxy group at the 2-position of the pyrrole ring. Therefore, the reaction of 5a in 3 N methanolic HCL is N-acetyl-S-[1-(5-acetylamino-6-oxo-6-methoxyhexyl)-1H-(2- methoxy)pyrrol-3-yl]-L-cysteine methyl ester (8, Scheme 2). A proposed mechanism for the reaction of methanol with the 2-position of the pyrrole ring is shown in Scheme 2. This derivatization reaction was employed to confirm the structure of the urinary metabolite. The semipurified metabolite underwent a similar derivatization reaction, confirming its structure as 5a (Supplemental Figure 3).
Scheme 2.

Proposed mechanism for the addition of methanol to the 2-pyrrole position of 5a.
Kellert et al reported the presence of 4a and 5a in the urine of untreated animals when analyzing the urine by multiple reaction monitoring in negative ion mode (m/z 398 and 414, respectively) (19). We also observed the presence of endogenous compounds in the control animals which had the same nominal masses and similar retention times as 4a and 5a. We analyzed the urine from [13C4]furan treated animals to determine if these endogenous compounds had identical retention times to the metabolite derived from furan. We were able to separate the endogenous compounds from the [13C4]metabolites 4a and 5a by lengthening the HPLC gradient (Figure 4); [12C4]- and [13C4]labeled 4a have identical retention times when equal amounts of urine from [12C4]- and [13C4]furan-treated animals are mixed prior to LC-MS/MS analysis (data not shown). Therefore, the endogenous compounds are neither 4a nor 5a but a different N-acetylcysteine conjugate and its sulfoxide with identical nominal masses to 4a and 5a. These endogenous chemicals are neither 4b nor 5b since their retention times are substantially different from these two compounds (48 min versus 45 min and 33 min versus 30 min, respectively). Since the endogenous compound had the same fragmentation pattern as the furan metabolite 4a (m/z 398 → m/z 269 and 227), caution will need to be taken when quantitative methods for the analysis of these two metabolites are developed for biomarker studies. The levels of these endogenous compounds were comparable to those of metabolites 4a and 5a in the urine of animals treated with 8 mg/kg [13C4]furan (Figure 4).
Figure 4.
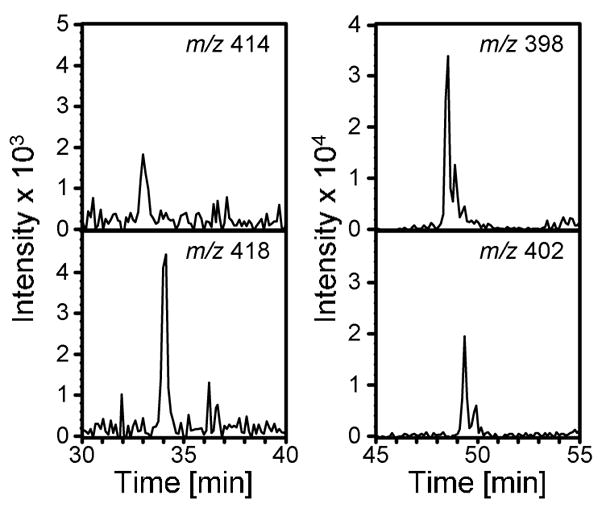
Extracted chromatograms at 398/402 and 414/418 amu in urine from [13C4]furantreated rats (8 mg/kg).
Metabolism of furan in hepatocytes
To explore the initial products of furan metabolism in the target tissue, freshly prepared rat hepatocytes were incubated with 100 μM furan and the medium was analyzed by LC-MS/MS for the presence of metabolites. Several metabolites were observed. Their formation was blocked upon inclusion of the P450 2E1 inhibitor, 1-phenylimidazole, in the incubation mixture. SKF525A did not significantly inhibit the formation of metabolites.
The mono-GSH-BDA reaction product 1, but not the bis-GSH reaction products, was detected (Figure 5A). The mass spectrum was consistent with structure 1 (Table 1, Supplemental Figure 4). None of the subsequent metabolites of the GSH-BDA reaction products were detected (data not shown) (18). There was evidence for the formation of cysteine-BDA-lysine reaction products since 4a was detected in these mixtures (Figure 5B). As with the urinary metabolites, this metabolite co-eluted with standard 4a (Supplemental Figure 5) and had the same mass spectrum (Supplemental Figure 1). Metabolite 5a was not detected. The mass spectral data were also probed for the presence of structurally related metabolites, cysteine-BDA-lysine (m/z 316), N-acetylcysteine-BDA-lysine (m/z 358) and GSH-BDA-lysine (m/z 502). No significant ion current was observed at m/z 316. However, there was one peak with m/z 358 which was not in the controls (Figure 5C). This metabolite co-eluted with standard 6a and had a similar mass spectrum (Supplemental Figure 6). There was no signal consistent with the presence of 6b in the incubation mixture. Together, these data support the hypothesis that the metabolic reaction had occurred primarily at the ε-amino group of lysine.
Figure 5.

Extracted chromatographs for furan metabolites formed in hepatocytes. A) 356 amu; B) 400 amu; C) 358 amu; D) 502 amu and E) 544 amu.
There were two major peaks with m/z 502 that required the presence of furan, one eluted at 28.2 min (9b) and the second eluted at 30.8 min (7a, Figure 5D). The mass spectra of these two metabolites were dominated by the fragmentation of the glutathione portion of the molecules (Table 1). The later eluting metabolite co-eluted with standard 7a and had an identical MS2 as the standard (Table 1, Supplemental Figure 7). In addition, high resolution MS analysis indicated that the metabolite had the expected exact mass as standard 7a (Table 1). There was a small peak that co-eluted with standard 7b (Figure 5D). Therefore, the major regioisomer formed in the hepatocytes involved the cross link of a GSH-BDA conjugate with the ε-amino group of lysine.
Metabolite 9b was proposed to be a GSH-BDA reaction product with a different amino acid, glutamine, which has the same nominal mass as lysine. To test this hypothesis, the GSH-BDA-glutamine reaction products were prepared by reacting glutamine with equal molar amounts of BDA and GSH. Two products were observed in a ratio of 14:1. NMR analysis indicated that the major reaction product was GSH-BDA-glutamine where the pyrrole ring involved the α-amino group of lysine (S-[1-(4-amino-1-carboxy-4-oxobuty)-1H-pyrrol-3-yl]-glutathione, 9b) and the minor product resulted from reaction with the amide nitrogen (S-[1-(4-amino-4-carboxy-1-oxobutyl)-1H-pyrrol-3-yl]-glutathione, 9a) (Chart 1). Metabolite 9b coeluted with the major reaction product (9b) and had an identical mass spectrum (Supplemental Figure 8). Consistently, the exact mass of 9b is as expected for the proposed structure (Table 1). It is possible that there were small amounts of isomer 9a that had a similar retention time to 7b. This peak may contain both compounds 7b and 9a. The abundance of 7b relative to this peak is similar to the relative abundance of 9b and 9a observed in the reaction of GSH-BDA with glutamine, consistent with the reaction of GSH-BDA with free glutamine in the hepatocytes. Since 2 mM glutamine was present in the medium, it was possible that GSH-BDA was reacting with this glutamine source. When the medium was not supplemented with glutamine, the levels of GSH-BDA-glutamine metabolite were significantly reduced (Supplemental Figure 9).
Chart 1.

Structure of GSH-BDA-glutamine and GSH-BDA-Nα-acetyllysine reaction products. GS = glutathione
Another hepatocyte metabolite eluted at 43.0 min with a molecular ion (M+H+) at m/z 544 (Figure 5E). As with 9b and 7a, the mass spectrum of this metabolite was consistent with the presence of GSH in the structure (Table 1). This molecular ion is 42 amu higher than those of 9b and 7a, suggesting that it might be an N-acetylated version of these metabolites. A standard for N-acetylated 7a, S-[1-[5-(acetylamino)-5-carboxypentyl]-1H-pyrrol-3-yl]-glutathione (10, Chart 1) was generated by reacting Nα-acetyl-L-lysine with BDA and GSH. This compound co-eluted with the metabolite (Supplemental Figure 10). Its isomer, S-[1-[5- (acetylamino)-1-carboxypentyl]-1H-pyrrol-3-yl]-glutathione eluted more than one minute earlier than 10 (data not shown). In addition, high resolution mass spectral analysis demonstrated that the exact molecular weight of the metabolite is within 5.5 ppm of the calculated molecular weight for compound 10. It is approximately 60 ppm different than that calculated for the N-acetylated form of 9b (544.1708). Together, these data indicate that 10 is a further metabolite of 7a, and, therefore, likely derived from a degraded GSH-BDA protein adduct.
Evidence for GSH-BDA-protein adducts
As in the chemical reactions, the major isomer for the GSH-BDA-lysine metabolites was 7a; the ratio of 7b/7a was 0.096 following a 4 h incubation period (Table 2). These analyses were performed with media lacking glutamine since 9a coelutes with 7b. If the GSH-BDA-lysine metabolite were solely derived from degraded protein adducts, one would expect to see exclusively 7a. Therefore, it is possible that GSH-BDA is reacting with free lysine within the hepatocyte or in the medium; RPMI medium contains 0.2 mM lysine. To confirm the possibility that GSH-BDA could react with free lysine in the medium, incubations were conducted in which the medium was supplemented with 0.5 mM [4,4,5,5-2H4]-L-lysine. After a 4 h incubation period, the cells were removed and the medium was analyzed by LC-MS/MS with selected reaction monitoring for the loss of 129. GSH-BDA-lysine products formed with cellular lysine (either free or protein bound) have a molecular ion at m/z 502 whereas GSH-BDA-lysine products formed with [4,4,5,5-2H4]-L-lysine have a molecular ion at m/z 506. The ratio of [2H4]7b to [2H4]7a is significantly higher than that observed for the unlabeled metabolites (Table 2). To determine the relative reaction with the unlabeled versus labeled lysine, the ratios of [1H4]7a to [2H4]7a and [1H4]7b to [2H4]7b were calculated. The ratio of [1H4]7a/[2H4]7a was 3 (n = 2)whereas the ratio of [1H4]7b/[2H4]7b was 1.2 (n = 2), indicating that a greater percentage of the ε-substituted regioisomer was formed from unlabeled lysine. If the reaction were completely occurring with free as opposed to protein bound lysine, we would expect the ratio to be the same for both regioisomers. Therefore, it is likely that some of the ε-substituted product is derived from the reaction of GSH-BDA with free lysine and some is derived from degraded protein adducts. Further evidence for this possibility is that the ratio of 7b/7a changes with time (Table 2). At the 1 h time point, the ratio of α- to ε-reaction products is closer to that observed in the in vitro reactions. By the 4 h time point, there is significantly less of the α-substituted product. These results suggest that at early time points the reaction with free lysine is significant. The relative levels of the ε-reaction product increases as the alkylated proteins are degraded.
These observations suggest that BDA is crosslinking GSH to protein lysinyl residues and the degradation of these modified proteins could be a significant source of furan metabolites. To provide preliminary support for this hypothesis, Western analysis of liver and hepatocyte cell extracts was performed with an anti-GSH antibody to determine if GSH was becoming covalently attached to proteins in furan-exposed cells. To ensure that the anti-GSH antibody was capable of detecting GSH-BDA-protein adducts, bovine serum albumin was incubated with BDA and GSH and run on a denaturing gel to see if the GSH-BDA-exposed BSA was recognizable by the anti-GSH antibody during Western analysis. The antibody only recognized the protein when it had been exposed to both BDA and GSH; minimal antibody binding was observed in the untreated BSA lanes (data not shown). Proteins from furan treated rat liver S9 and extracts of furan-treated rat hepatocytes were analyzed by Western blot with anti-GSH antibody (Figure 6). Antibody recognition required exposure to furan and was inhibited upon inclusion of the P450 2E1 inhibitor, 1-phenylimidazole, in the incubations of furan with hepatocytes. SKF525A had no effect on antibody recognition. The binding was not reversed upon reaction of the extracts with excess DTT prior to loading onto the gel indicating that the antibody was probably recognizing GSH covalently associated with hepatocyte proteins; DTT would reverse any GSH-protein disulfide bonds. These data provide strong preliminary evidence that oxidation of furan results in the crosslinking of GSH to protein residues.
Figure 6.

Western analysis of A) S9 from rat liver or B) hepatocyte extracts with rabbit anti- GSH antibody. A) Lane 1: liver S9 from furan-treated rats, lane 2: liver S9 from furantreated rats plus 75 mM DTT; lane 3: liver S9 from furan-treated rats plus 135 mM DTT; lane 4: liver S9 from untreated rats; lane 5, liver S9 from untreated rats plus 75 mM DTT; lane 6: liver S9 from untreated rats plus 135 mM DTT. B) Lane 1: extracts from control hepatocytes; Lane 2: extracts from control hepatocytes plus 75 mM DTT; Lane 3: extracts from furan-treated hepatocytes; Lane 4: extracts from furan-treated hepatocytes plus 75 mM DTT; Lane 5: extracts from SKF525A- and furan-treated hepatocytes; Lane 6: extracts from SKF525A- and furan-treated hepatocytes plus 75 mM DTT; Lane 7: extracts from 1-phenylimidazole- and furan-treated hepatocytes; Lane 8: extracts from 1- phenylimidazole- and furan-treated hepatocytes plus 75 mM DTT.
DISCUSSION
Furan’s toxicity in hepatocytes is dependent on P450 2E1 catalyzed oxidation of furan (9). The formation of the hepatocyte metabolites characterized in this report required P450 2E1 catalyzed oxidation since their formation was inhibited by the P450 2E1 selective inhibitor, 1-phenylimidazole, but not by SKF525A which is a general P450 inhibitor but a poor inhibitor of 2E1 (9,27). The initial product of P450 2E1 catalyzed oxidation of furan is BDA (Scheme 3) (11). Once formed, BDA is expected to rapidly react nonenzymatically with cellular nucleophiles such as GSH (11). The chemical structures of the hepatocyte metabolites indicate that BDA reacts with GSH to form a GSH-BDA reaction product (Scheme 3). This product retains two reactive aldehyde groups. Intramolecular reaction with the glutamate amino group will lead to the formation of the mono-GSH-BDA metabolite 1 (11). Alternatively, GSH-BDA can react with other cellular amines such as lysine or glutamine to form thiol-pyrrole crosslinks like 7a, 7b and 9b. This reaction sequence is supported by model studies with acetylated amino acids which demonstrated that the reaction of BDA with thiols is more rapid than its reaction of amines (13). Previously, we reported that GSH-BDA also reacts with the glutamate amino group of another molecule of GSH to form bis-GSH-BDA reaction products (11, Scheme 3). It was somewhat surprising that no bis-GSH-BDA reaction products were observed as hepatocyte metabolites. We are still investigating the reasons for this but it is likely that other cellular nucleophiles successfully compete with GSH for reaction of GSH-BDA under cellular conditions.
Scheme 3.

Proposed pathways of furan metabolism.
Further metabolic processing of 7a will lead to the other observed hepatocyte metabolites, N-acetylcysteine-BDA-lysine (6a), GSH-BDA-N-acetyllysine (10) and N-acetylcysteine-BDA-N-acetyllysine (4a). The observation of 10 as a hepatocyte metabolite suggests that 7a undergoes N-acetylation in a reaction likely catalyzed by an N-acetyltransferase (28,29). A similar biotransformation has been reported for malondialdehyde-lysine reaction products, where Nα- acetyl-ε-(2-propenal)lysine was detected in urine from malondialdehyde-treated rats (30). The mercapturic acid pathway is responsible for the formation of 6a from 7a. Either 6a or 10 are precursors to 4a. Metabolite 4a was also detected in the urine of furan treated rats (Figure 2) (19). While not observed in hepatocytes, 4a is oxidized to 5a in vivo (Figure 3) (19). The conversion of 4a to 5a is likely catalyzed by cytochrome P450 or flavin mono-oxygenase (31).
Our studies revealed two possible sources for the hepatocyte metabolite, 7a. One pathway of formation is the reaction of GSH-BDA with unbound lysine. The other is the reaction of GSH-BDA with protein lysine residues with subsequent degradation to 7a. In vitro reactions indicate that GSH-BDA will react preferentially with the ε-amino group of unbound lysine in hepatocyte media (Table 2). The ability of metabolically generated GSH-BDA to react with [4,4,5,5-2H4]-L-lysine supplemented in the media indicates that unbound lysine is a target for this reaction. We do not know the extent of uptake of [4,4,5,5-2H4]-L-lysine into the hepatocyte so it is unclear whether [2H4]7a and [2H4]7b are generated inside or outside the hepatocyte. In any case, there was insufficient time for the labeled compound to be incorporated into proteins so we are confident that the levels of [2H4]7a represent reaction of GSH-BDA with free lysine.
There is also evidence suggesting that a portion of 7a is derived from degraded GSH-BDA- protein adducts (Scheme 3). First, the ratio of [1H4]7a/[2H4]7a is approximately 3 times the ratio of [1H4]7b/[2H4]7b, indicating that a greater percentage of the ε-substituted regioisomer was formed from unlabeled lysine. This difference indicates that some of the unlabeled 7a is derived from a source different from unbound lysine. Second, the ratio of 7b/7a decreases with incubation time (Table 2). At the 1 h time point, the ratio of α- to ε-reaction products is closer to that observed in the in vitro reactions. By the 4 h time point, there is significantly more of the ε-substituted product, 7a. These results suggest that the reaction with free lysine dominates at early time points, while degradation of GSH-BDA-protein adducts provides a greater source of this metabolite at later time points. In the 24 h urine of furan-treated rats, only the ε-substituted metabolites, 4a and 5a are observed. If 4b and 5b are present, they were below the limit of detection. Final support for the formation of GSH-BDA-protein adducts is provided by Western analysis of liver and hepatocyte extracts with an anti-GSH antibody (Figure 6). These experiments provide important preliminary evidence that BDA is covalently crosslinking GSH to liver proteins both in vivo and in hepatocytes in vitro.
The observation that BDA is likely cross-linking GSH to proteins indicates that reaction of BDA with GSH does not completely deactivate BDA as previously suggested (13). Previous studies indicated that GSH significantly blocked P450 catalyzed protein binding of [14C]furan in microsomes (8). It was hypothesized that GSH is a good trap for the reactive metabolite because it has both a thiol and an amino group and therefore able to neutralize all the reactive characteristics of BDA (13). However, the detection of 7a and 10 as hepatocyte metabolites of furan indicates that the intramolecular reaction to form the mono-GSH reaction product 1 may not be fast enough to protect against alkylation of other cellular nucleophiles. Based on the peak area of 1 relative to the total peak areas of 4a, 6a, 7a and 10 in the LC-MS analyses, it appears that thio-BDA-lysine cross link pathway is the more abundant product in hepatocyte incubations. However, sensitive analytical methods will be required to accurately establish the relative amounts of these metabolic pathways.
GSH-BDA may have a significant lifetime prior to reacting with amino groups in the cell since the levels of GSH-BDA-glutamine reaction products, 9a and 9b, could be modified by altering the concentration of glutamine in the hepatocyte medium. The relative ratio of 9a and 9b formed in the hepatocytes was similar to that formed in the in vitro reaction mixtures indicating that these hepatocyte metabolites are derived from reaction with free glutamine as opposed to reaction with a glutamine residue in a protein. Similarly, supplementation of the hepatocyte media with labeled lysine led to the formation of labeled 7a and 7b. These data suggest that the BDA-GSH reaction product may migrate across membranes to react with nucleophiles distant from the site of formation.
Chemical characterization of the urinary and hepatocyte metabolites of furan suggest that there are at least three different types of protein adducts generated by reactive furan metabolites (Scheme 3). First, BDA can react directly with protein lysine residues to generate pyrrolinone adducts. This route is supported by the detection of 3 in the urine of furan treated rats (19)2. Second, BDA can react with protein thiol groups to generate a protein thiol-BDA intermediate that can then react with protein lysine groups to form a cysteine-BDA-lysine crosslink within a protein. The third protein adduct is a GSH-BDA-protein lysine crosslink. Our previous model studies with N-acetyl-L-lysine and N-acetyl-L-cysteine indicated that the pyrrolinone adducts of lysine do not lead to the formation of the thiol-BDA-lysine crosslinks since 3 does not lead to the formation of 4a when incubated in the presence of N-acetyl-L-cysteine (13).
The observation that degraded protein adducts are likely abundant in vivo metabolites of furan is consistent with a report that approximately 10% of a 8 mg/kg dose of [14C]furan remains covalently associated with liver proteins 24 h post exposure (7). The structures of the urinary furan metabolites, 3, 4a and 5a indicate that lysine residues in proteins are likely important targets of BDA-mediated alkylation. Identification of the protein targets may provide insights into the mechanisms by which furan induces its toxicity. It is also possible that the formation of large amounts of alkylated proteins directly triggers cell death through the unfolded protein response pathway, as has been suggested for thiobenzamide (32).
In summary, the in vivo metabolites of furan have provided insights into possible reactive metabolites of furan. Oxidation of furan generates BDA that can then undergo at least three possible protein alkylation reactions (Scheme 3). It can either react directly with protein amino groups to form pyrrolinone adducts or it can react with protein cysteinyl residues followed by reaction of the remaining two aldehyde moieties with protein lysine groups. Alternatively, BDA will react with GSH via Michael addition and then proceed to alkylate protein lysinyl groups to form GSH-BDA-protein crosslinks. Future studies will explore the relative contribution of these three protein alkylation pathways to the overall toxic and carcinogenic properties of furan.
Supplementary Material
Acknowledgments
We thank Patrick Kinney, Dr. Fekadu Kassie, and Dr. Michael Byrns for their assistance with the animal studies, Dr. Peter Villalta and Brock Matters for their assistance with the mass spectral analyses, Choua Vu for the synthesis of [13C4]furan and Meredith Cummings and Iman Hassan for their assistance in the preliminary characterization of the furan metabolites. We also thank Dr. Howard Towle, Dr. Douglas Mashek and their laboratories for their generous gift of Sprague-Dawley rat hepatocytes. The mass spectral analyses were performed in the Analytical Biochemical Core at the Masonic Cancer Center, University of Minnesota, which is funded by National Cancer Institute Center Grant CA-77598. This research is funded by ES-10577 from the National Institutes of Health.
Abbreviations
- BDA
cis-2-butene-1,4-dial
- DTT
dithiothreitol
Footnotes
M.B. Phillips and L.A.Peterson, unpublished results
D. Lu and L.A.Peterson, unpublished results
Supporting Information Available: Collision-induced dissociation mass spectra of the metabolites and standards as well as co-elution data are displayed in the supporting information. This information is available free of charge via the Internet at http://pubs.acs.org.
Reference List
- 1.International Agency for Research on Cancer. Dry Cleaning, Some Chlorinated Solvents and Other Industrial Chemicals. Vol. 53. IARC; Lyon: 1995. Furan; p. 393. [Google Scholar]
- 2.Maga J. Furans in foods. Crit Rev Food Sci Nutr. 1979;11:355–366. doi: 10.1080/10408397909527268. [DOI] [PubMed] [Google Scholar]
- 3.Capurro PU. Effects of exposure to solvents caused by air pollution with special reference to CCl4 and its distribution in air. Clin Toxicol. 1973;6:109–124. doi: 10.3109/15563657308991049. [DOI] [PubMed] [Google Scholar]
- 4.Crews C, Castle L. A review of the occurrence, formation and analysis of furan in heat-processed foods. Trends Food Sci Technol. 2007;18:365–372. [Google Scholar]
- 5.National Toxicology Program. 11th Report on Carcinogens. US Department of Health and Human Services; Washington DC: 2005. [Google Scholar]
- 6.National Toxicology Program. Toxicology and carcinogenesis studies of furan in F344/N rats and B6C3F1 mice vol. NTP Technical Report No. 402. US Department of Health and Human Services, Public Health Service, National Institutes of Health; Research Triangle Park, NC: 1993. [Google Scholar]
- 7.Burka LT, Washburn KD, Irwin RD. Disposition of [14C]furan in the male F344 rat. J Toxicol Environ Health. 1991;34:245–257. doi: 10.1080/15287399109531564. [DOI] [PubMed] [Google Scholar]
- 8.Parmar D, Burka LT. Studies on the interaction of furan with hepatic cytochrome P-450. J Biochem Toxicol. 1993;8:1–9. doi: 10.1002/jbt.2570080103. [DOI] [PubMed] [Google Scholar]
- 9.Kedderis GL, Carfagna MA, Held SD, Batra R, Murphy JE, Gargas ML. Kinetic analysis of furan biotransformation by F-344 rats in vivo and in vitro. Toxicol Appl Pharmacol. 1993;123:274–282. doi: 10.1006/taap.1993.1246. [DOI] [PubMed] [Google Scholar]
- 10.Chen LJ, Hecht SS, Peterson LA. Identification of cis-2-butene-1,4-dial as a microsomal metabolite of furan. Chem Res Toxicol. 1995;8:903–906. doi: 10.1021/tx00049a001. [DOI] [PubMed] [Google Scholar]
- 11.Peterson LA, Cummings ME, Vu CC, Matter BA. Glutathione trapping to measure microsomal oxidation of furan to cis-2-butene-1,4-dial. Drug Metab Dispos. 2005;33:1453–1458. doi: 10.1124/dmd.105.004432. [DOI] [PubMed] [Google Scholar]
- 12.Peterson LA. Electrophilic intermediates produced by bioactivation of furan. Drug Metabolism Reviews. 2006;38:615–626. doi: 10.1080/03602530600959417. [DOI] [PubMed] [Google Scholar]
- 13.Chen LJ, Hecht SS, Peterson LA. Characterization of amino acid and glutathione adducts of cis-2-butene-1,4-dial, a reactive metabolite of furan. Chem Res Toxicol. 1997;10:866–874. doi: 10.1021/tx9700174. [DOI] [PubMed] [Google Scholar]
- 14.Byrns MC, Predecki DP, Peterson LA. Characterization of nucleoside adducts of cis-2-butene-1,4-dial, a reactive metabolite of furan. Chem Res Toxicol. 2002;15:373–379. doi: 10.1021/tx0101402. [DOI] [PubMed] [Google Scholar]
- 15.Byrns MC, Vu CC, Peterson LA. The formation of substituted 1,N6-etheno-2′-deoxyadenosine and 1,N2-etheno-2′-deoxyguanosine adducts by cis-2-butene-1,4-dial, a reactive metabolite of furan. Chem Res Toxicol. 2004;17:1607–1613. doi: 10.1021/tx049866z. [DOI] [PubMed] [Google Scholar]
- 16.Byrns MC, Vu CC, Neidigh JW, Abad JL, Jones RA, Peterson LA. Detection of DNA adducts derived from the reactive metabolite of furan, cis-2-butene-1,4-dial. Chem Res Toxicol. 2006;19:414–420. doi: 10.1021/tx050302k. [DOI] [PMC free article] [PubMed] [Google Scholar]
- 17.Peterson LA, Naruko KC, Predecki D. A reactive metabolite of furan, cis-2-butene-1,4-dial, is mutagenic in the Ames assay. Chem Res Toxicol. 2000;13:531–534. doi: 10.1021/tx000065f. [DOI] [PubMed] [Google Scholar]
- 18.Peterson LA, Cummings ME, Chan JY, Vu CC, Matter BA. Identification of a cis-2-butene-1,4-dial-derived glutathione conjugate in the urine of furan-treated rats. Chem Res Toxicol. 2006;19:1138–1141. doi: 10.1021/tx060111x. [DOI] [PMC free article] [PubMed] [Google Scholar]
- 19.Kellert M, Wagner S, Lutz U, Lutz WK. Biomarkers of furan exposure by metabolic profiling of rat urine with liquid chromatography-tandem mass spectrometry and principal component analysis. Chem Res Toxicol. 2008;21:761–768. doi: 10.1021/tx7004212. [DOI] [PubMed] [Google Scholar]
- 20.Farbiszewski R, Gabryel H, Palka J, Holownia A, Sokol A. Plasma and liver amino acids in rats after administration of ethanol or acetaldehyde. Biochem Med Metab Biol. 1986;36:239–243. doi: 10.1016/0885-4505(86)90131-3. [DOI] [PubMed] [Google Scholar]
- 21.Vu CC, Peterson LA. Synthesis of [13C4]furan. J Label Compounds Radiopharm. 2005;48:117–121. [Google Scholar]
- 22.Berry MN, Friend DS. High-yield preparation of isolated rat liver parenchymal cells: a biochemical and fine structural study. J Cell Biol. 1969;43:506–520. doi: 10.1083/jcb.43.3.506. [DOI] [PMC free article] [PubMed] [Google Scholar]
- 23.Carfagna MA, Held SD, Kedderis GL. Furan-induced cytolethality in isolated rat hepatocytes: Correspondence with in vivo dosimetry. Toxicol Appl Pharmacol. 1993;123:265–273. doi: 10.1006/taap.1993.1245. [DOI] [PubMed] [Google Scholar]
- 24.Burns JA, Butler JC, Moran J, Whitesides GM. Selective reduction of disulfides by tris(2-carboxyethyl)phosphine. J Org Chem. 1991;56:2648–2650. [Google Scholar]
- 25.Krijt J, Vackova M, Kozich V. Measurement of homocysteine and other aminothiols in plasma: Advantages of using tris(2-carboxyethyl)phosphine as reductant compared with tri-n-butylphosphine. Clin Chem. 2001;47:1821–1828. [PubMed] [Google Scholar]
- 26.Henchoz Y, Schappler J, Geiser L, Prat J, Carrupt PA, Veuthey JL. Rapid determination of pKa values of 20 amino acids by CZE with UV and capacitively coupled contactless conductivity detections. Anal Bioanal Chem. 2007;389:1869–1878. doi: 10.1007/s00216-007-1568-5. [DOI] [PubMed] [Google Scholar]
- 27.Kedderis GL, Batra R, Koop DR. Epoxidation of acrylonitrile by rat and human cytochromes P450. Chem Res Toxicol. 1993;6:866–871. doi: 10.1021/tx00036a017. [DOI] [PubMed] [Google Scholar]
- 28.Gerlo E, Van Coster R, Lissens W, Winckelmans G, De Meirleir L, Wevers R. Gas chromatographic-mass spectrometric analysis of N-acetylated amino acids: the first case of aminoacylase I deficiency. Anal Chim Acta. 2006;571:191–199. doi: 10.1016/j.aca.2006.04.079. [DOI] [PubMed] [Google Scholar]
- 29.Liebich HM, Forst C. Urinary excretion of N-acetylamino acids. J Chromatogr. 1985;338:187–191. doi: 10.1016/0378-4347(85)80083-9. [DOI] [PubMed] [Google Scholar]
- 30.McGirr LG, Hadley M, Draper HH. Identification of N alpha-acetyl-epsilon-(2-propenal)lysine as a urinary metabolite of malondialdehyde. J Biol Chem. 1985;260:15427–15431. [PubMed] [Google Scholar]
- 31.Anders MW. Chemical toxicology of reactive intermediates formed by the glutathione-dependent bioactivation of halogen-containing compounds. Chem Res Toxicol. 2008;21:145–159. doi: 10.1021/tx700202w. [DOI] [PubMed] [Google Scholar]
- 32.Ikehata K, Duzhak TG, Galeva NA, Ji T, Koen YM, Hanzlik RP. Protein targets of reactive metabolites of thiobenzamide in rat liver in vivo. Chem Res Toxicol. 2008;21:1432–1442. doi: 10.1021/tx800093k. [DOI] [PMC free article] [PubMed] [Google Scholar]
Associated Data
This section collects any data citations, data availability statements, or supplementary materials included in this article.