Abstract
To determine the structures of protein-protein interactions, protein docking is a valuable tool that complements experimental methods to characterize protein complexes. While protein docking can often produce a near-native solution within a set of global docking predictions, there are sometimes predictions that require refinement to elucidate correct contacts and conformation. Previously, we developed the ZRANK algorithm to rerank initial docking predictions from ZDOCK, a docking program developed by our lab. In this study, we have applied the ZRANK algorithm toward refinement of protein docking models, in conjunction with the protein docking program RosettaDock. This was performed by reranking global docking predictions from ZDOCK, performing local side chain and rigid-body refinement using RosettaDock, and selecting the refined model based on ZRANK score. For comparison, we examined using RosettaDock score instead of ZRANK score, and a larger perturbation size for the RosettaDock search, and determined that the larger RosettaDock perturbation size with ZRANK scoring was optimal. This method was validated on a protein-protein docking benchmark. For refining docking benchmark predictions from the newest ZDOCK version, this led to improved structures of top-ranked hits in 20 of 27 cases, and an increase from 23 to 27 cases with hits in the top 20 predictions. Finally, we optimized the ZRANK energy function using refined models, which provides a significant improvement over the original ZRANK energy function. Using this optimized function and the refinement protocol, the numbers of cases with hits ranked at number one increased from 12 to 19 and from 7 to 15 for two different ZDOCK versions. This shows the effective combination of independently developed docking protocols (ZDOCK/ZRANK, and RosettaDock), indicating that using diverse search and scoring functions can improve protein docking results.
Introduction
Protein-protein interactions are key to the functioning of all cells and many biological processes. To understand the mechanism of a protein-protein interaction, the structure of a protein complex is essential. While many high-resolution (x-ray) structures of protein complexes are available in the Protein Data Bank (PDB1), a vast number of protein complex structures are not yet determined. Meanwhile, structural genomics projects are underway,2 producing new structures of proteins, many of them monomeric. With the crystal structures (or modeled structures) of the component monomers, protein-protein docking (referred to as protein docking for brevity) can be used to predict the structures of the protein complex when no protein complex structure is available. Recent developments in protein docking allow for atomic-scale protein complex predictions,3 yet work needs to be done to refine these methods so that they can be quickly and reliably applied to unknown protein complexes.
Many protein docking algorithms are divided into several steps: the initial global search and subsequent steps to improve these initial predictions.4 The global search is a full search of the orientations of the two proteins, typically keeping the larger protein (referred to as the receptor) fixed, while moving the smaller protein (the ligand). This is often a rigid-body search in 6 dimensions, utilizing a Fast Fourier Transform (FFT) for efficiency and softness for small overlaps,5-7 but other methods such as Monte Carlo with side chain searching have also been successful.8,9 The following steps can include clustering,10,11 reranking,12 and structural refinement13 of the initial set of predictions. Structural refinement is useful in that it can improve the contacts and the accuracy of initial predictions that are close to the correct conformation but also have room for improvement.
Previously we have implemented several algorithms for initial-stage docking and refinement: ZDOCK, RDOCK, and ZRANK. The program ZDOCK performs a grid-based docking search using Fast Fourier Transform (FFT), and its scoring includes desolvation, electrostatics, and a novel shape complementarity function.14 It has performed consistently among the top algorithms during the CAPRI docking experiment;15 using ZDOCK to perform docking led to 5 of 6 recent targets with at least one prediction rated Acceptable or higher16 (the highest number among all participants). ZDOCK was also found to compare favorably to other FFT-based docking algorithms in a recent study on clustering initial-stage docking predictions.17 While ZDOCK produces many near-native predictions (hits), they are often not ranked in the top 10. To improve the rank of the hits, RDOCK performs docking refinement by reranking the top 2000 ZDOCK predictions using energy minimization followed by scoring using electrostatics and desolvation.18 Although RDOCK has been shown to improve the success rate of ZDOCK predictions, it lacks the ability to quickly process all 54,000 predictions from a ZDOCK run.
To account for this, we developed the ZRANK program; it uses a weighted energy function with van der Waals, electrostatics and desolvation terms to quickly and effectively rerank the ZDOCK predictions without energy minimization.19 It was tested on protein docking Benchmark 2.0,20 using predictions from two versions of ZDOCK: ZDOCK 2.1 (which employs shape complementarity alone) and ZDOCK 2.3 (which employs shape complementarity, desolvation, and electrostatics). In both cases there was significant improvement in docking performance when using ZRANK to rescore the rigid-body predictions; the number of cases with top-ranked hits increased from 2 to 11 for ZDOCK 2.1 and from 6 to 12 for ZDOCK 2.3.
It was noted that ZRANK could be followed with structural refinement to further improve the docking success rate.19 To examine this possibility, we have combined the initial-stage docking of ZDOCK and scoring of ZRANK with the structural refinement of RosettaDock.8The local refinement of RosettaDock includes side chain repacking and a Monte Carlo search of the local rigid-body space of the ligand. While RosettaDock can be highly successful in obtaining atomically accurate models through its refinement, it is sometimes unsuccessful in locating near-native structures in its initial (Monte Carlo based) global search due to the large size of the search space, particularly for larger proteins.21 On the other hand, ZDOCK is not as limited by size of the protein structures, as it utilizes the FFT to scan the entire protein translational space quickly.
In this study, we tested the effectiveness of refining the initial-stage docking structures from ZDOCK and ZRANK using RosettaDock, and selecting refined models using either RosettaDock score or ZRANK score. Also we explored using a larger perturbation size in the RosettaDock refinement search, to determine whether this can allow for successful refinement of models that are more distant from native. Finally, we optimized the ZRANK scoring function specifically to evaluate refined structures, which leads to a significant improvement in accuracy.
Materials and Methods
In this study, hits are defined as predictions with Cα root-mean-square distance (RMSD) of less or equal to than 2.5 Å after superposition with the interface atoms in the crystal structure, as described by Chen et al.14 Near-hits are defined as having interface Cα RMSD greater than 2.5 Å and less than or equal to 4.0 Å.
The initial-stage docking models were generated by ZDOCK versions 2.314 and 3.0.22 For the ZDOCK runs, 6° rotational sampling was used, with different initial rotations for each test case to avoid bias. The 76 rigid-body and medium unbound Benchmark 2.0 cases were used for docking. This was to provide as large a test set as possible, without including the difficult cases which would require explicit modeling of the large interface conformational changes to produce near-native predictions.20 For the antibody test cases, the search was restricted to the complementarity determining regions for the antibody cases, as described by Chen and Weng.6
ZRANK was used to rerank the ZDOCK models as described previously,19 with polar hydrogens added to the unbound proteins using RosettaDock prior to scoring. For the refined structures, hydrogens were already in the structures from RosettaDock. The non-polar hydrogens (which were also added by RosettaDock) were ignored by ZRANK.
For the docking refinement protocol, the Monte Carlo refinement method of RosettaDock 2.0 was used,8 with ZDOCK predictions as starting structures. Non-standard amino acids and non-protein atoms were removed prior to refinement, with exceptions where substitutions were possible (for example modeling MSE as MET). During refinement, extra chi1 rotamers and chi2 aromatic rotamers were included in the side chain searching. Unbound rotamers were also used, as described by Wang et al.,23 with the exception of the cases with bound antibody structures. Filtering was turned off, as it was found to lead to no output for many ZDOCK predictions, due to the filter rejecting the models because of small clashes. Three hundred refined models were generated for each starting structure, similar to (but slightly smaller than) the 500−1000 structures generated by Schueler-Furman et al.24
The Large Perturbation RosettaDock searching (Large Pert) was achieved through modification of the RosettaDock code and setting Monte Carlo perturbations to 0.4 Å and 0.2°, rather than the default perturbation (Default Pert) size of 0.1 Å and 0.05°.8
To optimize the weights of the ZRANK terms for scoring refined models, a downhill simplex was used to determine the weights, as was used for the original ZRANK.19 To generate the docking models for training, all three initial docking protocols used in this study (ZD2.3ZR, ZD3.0, ZD3.0ZR) were utilized. This provided 37 Benchmark 2.0 cases with near-hits in the top 20 predictions. For all of these cases, the top 20 models for each protocol were refined by RosettaDock to produce 300 refined models. The downhill simplex was then used to maximize the number of hits per test case, selecting the top-scoring prediction (using the candidate weights) from the 300 refined structures for each of the 20 models. The simplex optimized the weights for the seven terms from the original ZRANK, as well as a term for the IFACE potential.22 To avoid missing the global minimum, 30 different simplex starting points were used as well as five random restarts from each minimum. For the success rate calculation, five-fold cross validation was used. We divided the test cases into five non-overlapping sets, training the weights with four sets and testing on the remaining set. This was performed five times so that each set was tested using weights from the remaining sets.
Results
ZDOCK and ZRANK Success Rates for Hits and Near-hits
To produce initial sets of structures for refinement, ZDOCK versions 2.314 and 3.022 were run on all rigid-body and medium difficulty cases from Benchmark 2.0,20 and ZRANK19 was then used to rerank all 54,000 of the initial-stage docking predictions for each ZDOCK run. ZDOCK 3.0 is a newly developed version of ZDOCK that uses a pairwise interface statistical potential (IFACE) based on improved atom-typing,25 and has been shown to have significantly improved success on a docking benchmark. We did not use ZDOCK 2.126 as its shape complementarity scoring function is contained within ZDOCK 2.3 and ZDOCK 3.0, and its performance is approximately the same or less than that of ZDOCK 2.3.14
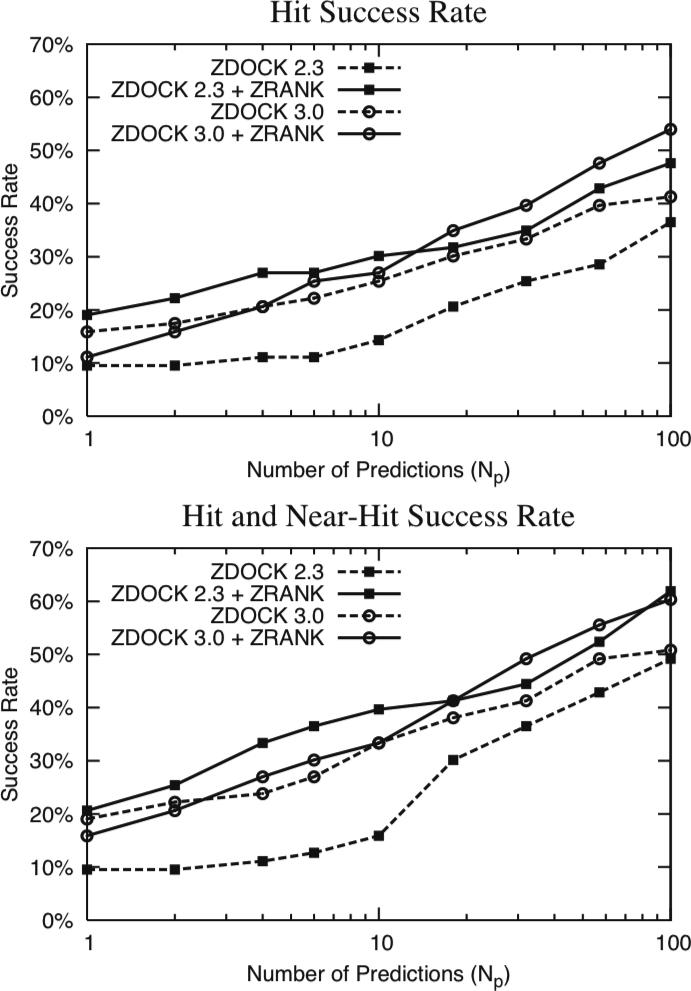
The success rate for each docking/scoring method for the 63 rigid-body cases is given in Figure 1. For each number of Np predictions allowed, the success rate denotes the percentage of cases with a hit (or near-hit) ranked within that set of predictions. As defined in the Methods, hits are predictions with interface root-mean-square distance (RMSD) of less than or equal to 2.5 Å from structure of the complex, and near-hits are predictions with interface RMSD greater than 2.5 Å and less than or equal to 4.0 Å from the structure of the complex.
Figure 1.
Hit success rate (top) and hit and near-hit success rate (bottom) for ZDOCK 2.3 and ZDOCK 3.0 with and without ZRANK for the rigid-body cases of Benchmark 2.0, versus number of predictions allowed (Np). Hits are defined as having interface RMSD less than or equal to 2.5 Å from the complex structure determined by x-ray crystallography, and for near-hits the RMSD is between 2.5 Å and 4.0 Å.
While the success rates of ZDOCK 2.3 and ZRANK have already been investigated,19 Figure 1 provides a basis for examining how ZRANK performs when reranking ZDOCK 3.0 models, and also how near-hit success compares with hit success for these protocols. The hit success rate for ZDOCK 2.3 and ZRANK (ZD2.3ZR) versus the original ZDOCK 2.3 (ZD2.3) predictions represents a strong improvement, as has already been noted.19 For ZDOCK 3.0 followed by ZRANK (ZD3.0ZR), the success rate is slightly lower than that of ZDOCK 3.0 (ZD3.0) for the top few predictions (Np < 4). After this point, the hit success rate of ZD3.0ZR is better than for ZD3.0 alone, and surpasses that of ZD2.3ZR at Np = 20.
The near-hit success rates (Figure 1, bottom) are shifted up from those of the hits, reflecting the more lenient cutoff. In general, the near-hit success rates follow the same trends as the hit success rates. The top near-hit success rates at Np = 100 are highest for the ZRANK protocols (ZD2.3ZR and ZD3.0ZR), both above 60%. In addition, ZD3.0 gives a relatively high near-hit success rate, particularly for the top predictions.
Testing of RosettaDock Sampling and ZRANK Scoring
Based on the success rates for ZRANK and ZDOCK to produce initial hit and near-hit structures, we chose to refine models generated by ZD2.3ZR, ZD3.0, and ZD3.0ZR sets. The ZD2.3ZR, ZD3.0, and ZD3.0ZR sets have 26, 27, and 27 cases, respectively, with hits or near-hits in the top 20 predictions.
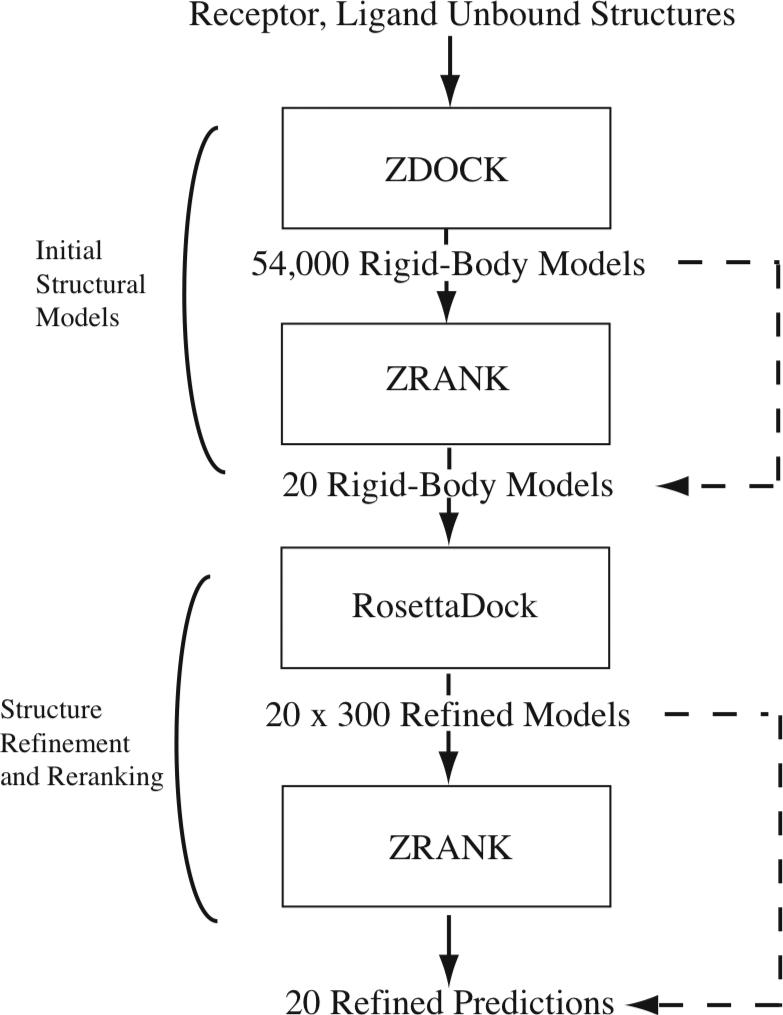
The schematic showing the basic steps we employed for docking and refinement is given in Figure 2; the focus of this study is the last two steps. For each test case, the top 20 models from ZDOCK and ZRANK were refined using RosettaDock to generate 300 models per prediction. ZRANK was then used to score all 300 models for each prediction, and the best scoring model of the 300 was selected for that prediction. Finally, these 20 refined structures were reranked by ZRANK score. For comparison, we consider two alternatives: the use of the top ZDOCK models for the input to refinement (rather than ZDOCK and ZRANK) as illustrated by the top dotted line (which was performed for the ZD3.0 set), and the use of RosettaDock scores to select the refined structures and rerank them (thus skipping the second ZRANK step) as shown by the lower dotted line.
Figure 2.
Protocol employed for docking and refinement (alternative protocols employed in this study are indicated with dashed lines). The initial stage, which produces 20 rigid-body models, includes ZDOCK followed by ZRANK (alternatively the top 20 ZDOCK models are used). The model refinement, which is the focus of this study, employs RosettaDock to refine each model to generate 300 structures per rigid body prediction. These structures are rescored by ZRANK and the top scoring model is selected from each set of 300. The resultant 20 predictions are reranked using ZRANK score (alternatively RosettaDock score is used to select and rerank the structures).
In addition to testing RosettaDock scores instead of ZRANK scores to evaluate the structures, we also explored using a larger rigid-body perturbation size in the RosettaDock structural refinement (as described in the Methods section), referred to as large perturbation (Large Pert) versus default perturbation (Default Pert). This was performed primarily to determine whether increasing the search space would successfully refine the more distant hits and near-hits. The evaluation of these refinement protocols was performed via several metrics, and is given below.
Amount of Structural Improvement
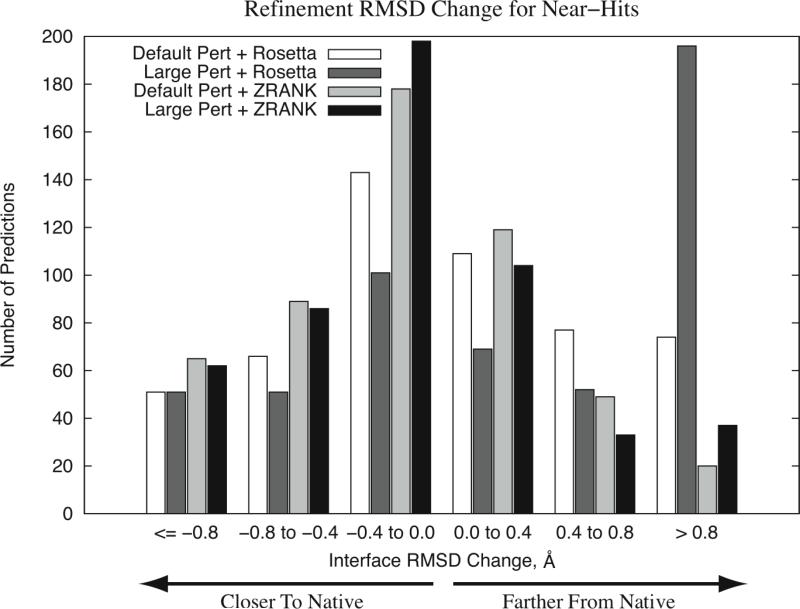
To determine the degree of structural improvement resulting from the refinement and reranking, we calculated the interface RMSD of the refined structure and compared it with the initial interface RMSD of the prediction for all models that were initially near-hits (from the three docking protocols ZD2.3ZR, ZD3.0 and ZD3.0ZR). The histogram of these RMSD changes is given in Figure 3.
Figure 3.
Histogram of interface RMSD change for all hit and near-hit models after refinement using several search/scoring strategies. Each bin represents the interface RMSD after refinement minus the interface RMSD of the model before refinement. Default Pert = RosettaDock refinement with default perturbation size, Large Pert = RosettaDock refinement with large perturbation size, Rosetta = RosettaDock score used to select the predictions, ZRANK = ZRANK score used to select the predictions.
For the RosettaDock scoring, the Default Pert searching performed better than the Large Pert. In particular, the Large Pert had a significant amount of models that were worse than input by > 0.8 Å. This can be explained by the fact that the RosettaDock scoring function and search function were developed together, and the default search size may be optimized for its scoring scheme.
Also in Figure 3 the improvement from ZRANK scoring can be seen, resulting in significant differences in the distributions from RosettaDock scoring. Using the Wilcoxon rank sum test, the P-values for similarity between the RosettaDock and ZRANK scoring RMSD distributions are 2.7*10−8 and < 2.2*10−16 for Default Pert and Large Pert, respectively. For all bins representing structural improvement, the ZRANK scoring had more predictions than for RosettaDock scoring. Comparing the perturbation sizes for ZRANK scoring, they are approximately equal for the larger improvement bins, while the Large Pert+ZRANK improved more predictions than Default Pert+ZRANK for the under 0.4 Å range. The Default Pert then had more predictions become slightly and moderately worse, and Large Pert had some predictions worsen by 0.8 Å or more while default had none. Overall, the large perturbation performed better than default perturbation for the ZRANK scoring.
Improved Structures versus Initial RMSD
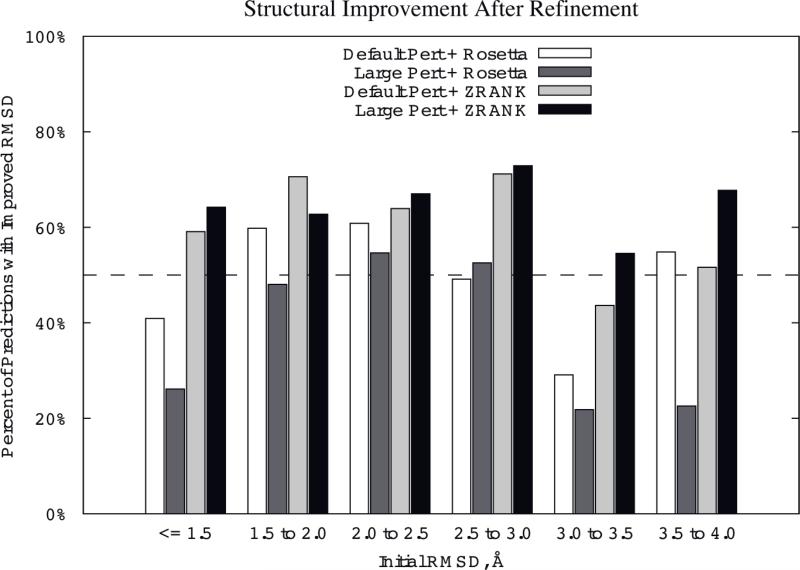
To further examine the structural improvement from refinement using these methods, we binned the predictions based on their initial RMSDs and calculated percentage of cases with structural improvement for each bin (Figure 4). This indicates which methods perform well for the more distant initial predictions. The dotted line indicates 50% of cases improving; however, it should be noted that random movement of the proteins might not necessarily yield this high a rate of improvement.
Figure 4.
Percent of models with RMSD improvement for several search/scoring strategies, binned by initial interface RMSD of the models. The dotted line represents 50% success rate. Protocols and abbreviations are the same as Figure 3.
It can be seen in Figure 4 that the RosettaDock Large Pert+ZRANK gives the greatest overall performance in structural improvement. In four of the six bins it has the highest percentage improved, and in five out of six of the bins it is above 60% improved (all of them are above 50%). The highest percentage improvement is for the bin of 2.5 Å to 3.0 Å, which represents the most proximal near-hits. Following this method in terms of performance is default perturbation plus ZRANK and default perturbation plus RosettaDock scoring.
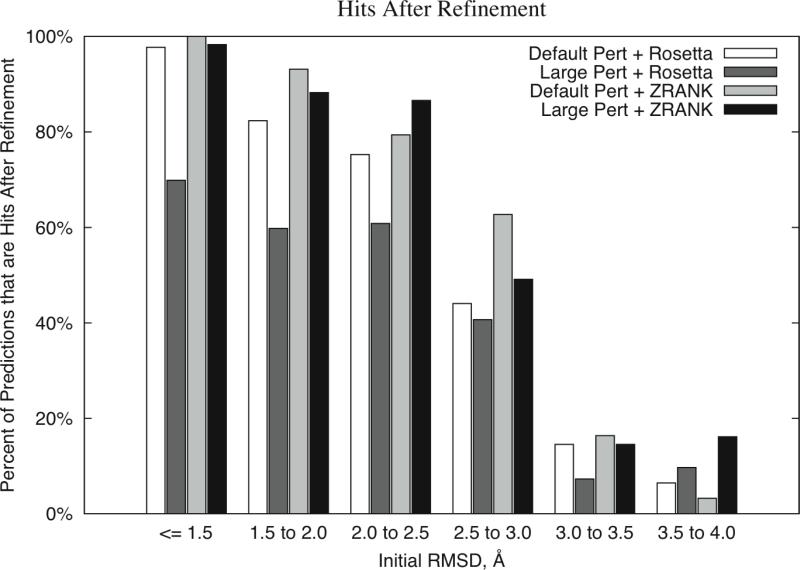
Hits After Refinement versus Initial RMSD
In addition to the structural improvement, we also measured the performance for hits after refinement for the same refinement schemes (Figure 5). It should be noted that performing no refinement at all would yield 100% hits in the first three bins, and 0% hits in the latter three bins.
Figure 5.
Percent of models with hits after refinement for several search/scoring strategies. binned by initial interface RMSD of the models. Protocols and abbreviations are the same as Figure 3.
In this case, the default perturbation with ZRANK performed slightly better than the large perturbation with ZRANK for the bins with the smallest initial RMSDs. Interestingly, the large perturbation with ZRANK has the most hits for the bin from 3.5 Å to 4.0 Å starting RMSD, in agreement with that the larger perturbation allowed for more sampling in hit range for those distant predictions than default perturbation. RosettaDock with default perturbation also performed well, but not as high as the ZRANK scoring with either perturbation size.
Score versus RMSD Examples
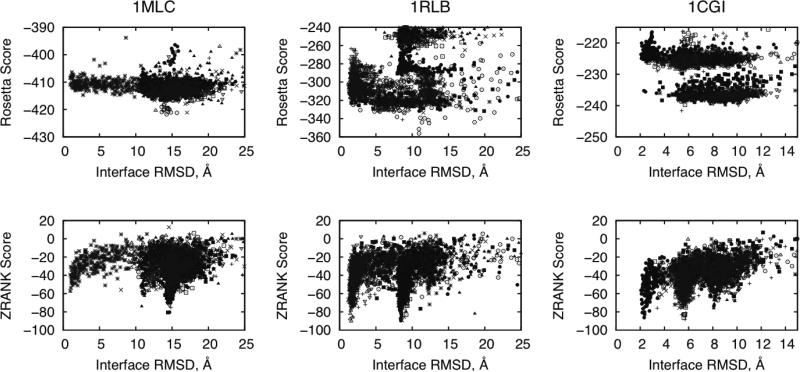
One means to understand the effectiveness of a scoring function is to plot the scores of the docking models versus the RMSD to see if there is a trend or funnel toward the native structure. Such funnels are considered to be part of the physical binding process,27-29 thus an accurate energy function should be able to replicate this. Plots of score versus RMSD for three test cases are shown in Figure 6, using RosettaDock Large Pert for searching and RosettaDock (top) and ZRANK (bottom) scoring. For each test case, the top 10 model refinements are shown, to illustrate how the scores and funnels appear for both the near-native structures and those that are far from native for that test case (the top 10 rather than the top 20 were shown to simplify the plots).
Figure 6.
Refinement of three test cases, 1MLC, 1RLB, and 1CGI, with Rosetta scores (top) and ZRANK scores (bottom) versus interface RMSD of the predictions. For each case, 300 refinement models were generated for each of 10 input structures from ZD2.3ZR (1MLC), ZD3.0ZR (1RLB), and 1CGI (ZD3.0), using the large perturbation size for RosettaDock refinement. Each point represents the score for one refinement model, and each point type represents refinement models for one input prediction. For each input model, the top scoring refined model was retained for evaluation.
In all three cases, there is a hit after refinement when using the ZRANK scoring, and the energy funnels can be seen for the near-hits and hits. This is not as evident when using the RosettaDock scoring for these predictions, as can be expected based on the overall results described above (Figure 3-5). Although it is not the top-ranked prediction, the near-hit for 1MLC is refined to 0.98 Å using ZRANK scoring to select the top model, close to the minimum rigid-body RMSD for this case (0.6 Å). Also using ZRANK scoring, the top-ranked model for 1RLB is a hit with 1.38 Å RMSD, and for 1CGI the near-hit model is refined from the initial 3.4 Å RMSD to 2.33 Å RMSD, thus producing a hit from a near-hit. In the case of 1CGI, the interface RMSD between the superposed unbound and bound structures is 2.02 Å, making this one of the more difficult of the rigid-body Benchmark 2.0 cases.20
Detailed Results: ZD3.0ZR + RosettaDock Large perturbation + ZRANK
Based on the analysis of the four different refinement sampling and scoring schemes (Figures 3, 4, and 5), we chose to utilize the ZRANK scoring and large perturbation of RosettaDock for the remainder of this study.
Numbers of Refined Structures
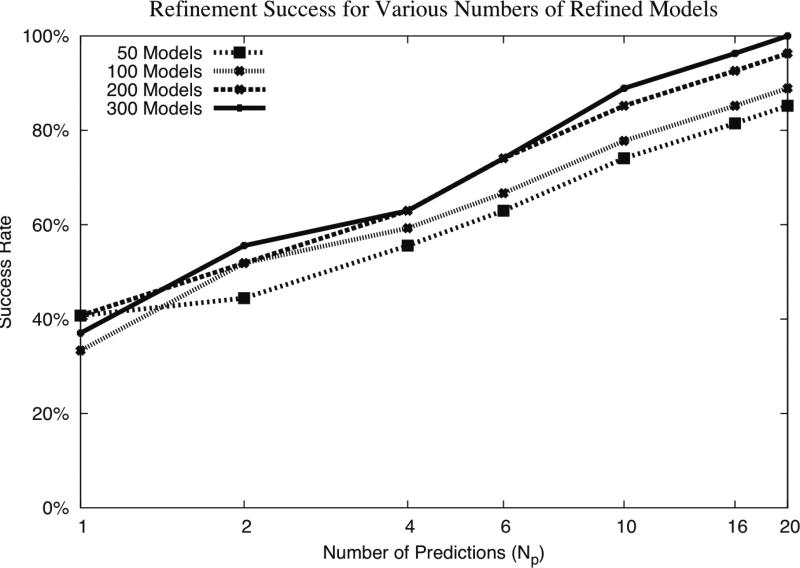
While we selected to use sets of 300 refined structures for this study, we examined the success rates for using fewer than 300 refined structures from RosettaDock as input to the scoring. In this case, the success rate is out of all hit and near-hit cases from ZD3.0ZR selected as input to refinement. This is provided in Figure 7. Random subsets of predictions were selected from the RosettaDock refined structures to determine the success from sets of fewer than 300 predictions. The success rates increase upon using more predictions from RosettaDock, with 300 predictions showing the highest overall success rate, in particular for Np > 6. At 20 predictions, using 300 refined structures and ZRANK has a 100% success rate, indicating that all 27 cases that had hits or near-hits in the top 20 prior to refinement had hits after refinement. Based on this analysis, it is possible that greater than 300 refined structures would provide even greater success rate, however this was not tested due to computational limitations.
Figure 7.
Success rates of refinement for ZD3.0ZR predictions for hit and near-hit cases for various numbers of RosettaDock refinement models. Success is defined as the number of cases (out of 27 hit and near-hit cases from this set) that have a hit in a given number of top-ranked predictions (Np). The large perturbation size was used for RosettaDock, and ZRANK scoring was used to select and rerank the refined model. Random subsets of RosettaDock refined models were selected from a total of 300 for the smaller numbers of models.
Hit Statistics
To provide an illustration of the specific improvements from this refinement, the detailed results for the refinement of ZD3.0ZR models are given in Table 1. As was noted above regarding the success rate (Figure 7), all 27 cases had hits after refinement, with four cases becoming hits from near-hits. The number of cases with hits ranked at #1 increased from 7 to 10 after refinement. For 20 of the 27 cases, the RMSD of the top hit was improved indicating the structural improvement resulting from the refinement.
Table 1.
Results for all near-hit cases of the ZD3.0ZR set, before and after refinement.
| Test Case |
ZD3.0ZR Orig |
ZD3.0ZR+Ros+ZR |
||||
|---|---|---|---|---|---|---|
| Hits1 |
Rank2 |
RMSD3 |
Hits1 |
Rank2 |
RMSD3 |
|
| 1AVX | 2 | 11 | 1.59 | 2 | 1 | 1.45 |
| 1BVN | 1 | 16 | 1.55 | 1 | 3 | 2.49 |
| 1DFJ | 3 | 2 | 2.06 | 2 | 2 | 2.24 |
| 1E6E | 7 | 5 | 1.96 | 8 | 1 | 1.08 |
| 1EAW | 0 | - | - | 1 | 9 | 1.70 |
| 1MAH | 6 | 3 | 1.10 | 6 | 1 | 0.93 |
| 1PPE | 19 | 1 | 0.76 | 19 | 1 | 0.56 |
| 1UDI | 0 | - | - | 2 | 2 | 2.16 |
| 2SIC | 9 | 1 | 1.38 | 9 | 1 | 0.60 |
| 7CEI | 11 | 3 | 1.34 | 11 | 2 | 1.46 |
| 1E6J | 9 | 1 | 1.58 | 3 | 8 | 1.57 |
| 1JPS | 2 | 1 | 1.01 | 2 | 5 | 0.93 |
| 1MLC | 3 | 5 | 1.14 | 3 | 9 | 1.02 |
| 1WEJ | 4 | 2 | 0.75 | 3 | 4 | 0.62 |
| 2VIS | 1 | 8 | 2.02 | 1 | 15 | 2.24 |
| 1B6C | 4 | 2 | 2.38 | 10 | 1 | 2.42 |
| 1F51 | 2 | 3 | 1.67 | 2 | 2 | 1.75 |
| 1KAC | 1 | 11 | 2.10 | 1 | 2 | 1.89 |
| 1KXP | 0 | - | - | 2 | 9 | 1.91 |
| 1ML0 | 9 | 1 | 1.25 | 9 | 1 | 1.24 |
| 1RLB | 8 | 1 | 2.31 | 8 | 1 | 1.38 |
| 1BJ1 | 1 | 19 | 1.18 | 1 | 16 | 1.10 |
| 1FSK | 17 | 1 | 1.05 | 17 | 1 | 1.54 |
| 1IQD | 0 | - | - | 1 | 18 | 1.46 |
| 1KXQ | 2 | 14 | 1.29 | 2 | 6 | 0.95 |
| 1NCA | 1 | 14 | 0.90 | 1 | 1 | 0.55 |
| 2QFW | 3 | 6 | 1.80 | 1 | 5 | 1.63 |
Number of hits in the top 20 predictions.
Rank of the first hit; “-” denotes no hit was found in the top 20.
Interface root-mean-square distance (RMSD) of the first hit, in Å; “-” denotes no hit was found in the top 20.
Refined Structure Example
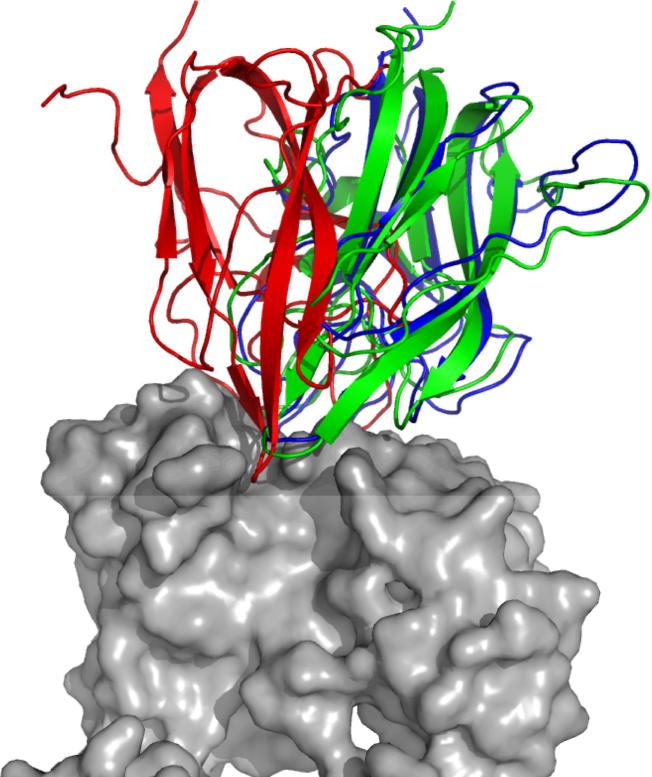
In some cases, there were significant improvements of RMSD, for example 1IQD (Factor VIII/Fab) for the ZD3.0ZR set, which is shown in Figure 8. The original model from ZDOCK, which had an interface RMSD of 4.18 Å, was refined by RosettaDock to produce 300 structures, and these models were scored by ZRANK to select the structure shown, with 1.46 Å interface RMSD. Figure 8 shows how the ligand in the final structure is both shifted and rotated from the initial prediction to be positioned more correctly on the receptor. Though it is not the typical degree of RMSD improvement (as indicated by Figure 3), this demonstrates that it is possible to sample adequately large space in the Rosetta refinement to achieve significantly improved structures from the initial rigid-body prediction, and such structures can be identified by ZRANK. Interestingly, there were several predictions for this case with initial RMSD less than 4.0 Å, and none of these became hits; this is possibly due to the initial positioning having some hindrance preventing the Monte Carlo algorithm from correctly positioning the ligand and its side chains for those predictions.
Figure 8.
Refinement of ZD3.0ZR prediction #12 for test case 1IQD (Factor VIII/Fab), with input ligand (red), refined ligand (green) and bound ligand (blue). The bound receptor is colored gray. The refined structure was chosen by ZRANK score of the 300 refined models from Rosetta. Figure generated with Pymol.35
Retraining Weights for Refinement
Based on the success of using the ZRANK scoring function to rescore refined models, we retrained the ZRANK weights to determine whether this would further improve the refinement performance, in particular to rank refined hits at #1. For several instances (such as 1MLC and 1CGI in Figure 6) the near-hit structures were refined well using RosettaDock and ZRANK scoring, but the hit predictions were not ranked at #1 among the top 20. This is possibly because the original ZRANK weights were determined using rigid-body models from ZDOCK, and though they are effective they may not be optimal for discriminating refined predictions that should have less clash and better side chain positions. For instance, the van der Waals repulsive weight in ZRANK is significantly smaller than the van der Waals attractive to provide softness for the scoring of the rigid-body predictions; for the refined predictions this softness may not be as necessary.
Weights were retrained as described in the Methods section, using five-fold cross validation with the original ZRANK terms and also incorporating a term for the pairwise IFACE potential.22 The cross-validation results using these new weights are provided in Table 2, along with the initial results for comparison. The number of cases with hits ranked at #1 is significantly higher compared with the original predictions, and also compared with the original ZRANK for refinement scoring. The best performance for the retrained function is seen for the ZD2.3ZR and ZD3.0ZR sets. Comparing the results using the new weighted refinement to before refinement, the number of cases with hits ranked at #1 increased from 12 initially to 19 (the ZD2.3ZR set) and from 7 initially to 15 (the ZD3.0ZR set). For the ZD2.3ZR set, the 19 cases with hits at #1 comprise over 79% of the 25 cases with hits in the top 20. Both refinement with the ZRANK weights and refinement with the new weights led to significant improvements in the number of cases with hits in the top 20 versus the original unrefined models.
Table 2.
Number of cases with hits ranked at #1 and in the Top 20, before refinement, after refinement with ZRANK (Ros+ZR) and after refinement with new ZRANK Refine function (Ros+ZR Refine) for three sets of initial predictions.
| Original |
Ros+ZR |
Ros+ZR Refine |
|||||
|---|---|---|---|---|---|---|---|
| Input | Rank | 1 | 20 | 1 | 20 | 1 | 20 |
| ZD2.3ZR | 12 | 20 | 10 | 24 | 19 | 24 | |
| ZD3.0 | 10 | 19 | 9 | 23 | 13 | 21 | |
| ZD3.0ZR | 7 | 23 | 10 | 27 | 15 | 26 | |
The weights obtained when training using the entire set of cases are:
vdW attractive: 1.0
vdW_repulsive: 0.23
electrostatics short-range attractive: 0.57
electrostatics short-range repulsive: 0.56
electrostatics long-range attractive: 1.09
electrostatics long-range repulsive: 0.29
ACE: 0.7
IFACE: 0.38
As anticipated, the repulsive van der Waals weight is higher than for the original ZRANK weights, which was 0.009, representing less softness in the refinement scoring function. As before, the electrostatics short-range terms are similar to one another. The ACE and IFACE terms both have significant weights and the sum of their weights is approximately the same as the ACE weight for the original ZRANK, where no IFACE term was present. Both IFACE and ACE are contact potentials representing solvent exclusion. ACE was parameterized based on atomic contacts within chains of protein crystal structures.30 In contrast, the IFACE function was developed using structures of transient protein-protein interfaces, and has 12 atom types rather than the 18 atom types of ACE.22,25 Ideally, IFACE should replace ACE entirely when evaluating protein-protein interfaces; however, the amount of available training data is substantially less for IFACE than for ACE, hence some energy terms may be better estimated in ACE. As the weights and results indicate, these terms complement each other well and help to improve the accuracy of discriminating refined hits from non-hits.
CAPRI Experiment
The Critical Assessment of PRedicted Interactions (CAPRI) is an international experiment for testing protein docking methods where participants make blind predictions of protein complex structures.31 Recently, the CAPRI experiment has featured a scoring sub-round where a set of initial docking models from several groups (approximately 1000−2000) are rescored and refined by participants, and the top 10 models are submitted for evaluation.
We have used the CAPRI scoring experiment as an opportunity to test the combination of ZRANK and RosettaDock, with positive results (Table 3). The CAPRI evaluation classifies docking predictions as acceptable (*), medium (**) and high (***) accuracy. Our definition of “hits” is approximately between the criteria for “acceptable” and “medium” for CAPRI. Our general protocol for CAPRI scoring was to rescore input models with ZRANK, filter false-positive models using known biological data (e.g., if a C-term is known not to interact then predictions involving an interface C-term are removed), refine using RosettaDock, and rerank the refined structures using ZRANK.
Table 3.
CAPRI scoring results for using ZRANK and RosettaDock, with numbers of Acceptable and Medium predictions submitted in the 10 predictions for each target.
| Target | Protein | Acceptable | Medium |
|---|---|---|---|
| T26 | TolB/Pal | 1 | 3 |
| T27.2 | E2−25K/Ubc9 | 7 | 0 |
| T29 | Trm8/Trm82 | 1 | 2 |
For all three targets, we submitted at least one acceptable prediction, and for two targets we submitted medium predictions.16 For Target 26, where we utilized ZRANK and Rosetta with default perturbation (selecting models based on RosettaDock score) because we had not investigated large perturbation at that time, we achieved 3 medium and 1 acceptable predictions. In the case of Target 27 (the second interface evaluated), we achieved 7 acceptable predictions, and for Target 29, for which the protocol matches that of the present study with large perturbation and ZRANK, we submitted two medium and one acceptable predictions for the scoring sub-round. For Target 28 (results not shown), no near-hits were provided to the scorers so as a result there were no acceptable predictions from any scorers.
It should be noted that the input predictions for the CAPRI scoring are not necessarily from ZDOCK; in fact as several groups are involved in producing initial structures some scoring structures are certainly not and may include refined models or more clash than ZDOCK predictions, which was the original intent of ZRANK. However success in the context of the CAPRI scoring helps to highlight the effectiveness of this algorithm.
Computational Performance
The computational time of the Rosetta refinement protocol on a 2.2 GHz Linux machine was on average 9 hours to produce 300 refined structures from the input model. Scoring the 300 refined structures with ZRANK took an average of 4 minutes.
Discussion
Protein docking often requires the effective usage of several steps to produce accurate predictions.4 In this study, we have explored an efficient global search with rescoring and refinement, by combining the tools ZDOCK, ZRANK and RosettaDock. The combination of these techniques has led to increased success on a docking benchmark and suggests that this is a promising avenue for further improving protein complex prediction success.
One interesting result from this study is the improvement of using ZRANK scoring over RosettaDock scoring when selecting refined docking models. It has been shown that RosettaDock scoring, when used in the context of the RosettaDock global search, is effective on a docking benchmark.8 One major difference in this study is that the models being refined are from rigid-body docking using ZDOCK, rather than from the Rosetta global search. The softness in the scoring function of ZDOCK allows for slight side chain overlaps in the predictions; Rosetta is most likely not as tolerant of these as ZRANK. This also explains the need for removal of the filter when running the RosettaDock refinement, as discussed in the Methods section. On the other hand, the ZRANK scoring function was parameterized to allow it to effectively score rigid-body predictions.
The success rates and refinement RMSD changes (Figures 3, 4, and 5) highlight the performance differences between the scoring functions and search strategies explored in this study. It is particularly clear from the success rates in Figure 4 that the RosettaDock with large perturbation combined with ZRANK scoring performs well for structural refinement. While RosettaDock scoring does perform well when rescoring the refined models using RosettaDock default perturbations, it is not as high a success rate as that for either perturbation size with ZRANK.
The success rates of the refinement procedure described here are further improved by re-optimization of the scoring function for refined docking models. The vast improvement in success of cases with hits ranked at #1 is highly encouraging. Also informative are the weights themselves resulting from the training; indicating that the van der Waals repulsive provides more discrimination after refinement, where models (including hits) no longer have clash that is inherent in rigid-body docking. The IFACE term also helps the scoring function. Though its weight is roughly similar to that obtained for ACE, training the scoring function without the IFACE term yields lower success rates, though higher than those from the original ZRANK weights (data not shown).
There have been several recent studies that have utilized scoring functions specifically for protein docking refinement. The program FireDock32 employs two different weighted functions (one for enzyme/inhibitor systems, and one for antibody-antigen systems), each with 11 terms to score refined predictions (after rigid-body and side chain refinement).
Compared with this, the scoring function of ZRANK is simpler and does not use separate weights for different types of protein complexes. Another recently developed scoring function, EMPIRE,33 uses an eight term scoring function and a separate side chain energy function, in conjunction with rotamer modeling and CHARMM energy minimization.34 In that case, the structural improvement of the predictions was more limited than used in this study as it employs CHARMM energy minimization rather than the RosettaDock 6D search.
Future work includes incorporating backbone movements into the refinement search, to overcome limitations imposed by backbone conformational change at the binding interface. Also, the RosettaDock refinement algorithm can possibly be modified to search more quickly and just a subset of mobile side chains, so that more predictions can be effectively processed. This way the remaining cases from the docking benchmark can conceivably be included (those with hits and near-hits ranked greater than 20) to improve the docking performance on these cases.
In summary, we have shown that it is possible to combine the protein docking tools ZDOCK, RosettaDock, and ZRANK in a systematic manner to improve the success across a set of cases from a docking benchmark. In this approach, the ZRANK algorithm was found to be effective at rescoring the refined models from RosettaDock, in particular when utilizing a function specifically trained for refined models.
Acknowledgements
The authors would like to thank Julian Mintseris, Kevin Wiehe, and Jaafar Haidar for helpful discussions. We are grateful to the Scientific Computing Facilities at Boston University and the Advanced Biomedical Computing Center at NCI, NIH for computing support. This work was funded by NSF grants DBI-0078194, DBI-0133834 and DBI-0116574.
References
- 1.Berman HM, Westbrook J, Feng Z, Gilliland G, Bhat TN, Weissig H, Shindyalov IN, Bourne PE. The Protein Data Bank. Nucleic Acids Res. 2000;28(1):235–242. doi: 10.1093/nar/28.1.235. [DOI] [PMC free article] [PubMed] [Google Scholar]
- 2.Chandonia JM, Brenner SE. The impact of structural genomics: expectations and outcomes. Science. 2006;311(5759):347–351. doi: 10.1126/science.1121018. [DOI] [PubMed] [Google Scholar]
- 3.Gray JJ. High-resolution protein-protein docking. Curr Opin Struct Biol. 2006;16(2):183–193. doi: 10.1016/j.sbi.2006.03.003. [DOI] [PubMed] [Google Scholar]
- 4.Smith GR, Sternberg MJ. Prediction of protein-protein interactions by docking methods. Curr Opin Struct Biol. 2002;12(1):28–35. doi: 10.1016/s0959-440x(02)00285-3. [DOI] [PubMed] [Google Scholar]
- 5.Katchalski-Katzir E, Shariv I, Eisenstein M, Friesem AA, Aflalo C, Vakser IA. Molecular surface recognition: determination of geometric fit between proteins and their ligands by correlation techniques. Proc Natl Acad Sci U S A. 1992;89(6):2195–2199. doi: 10.1073/pnas.89.6.2195. [DOI] [PMC free article] [PubMed] [Google Scholar]
- 6.Chen R, Weng Z. Docking unbound proteins using shape complementarity, desolvation, and electrostatics. Proteins. 2002;47(3):281–294. doi: 10.1002/prot.10092. [DOI] [PubMed] [Google Scholar]
- 7.Gabb HA, Jackson RM, Sternberg MJ. Modelling protein docking using shape complementarity, electrostatics and biochemical information. J Mol Biol. 1997;272(1):106–120. doi: 10.1006/jmbi.1997.1203. [DOI] [PubMed] [Google Scholar]
- 8.Gray JJ, Moughon S, Wang C, Schueler-Furman O, Kuhlman B, Rohl CA, Baker D. Protein-protein docking with simultaneous optimization of rigid-body displacement and side-chain conformations. J Mol Biol. 2003;331(1):281–299. doi: 10.1016/s0022-2836(03)00670-3. [DOI] [PubMed] [Google Scholar]
- 9.Fernandez-Recio J, Totrov M, Abagyan R. ICM-DISCO docking by global energy optimization with fully flexible side-chains. Proteins. 2003;52(1):113–117. doi: 10.1002/prot.10383. [DOI] [PubMed] [Google Scholar]
- 10.Comeau SR, Gatchell DW, Vajda S, Camacho CJ. ClusPro: an automated docking and discrimination method for the prediction of protein complexes. Bioinformatics. 2004;20(1):45–50. doi: 10.1093/bioinformatics/btg371. [DOI] [PubMed] [Google Scholar]
- 11.Tong W, Weng Z. Clustering protein-protein docking predictions. Conf Proc IEEE Eng Med Biol Soc. 2004;4:2999–3002. doi: 10.1109/IEMBS.2004.1403850. [DOI] [PubMed] [Google Scholar]
- 12.Duan Y, Reddy BV, Kaznessis YN. Physicochemical and residue conservation calculations to improve the ranking of protein-protein docking solutions. Protein Sci. 2005;14(2):316–328. doi: 10.1110/ps.04941505. [DOI] [PMC free article] [PubMed] [Google Scholar]
- 13.Jackson RM, Gabb HA, Sternberg MJ. Rapid refinement of protein interfaces incorporating solvation: application to the docking problem. J Mol Biol. 1998;276(1):265–285. doi: 10.1006/jmbi.1997.1519. [DOI] [PubMed] [Google Scholar]
- 14.Chen R, Li L, Weng Z. ZDOCK: an initial-stage protein-docking algorithm. Proteins. 2003;52(1):80–87. doi: 10.1002/prot.10389. [DOI] [PubMed] [Google Scholar]
- 15.Wiehe K, Pierce B, Mintseris J, Tong WW, Anderson R, Chen R, Weng Z. ZDOCK and RDOCK performance in CAPRI rounds 3, 4, and 5. Proteins. 2005;60(2):207–213. doi: 10.1002/prot.20559. [DOI] [PubMed] [Google Scholar]
- 16.Wiehe K, Pierce B, Tong WW, Hwang H, Mintseris J, Weng Z. The performance of ZDOCK and ZRANK in rounds 6−11 of CAPRI. Proteins. 2007 doi: 10.1002/prot.21747. [DOI] [PubMed] [Google Scholar]
- 17.Lorenzen S, Zhang Y. Identification of near-native structures by clustering protein docking conformations. Proteins. 2007;68(1):187–194. doi: 10.1002/prot.21442. [DOI] [PubMed] [Google Scholar]
- 18.Li L, Chen R, Weng Z. RDOCK: refinement of rigid-body protein docking predictions. Proteins. 2003;53(3):693–707. doi: 10.1002/prot.10460. [DOI] [PubMed] [Google Scholar]
- 19.Pierce B, Weng Z. ZRANK: reranking protein docking predictions with an optimized energy function. Proteins. 2007;67(4):1078–1086. doi: 10.1002/prot.21373. [DOI] [PubMed] [Google Scholar]
- 20.Mintseris J, Wiehe K, Pierce B, Anderson R, Chen R, Janin J, Weng Z. Protein-Protein Docking Benchmark 2.0: an update. Proteins. 2005;60(2):214–216. doi: 10.1002/prot.20560. [DOI] [PubMed] [Google Scholar]
- 21.Daily MD, Masica D, Sivasubramanian A, Somarouthu S, Gray JJ. CAPRI rounds 3−5 reveal promising successes and future challenges for RosettaDock. Proteins. 2005;60(2):181–186. doi: 10.1002/prot.20555. [DOI] [PubMed] [Google Scholar]
- 22.Mintseris J, Pierce B, Wiehe K, Anderson R, Chen R, Weng Z. Integrating statistical pair potentials into protein complex prediction. Proteins. 2007 doi: 10.1002/prot.21502. [DOI] [PubMed] [Google Scholar]
- 23.Wang C, Schueler-Furman O, Baker D. Improved side-chain modeling for protein-protein docking. Protein Sci. 2005;14(5):1328–1339. doi: 10.1110/ps.041222905. [DOI] [PMC free article] [PubMed] [Google Scholar]
- 24.Schueler-Furman O, Wang C, Baker D. Progress in protein-protein docking: atomic resolution predictions in the CAPRI experiment using RosettaDock with an improved treatment of side-chain flexibility. Proteins. 2005;60(2):187–194. doi: 10.1002/prot.20556. [DOI] [PubMed] [Google Scholar]
- 25.Mintseris J, Weng Z. Optimizing protein representations with information theory. Genome Inform Ser Workshop Genome Inform. 2004;15(1):160–169. [PubMed] [Google Scholar]
- 26.Chen R, Weng Z. A novel shape complementarity scoring function for protein-protein docking. Proteins. 2003;51(3):397–408. doi: 10.1002/prot.10334. [DOI] [PubMed] [Google Scholar]
- 27.Zhang C, Chen J, DeLisi C. Protein-protein recognition: exploring the energy funnels near the binding sites. Proteins. 1999;34(2):255–267. [PubMed] [Google Scholar]
- 28.Tovchigrechko A, Vakser IA. How common is the funnel-like energy landscape in protein-protein interactions? Protein Sci. 2001;10(8):1572–1583. doi: 10.1110/ps.8701. [DOI] [PMC free article] [PubMed] [Google Scholar]
- 29.Tsai CJ, Kumar S, Ma B, Nussinov R. Folding funnels, binding funnels, and protein function. Protein Sci. 1999;8(6):1181–1190. doi: 10.1110/ps.8.6.1181. [DOI] [PMC free article] [PubMed] [Google Scholar]
- 30.Zhang C, Vasmatzis G, Cornette JL, DeLisi C. Determination of atomic desolvation energies from the structures of crystallized proteins. J Mol Biol. 1997;267(3):707–726. doi: 10.1006/jmbi.1996.0859. [DOI] [PubMed] [Google Scholar]
- 31.Janin J, Henrick K, Moult J, Eyck LT, Sternberg MJ, Vajda S, Vakser I, Wodak SJ. CAPRI: a Critical Assessment of PRedicted Interactions. Proteins. 2003;52(1):2–9. doi: 10.1002/prot.10381. [DOI] [PubMed] [Google Scholar]
- 32.Andrusier N, Nussinov R, Wolfson HJ. FireDock: Fast interaction refinement in molecular docking. Proteins. 2007 doi: 10.1002/prot.21495. [DOI] [PubMed] [Google Scholar]
- 33.Liang S, Liu S, Zhang C, Zhou Y. A simple reference state makes a significant improvement in near-native selections from structurally refined docking decoys. Proteins. 2007 doi: 10.1002/prot.21498. [DOI] [PMC free article] [PubMed] [Google Scholar]
- 34.Brooks BR, Bruccoleri RE, Olafson BD, States DJ, Swaminathan S, Karplus M. CHARMM: A program for macromolecular energy, minimization, and dynamics calculations. Journal of Computational Chemistry. 1983;4:187–217. [Google Scholar]
- 35.Delano WL. The PyMOL Molecular Graphics System. 2002.


