

Abstract
The multiple scattering extensions of the pulsed field gradient (PFG) experiments can be used to characterize restriction-induced anisotropy at different length scales. In double-PFG acquisitions that involve two pairs of diffusion gradient pulses, the dependence of the MR signal attenuation on the angle between the two gradients is a signature of restriction that can be observed even at low gradient strengths. In this article, a comprehensive theoretical treatment of the double-PFG observation of restricted diffusion is presented. In the first part of the article, the problem is treated for arbitrarily shaped pores under idealized experimental conditions, comprising infinitesimally narrow gradient pulses with long separation times and long or vanishing mixing times. New insights are obtained when the treatment is applied to simple pore shapes of spheres, ellipsoids, and capped cylinders. The capped cylinder geometry is considered in the second part of the article where the solution for a double-PFG experiment with arbitrary experimental parameters is introduced. Although compartment shape anisotropy (CSA) is emphasized here, the findings of this article can be used in gleaning the volume, eccentricity, and orientation distribution function associated with ensembles of anisotropic compartments using double-PFG acquisitions with arbitrary experimental parameters.
Keywords: double, PGSE, PFG, scattering, multiple, wavevector, pore size, shape, eccentricity, microscopic, anisotropy, general gradient waveform
1 Introduction
Heterogeneous specimens contain several different species of molecules, which may be in different phases. In one scenario, a population of enclaves within a solid matrix may be filled with a liquid whose molecules possess nuclear magnetism, hence are MR observable. When the time scale of the MR experiment is sufficiently long for a significant portion of the molecules to probe the pore-grain interface, the effect of molecular diffusion on the MR signal can be quantified to procure information about the porous structure.
The incorporation of pulsed gradients into standard MR pulse sequences [1] has made it possible to enhance the effects of diffusion on the MR signal intensity in a controllable manner. In its most widely employed form, these pulsed field gradient (PFG) experiments comprise one pair of gradients to encode displacements that occur between the application of the two pulses. Such experiments will be referred to hereafter as single-PFG acquisitions.
Among other information, the anisotropy of the pores can be obtained as a result of the restricting character of the solid host domain. However, in random media, the orientation of the pores is randomly distributed, making the single-PFG MR signal invariant to changes in the direction of the gradients. Consequently, the measured anisotropy in single-PFG acquisitions emerges from the interplay between the anisotropy of the compartments (hereafter referred to as compartment shape anisotropy, CSA) and the coherence in the population of these compartments (hereafter referred to as ensemble anisotropy, EA). Therefore, single-PFG MR provides a feasible means to characterize any coherence in the orientation of restricting domains.
This observation has proven to be particularly significant for biological applications of MR. In fact, the orientational dependence (anisotropy) of the diffusion-weighted MR signal intensity has been exploited to generate exquisite contrast between white- and gray-matter regions of the brain [2, 3]. Further, when there is significant anisotropy in the MR signal, the voxel-averaged orientation of the cells can be computed, and anatomical connections between different regions of the brain can be mapped [4, 5]. As established by experimental investigations, anisotropy observed in neural tissue specimens via single-PFG acquisitions is primarily a product of the interaction between cellular membranes and diffusing water molecules, suggesting the restricting character of the cellular membranes [6, 7]. Thus, such anisotropy is observed when the cells have an elongated shape. Moreover, any incoherence in the orientation of a collection of cells leads to a decrease in the observed anisotropy [3].
Although single-PFG has been successful in characterizing the coherence (EA) of pores with CSA, the deduced anisotropy information is compromised due to the influence of one type of anisotropy on the other. Therefore, decoupling various mechanisms of anisotropy could be very useful in obtaining information about the shape of the cells and, independently, an orientation distribution function for the population of cells within the voxel.
A natural extension of single-PFG acquisitions could decouple the effects of different mechanisms of anisotropy. This extension is achieved by applying two pairs of diffusion gradients [8] separated from each other by a mixing time, tm, and will be referred to as double-PFG acquisitions. A spin echo version of such a pulse sequence is illustrated in Figure 1. Variants of this double-PFG sequence have been considered for and employed in a host of different applications [9, 10, 11, 12, 13, 14, 15, 16].
Figure 1.

The spin-echo version of the double-PFG experiment. The radiofrequency (RF) pulses are depicted using black boxes, whereas blank rectangles illustrate the diffusion-sensitizing gradient pulses, denoted by the gradient vectors G1 and G2, with durations δ1 and δ2, respectively Δ1 and Δ2 denote the separation of the two pulses in the respective PFG blocks. The two encoding blocks are separated from each other by the mixing time, tm.
An early theoretical investigation of the effects of restricted diffusion on the double-PFG signal suggested that even for isotropically distributed pores, the MR signal intensity may be dependent on the angle between the two gradients of the double-PFG sequence [17]. This early work predicted that angular dependence at long mixing times would be observed only when the compartments were non-spherical. Moreover, at short mixing times, even spherical pores exhibited such an angular dependence. This result points to yet another mechanism of anisotropy, called microscopic anisotropy (μA). This kind of anisotropy was predicted to influence the signal even at very low diffusion weightings [17], and suggested a means of obtaining a signature for restricted diffusion conveniently, because the presence of μA is tantamount to the existence of restrictions.
Figure 2 illustrates when these three different mechanisms of anisotropy may be encountered. When the cells are spherical, only μA can be observed. A randomly oriented population of anisotropic cells will, in addition, exhibit CSA. Finally, if the anisotropic cells have any orientational preference in their alignment, all three mechanisms of diffusion anisotropy —μA, CSA, and EA— coexist.
Figure 2.

Three different scenarios for diffusion anisotropy. On the left is a population of isotropic pores that exhibits only microscopic anisotropy (μA) at a subcompartmental length scale induced by the restricting walls. If the pores have an elongated structure, the specimen is said to possess compartment shape anisotropy (CSA) as well. The center image depicts a randomly distributed population of such compartments. The panel on the right has a different arrangement of the same pores where all pores are coherently oriented. When there is any coherence in the orientation of the anisotropic pores, the specimen additionally exhibits ensemble anisotropy (EA).
Diffusion-induced anisotropy of the signal is not the only signature for restricted diffusion that double-PFG experiments provide. Similar to the case in single-PFG acquisitions [18], the double-PFG signal, when plotted against the gradient strength, does not decay monotonically—a phenomenon called diffusion-diffraction [19]. In addition, double-PFG signal at short mixing times was predicted to become negative at a gradient strength smaller than that necessary to observe the non-monotonicity in single-PFG MR acquisitions. Moreover, unlike the diffraction wells in single-PFG acquisitions, the zero-crossing of the double-PFG signal decay curves was shown to be robust to the heterogeneity of the specimen [19]. These predictions were recently validated experimentally [20].
In a recent study [21], a theoretical treatment for the detection of μA via double-PFG experiments was presented. There, the emphasis was placed on the quadratic term in a Taylor series expansion of the signal, which exhibited μA. The analysis did not make any assumption regarding the experimental timing parameters, and significant changes in the estimates of compartment size were predicted if double-PFG data was analyzed using the formulations in Ref. [17], which assumed limiting values for the experimental timing parameters. More recently, Shemesh et al. confirmed experimentally that accurate size estimates are feasible only when the experimental parameters were accounted for, as long as the diffusion time is not extraordinarily short [22]. In Ref. [21], the need to decouple the effects of EA and μA was recognized and a scheme to do so was introduced.
Following Mitra's recognition for the prospect of resolving CSA in a randomly distributed ensemble of pores [17], Cheng and Cory performed experiments on elongated yeast cells, and reported successful delineation of cell eccentricity using double-PFG MR at long mixing times [23]. In their analysis, the cells were assumed to be ellipsoids of revolution, and cell size and eccentricity were estimated by using data obtained by setting the angle between the two gradients to 0° and 90°. The brief analytical treatment in Ref. [23] made the same assumptions as in Ref. [17] regarding the experimental timing parameters. It is surprising that despite its far reaching implications, the double-PFG experiments have not been studied extensively to assess the CSA.
In this article, we provide a comprehensive theoretical treatment of the problem of double-PFG experiments by extending the theory of restricted diffusion to account for CSA as well. In the next section, we set the experimental timing parameters to their limiting values. The derivations are based on arbitrary pore shapes, although two symmetry conditions were imposed in obtaining a Taylor series representation of the signal intensity for simplicity. Explicit relations up to the fourth-order term in a Taylor series expansion of the signal are provided. Then more specific pore geometries consisting of spherical, ellipsoidal, and cylindrical pores are considered for which solutions can be obtained for arbitrary gradient strengths. In the subsequent section, we derive a general solution of the double-PFG acquisition that takes all experimental conditions of the acquisition into account. These formulations are based on a recent generalization [24] of the multiple correlation function method [25, 26].
2 Double-PFG MR in “ideal” experimental conditions
It is a formidable task to derive a general signal attenuation expression for the double-PFG acquisitions with arbitrary experimental parameters and for arbitrarily shaped pores. Therefore, as mentioned in the Introduction, a number of simplifying assumptions have been made in the past. In this section we shall address the problem in ideal experimental parameters, i.e., when infinitesimally narrow diffusion pulses (δ = 0), separated from each other by infinitely long diffusion times (Δ → ∞), are employed. Moreover, the mixing time is considered to be either infinitely long (tm → ∞) or vanishing (tm = 0). Let us define a vector quantity, q, to be the time integral of a gradient pulse multiplied by (2π)−1γ, where γ is the gyromagnetic ratio of the spins being examined. Clearly, for rectangular pulses, q = (2π)−1γδG, where δ is the duration of a gradient pulse defined by the gradient vector, G. For simplicity, we assume that the q-vectors used in the two PFG blocks of the double-PFG acquisition have the same magnitude, i.e., q ≔ |q1| = |q2|. Further we shall denote by v̂ the unit vector parallel to a vector v, e.g., q1 = qq̂1.
2.1 General pore shapes
2.1.1 Arbitrary q-values
We start by considering arbitrary pore shapes and q-values. Let V denote the volume of the pore space. The double-PFG MR signal at ideal experimental conditions with infinitely long mixing times is given by [17, 19]
| (1) |
where q1 and q2 are the wavevectors in the first and second PFG blocks, respectively. The function ρ˜(q) is defined by the relation
| (2) |
where ρ(r) is the initial spin density. The signal intensity at vanishing mixing times is also given in terms of this function to be [17, 19]
| (3) |
Note that the above relationships yield the MR signal attenuation for a single pore oriented in a particular way, or equivalently, when all pores are identical and coherently oriented.
A more general scenario involves a distribution of pore orientations. In this case, the MR signal can be evaluated by taking the orientational average of the above expressions. Such an operation will be denoted by 〈.〉Ωˆ. When the pores possess a symmetry axis, the direction of that axis uniquely determines the orientational state of the pore. In this case, orientational averaging can be performed by an integral over the surface of the unit sphere, i.e.,
| (4) |
where û denotes the orientation of the symmetry axis of a particular pore, and f(û) is the pore orientation distribution function defined over the surface of the unit sphere, denoted by S. It should be noted that we dropped the subscript of E as the above expression applies to all values of the experimental parameters including tm.
As demonstrated in Ref. [21], a convenient representation of the orientation distribution function is given in terms of spherical harmonics by
| (5) |
where the terms corresponding to odd-l values were dropped under the assumption that f(û) is antipodally symmetric. It should be noted that f00 is always equal to (4π)−1/2 as a result of the normalization condition for f(û). When Eq. 5 is inserted into Eq. 4, one obtains the expansion
| (6) |
where
| (7) |
Note that this term is independent of any coherence in the orientation of the pores in the ensemble, and thus immune to EA. Therefore, the separation of this term is of particular interest for the problem tackled in this article, as it provides a way to decouple EA and other kinds of anisotropy. In fact, this scheme was proposed first in Ref. [21] to isolate the effects of μA and EA.
2.1.2 Small q-values
To elucidate salient characteristics of the MR signal, a Taylor series expansion of the MR signal decay up to the fourth order term is employed in this section. When this is done, the results are applicable in a limited range of q-values; therefore the findings of this section will primarily be used for pedagogical purposes. To this end, we start by considering arbitrary pore shapes. However, as outlined below, a significant simplification of the problem is achieved when the pores are assumed to possess a symmetry axis, and when the pore shape is symmetric under reflections about its center of gravity.
The ρ˜(q) function defined above can be expanded in a Taylor series around q = 0, yielding the expression
| (8) |
where a is the longest end-to-end distance in the pore. We dropped the odd ordered terms assuming that the pore is symmetric under reflections about its center of gravity. The functions A(q̂), and B(q̂) are given by
| (9a) |
| (9b) |
where we have taken ρ(r) = V−1. The orientationally averaged double-PFG MR signal at small values of 2πqa, and long mixing times is given by
| (10) |
Since a scheme of removing the effects of EA has already been introduced above, we can focus on the EA-independent “component” of the signal, which is the same expression as that obtained for isotropically (e.g., randomly) distributed pores. Again we make the assumption that the pores possess a symmetry axis; rotations around this axis do not change the geometry. In this case, the signal intensity can be written as
| (11) |
The isotropic orientational averaging can be performed on a term-by-term basis. Moreover, in the evaluation of 〈A(q̂) 〉 iso, 〈B(q̂) 〉 iso, and 〈A(q̂)2〉 iso, instead of being integrated over different pore orientations, the pore orientation can be held constant, and the integral can be performed over the gradient direction, i.e.,
| (12) |
| (13) |
| (14) |
where V0 denotes the volume occupied by the pore oriented in a particular direction. Note that the arguments of A and B were dropped for brevity.
The remaining quantity 〈A12〉iso ≔ 〈A(q̂1)A(q̂2) 〉iso is given by the similar expression
| (15) |
However, this expression is not immediately useful because as q̂1 is varied, q̂2 should vary accordingly. Therefore, it is convenient to decompose q̂2 into components parallel and perpendicular to q̂1, i.e.,q̂2, = q̂1 cos ψ + q̂⊥ sin ψ, where ψ is the angle between q̂1 and q̂2, and q̂⊥ is a unit vector perpendicular to q̂1, i.e. |q̂⊥| = 1, and q̂⊥ · q̂1 = 0. When the expression
| (16) |
is inserted into Eq. 15, the contribution from the sin(2ψ) term vanishes as a result of the symmetry about the center of gravity of the pore. Therefore, 〈A12〉iso is given by
| (17) |
where
| (18) |
In the evaluation of this expression, q̂⊥ should always remain perpendicular to q̂ in the same sense. Assume that at a particular instance, when q̂ is the unit direction along the z-axis, q̂⊥ is oriented along x̂ The transformation that converts ẑ into an arbitrary orientation,
| (19) |
where θ and ϕ are, respectively, the polar and azimuthal angles, is the rotation around the axis (−sin ϕ, cos ϕ, 0)T by an angle θ. The same rotation will transform x̂ into the orientation
| (20) |
With these definitions, inserting Eq. 17 into Eq. 11 yields a signal attenuation of
| (21) |
at long mixing times.
The double-PFG signal intensity at short mixing times can be calculated using essentially the same procedure and definitions. The details of this derivation are not provided. The result is given by
| (22) |
It should be noted that the quadratic terms in the above expressions are consistent with previous work. The quadratic term at tm = 0 has an angular dependence characterized by the function (2 + cos ψ) as first demonstrated by Mitra in Ref. [17]. The angular independence of the quadratic term for the experiment at long mixing times had also been predicted by Mitra who suggested that the fourth-order term in this regime would exhibit angular dependence only if the pores were anisotropic. This finding is also consistent with Eq. 21 above as 〈A2〉iso = 〈A⊥〉iso for spherical pores. Note that this equation indicates in addition that the “angular frequency” of 〈E∞〉iso is twice that in the quadratic term of 〈E0〉iso Interestingly, the cos(2ψ) dependence emerges in the fourth-order term of 〈E0〉iso as well. However, cos(2ψ) dependent terms do not cancel for isotropic (spherical) pores at short mixing times.
2.2 Special pore shapes
In this section, we shall provide explicit relationships for the three special pore shapes illustrated in Figure 3. The first case involves a spherical pore of radius R0. The second geometry is obtained by isotropically distributing ellipsoids of revolution with semi axes of b, b, and c. Clearly, when c > b, one obtains a prolate ellipsoid, whereas oblate shapes are obtained when b > c. The third geometry contains an isotropic distribution of capped cylinders of radius r0 and length L. We shall express the CSA of the latter two geometries via defining a quantity ε = c/b in the case of ellipsoidal pores, and ε = L/(2r0) in the case of cylindrical pores. Clearly, the spherical pore is just a special case of the ellipsoidal pore with c = R0 and ε = 1.
Figure 3.

Special geometries considered in this article. Left: sphere of radius R0. Middle: ellipsoid of revolution (spheroid) of semi axes b, b, and c. Right: capped cylinder of radius r0, and length L. The angle between the two gradient vectors is denoted by ψ.
For arbitrary q-values, Eqs. 1-3 can be used to calculate the signal when the pore is oriented along an arbitrary direction. The relevant ρ˜(q) functions, for the considered geometries of spherical (sph), ellipsoidal (ell), and cylindrical (cyl) pores, are given by [19, 27]
| (23a) |
| (23b) |
| (23c) |
where in the expressions for ellipsoidal as well as cylindrical pores, q∥ and q⊥ are the components of q parallel and perpendicular to the symmetry axis, respectively. Moreover, . Once the signal attenuation for a particular pore orientation is obtained, 〈E〉iso can be evaluated using Eq. 7.
The Taylor series expansions for the signal attenuation are obtained using the relations derived in the previous section. At long mixing times, these expressions are given after some algebra by
| (24a) |
| (24b) |
| (24c) |
The relevant expressions for vanishing mixing times are obtained similarly, and given by
| (25a) |
| (25b) |
| (25c) |
The correctness of the above expressions for the ellipsoidal pores can be verified by setting b = c = R0, and comparing the result with the much simpler solutions obtained for spherical pores. Further, Cheng and Cory reported [23] that in randomly oriented ellipsoidal pores, the difference between the signal values at ψ = 0° and ψ = 90° is 2(2πq)4(b2 − c2)2/375. They also applied this relationship on data collected from elongated yeast cells and observed that the results are in reasonable agreement with their estimates from microscopic images of the same specimen. Note that the relationship they employed is consistent with Eq. 24b.
3 Double-PFG MR with arbitrary experimental parameters
The treatment above considered only limiting cases for the experimental timing parameters. Because of its simplicity, studying this regime is advantageous in understanding the main features of the MR signal decay. However, quantitatively accurate estimates of pore size and eccentricity are impossible to achieve when the true experimental parameters are not taken into consideration; the main goal of this section is to address this issue.
When a general MR experiment is considered, the full eigenspectrum of the Laplacian operator for the particular geometry influences the resulting signal attenuation. However, the eigenproblem was studied analytically only for simple geometries such as infinite parallel plates, infinite cylinders, and spheres. The capped cylinder geometry considered in this article is particularly well-suited to study the effects of experimental timing parameters on the resolution of CSA, because this geometry can be envisioned as a combination of two parallel plates and a cylinder; such a decomposition is possible thanks to the separation of variables.
A series of theoretical developments [28, 29, 30], inspired by Robertson's original description [31], led to the formulation of the multiple correlation function (MCF) framework [25, 26] that enables the derivation of analytical expressions for the diffusion-attenuated MR signal. The MCF approach yields approximate relations for general gradient waveforms, and exact expressions when the gradient waveform is piecewise constant. This technique was recently generalized to handle variations in the orientation of the gradients during the course of the MR pulse sequence [24] making it applicable to problems such as that considered in this article where the focus is on the dependence of the signal intensity on the angle between the two gradients of the double-PFG sequence.
The MCF technique employs the eigenfunctions of the Laplace operator, i.e., the solutions of the eigenproblem
| (26) |
where r is the position variable, D0 is the diffusivity, and λkmn is the eigenvalue specified by the indices k, m, and n corresponding to the eigenvector denoted by 〈r|kmn〉 in Dirac's bra-ket notation. We assume that these eigenfunctions obey the reflective (Neumann) boundary condition on the pore-grain interface and note that wall relaxation can be incorporated into the MCF framework using the scheme in Ref. [32]. In this section, we shall start by considering the capped cylinder geometry whose symmetry axis is oriented along the z-direction. In this case, the z-variable can be separated from the transverse polar coordinates, r and ϕ, so that 〈r|kmn〉 = 〈z|k〉 〈r,ϕ|mn〉, and the corresponding eigenvalue is given by
| (27) |
where αmn is the n-th zero of the derivative of the m-th order Bessel function.
Consider a pulse sequence with N intervals, so that during the j-th interval, whose duration is denoted by δj, the corresponding gradient vector, denoted by Gj, is constant and leads to the q-vector, qj = (2π)−1γδ jGj. The resulting MR signal can be simply written to be
| (28) |
where
| (29) |
In the above expression, Λ is an infinite-dimensional diagonal matrix whose elements are proportional to the eigenvalues, i.e.,
| (30) |
and F is a vector operator whose (kmn, k′m′n′)-th component is given by
| (31) |
for the three-dimensional capped cylinder geometry considered here. The components of the matrices Ta and P are provided in Ref. [25], whereas the elements of Tb are derived from those of Ta in Ref. [24]. Here we reproduce them for completeness:
| (32a) |
| (32b) |
| (32c) |
where
| (33a) |
| (33b) |
Clearly, the matrix Λ can be written as
| (34) |
where the components of Λ‖, and Λ⊥ are given by
| (35a) |
| (35b) |
This decomposition makes a similar decomposition for Mj possible:
| (36) |
where
| (37a) |
| (37b) |
where we dropped the “†” sign as P, Ta, and Tb are all Hermitian. Using the expressions above, it is straightforward to show that Mj‖ commutes with Mj⊥. Therefore,
| (38) |
More generally, note that
| (39) |
Employing the above identities in Eq. 28 yields
| (40) |
where
| (41a) |
| (41b) |
where q‖ is the component of the qj-vector along the cylinder's symmetry axis, whereas qja and qjb are the components of qj perpendicular to each other and to the lateral surface of the cylinder. When the cylinder is oriented along an arbitrary direction û, specified by the polar angle θ and the azimuthal angle ϕ, the decomposition of qj can be obtained through the dot products
| (42a) |
| (42b) |
| (42c) |
where
| (43a) |
| (43b) |
| (43c) |
Eq. 40 suggests that the separation of variables in the eigenproblem of Eq. 26 makes it possible to express the signal attenuation for a three-dimensional geometry obtained via an arbitrary gradient waveform as a product of signal decays due to one- and two-dimensional geometries. This fact was used somewhat intrinsically in Ref. [33].
When the double-PFG experiment depicted in Figure 1 is concerned, the “∥”, and “⊥” components of E can be written in a straightforward manner as
| (44a) |
| (44b) |
where we have taken the duration (δ) and the separation (Δ) of the gradients in each PFG block to be the same. The product of E∥ and E⊥ as defined above yields E(q1, q2, û), which can be plugged into Eq. 6 to obtain the MR signal attenuation predicted for double-PFG acquisitions with arbitrary experimental parameters and for general distributions of cylindrical pores.
4 Simulations
In this section, we illustrate our findings based on the theory described above. All results are presented for the three special geometries considered. For meaningful comparison of the results for different geometries, we developed a unified definition for the q-value. This definition is obtained by setting the quadratic terms in the Taylor series expansion to be equal in all geometries yielding the relations between the dimensions of different pore shapes. The attenuation at very small q-values for different geometries is then approximately equal and on the same order of magnitude at higher q-values. Interestingly, the quadratic terms of the expressions for tm = 0 (Eqs. 25a-c) and tm→∞ (Eqs. 24a-c) yield the same correspondences in all geometries. The relevant expressions are
| (45a) |
| (45b) |
where ε = c/b for the ellipsoidal geometry and ε = L/(2r0) for the cylindrical pores as defined earlier. The correspondence relations above make it possible to define the q-values using the dimensionless quantity qR0 for all three geometries.
In addition, we shall define two simple quantities, μ and σ, which can be estimated from the MR signal profile through the relations
| (46a) |
| (46b) |
These quantities are expected to quantify different features of the angular double-PFG signal profile.
In Figure 4, the simulation results predicted for the double-PFG acquisitions with ideal experimental parameters are depicted. The signal attenuation profiles at long mixing times are shown in the left column; where in the right column are the signal profiles for vanishing mixing times. In the long mixing time regime, spherical pores exhibit no angular dependence (μ = σ = 1) even at very large q-values. When the simulations are repeated for isotropically distributed ellipsoids and cylinders (ε = 4), an angular dependence is observed. Note that the μ-values are still identically 1 for all q-values considered. On the other hand, σ values, which are approximately 1 at small q, increase with increasing q-values. Therefore, an angular dependence at long mixing times and reasonably high q-values can be considered to be a signature for CSA.
Figure 4.

The double-PFG NMR signal at long (left column) and vanishing (right column) mixing times. The top row depicts the signal attenuation values for spherical pores of radius R0 at five different q-values. Corresponding signal attenuation profiles for randomly oriented ellipsoidal pores with ε = c/b = 4 are demonstrated in the middle row. Finally, the bottom row shows the signal attenuation profiles for randomly oriented cylindrical pores with ε = L/(2r0) = 4. The q-values are chosen such that the quadratic term of the signal attenuation is the same in all geometries. The continuous and dotted portions of each curve correspond, respectively, to the positive and the negative signal values after taking their absolute values.
The profiles for short mixing times are generally more complicated than their counterparts in the tm → ∞ regime. In spherical pores, bell-shaped curves (μ > 1, σ < 1) appear at small q-values, which is a signature for restricted diffusion, or μA, at small tm-values. The profiles at high q-values are complicated by the diffraction-like features, which will be discussed below. The profiles for ellipsoidal and cylindrical pores suggest similar behavior at small values of qR0 However, when qR0 = 0.5, σ becomes larger than 1 as a result of the higher “frequency” oscillations of the signal. All of these findings could be predicted to some extent based on the Taylor series representation of the signal intensity.
The dotted sections of the curves in Figure 4 represent the absolute values of the negative-valued portions of the profiles. As predicted in [19], at long mixing times, the signal, when plotted as a function of q, rebounds from the horizontal axis (at qR0 ≃ 0.71 for spherical pores) and the signal is positive-valued throughout. The left column of Figure 4 is consistent with these predictions, which explain why the signal for spherical pores at qR0 = 0.75 is smaller than that at qR0 = 1. Note that the same behavior is not observed for the other geometries as a result of the smoothing effect of the heterogeneity of the specimen at long mixing times. Unlike the problem considered in Ref. [19]; however, this heterogeneity is not due to the variations in the pore sizes, but occurs as a result of orientational incoherence. Consistently with [19], at short mixing times, negative signal values are observed at half the q-value at which the signal rebounds in the long tm regime. Interestingly, the diffraction-related zero-crossing of the MR signal is predicted even for randomly distributed ellipsoids and cylinders, suggesting the robustness of the diffraction effects to the orientational dispersion of the pores.
In the simulations presented in Figure 4 as well as in those discussed below, the evaluation of the orientational average in Eqs. 6-7 was performed using an iterated Gaussian quadrature scheme with 48 transformation points. In principle, one can use the Taylor series representation as an alternative. To assess the performance of such an approach, in Figure 5 we plot the signal attenuation against the qR0 value. We show the results for ψ = 90° and note that similar curves were obtained for other angles. The solid lines show the actual attenuation curves, whereas the dotted line shows the approximation to the real values when the Taylor series is terminated after the quadratic term. Because of our definition for the q-value above, all three geometries share the same quadratic term, hence only one curve is plotted. When the fourth-order terms are included as well, the curves plotted with dashed lines are obtained. It is clear that these curves have only a very limited range of validity beyond what is already provided by the quadratic term. Further, in this range of validity, the signal attenuation values for spherical and anisotropic pores are very similar. Therefore, we conclude that, the Taylor series representation of the MR signal is unlikely to provide reliable resolution of CSA. Of course, the ability to incorporate arbitrary q-values has additional benefits. For example, in highly anisotropic pores, the error introduced by terminating the Taylor series at the fourth-order term is  ((2πqa)6), where a is the longest end-to-end distance, hence this error can be very large—larger than some of the terms in the fourth-order term in highly anisotropic pores.
Figure 5.

The signal attenuation plotted against the dimensionless q-value when the angle between the two gradients of the double-PFG experiment (ψ) was set to 90°. The plot on the left shows the results at long mixing times; the right panel depicts the signal attenuation curves when tm = 0. The continuous lines illustrate the correct signal values for the geometries of spherical, ellipsoidal, and cylindrical pores. Ellipsoidal and cylindrical pore geometries (with ε = 4) are obtained by isotropically distributing the respective anisotropic pores. The dotted curve depicts the signal up to the quadratic term, which, by choice, yields the same values for all three geometries. When the fourth-order term is also incorporated, one obtains the signal attenuation curves shown as dashed lines.
Now we shall focus on the double-PFG experiment at the long mixing time (tm → ∞) regime, and examine the effect of pore eccentricity on the angular signal profiles. The results for various values of ε for the randomly distributed populations of ellipsoidal and cylindrical pores are demon-strated in Figure 6. In these simulations qR0 is fixed at the value of 0.25. The curves plotted in red show the signal profiles for prolate shaped pores; those in green depict the signal profiles for oblate shaped pores. Finally, the black curves in both panels demonstrate the signal for ε = 1. Ellipsoids with an ε value of 1 are just spheres. Therefore, no angular variation is observed, as expected (σ = 1.000). Although very slight angular variation exists in the simulation of cylindrical pores with ε = 1 (σ = 1.003), the resulting fluctuation is too small and the corresponding curve is not distinguishable from a constant line. When the ε value is increased, in both geometries, prolate shaped pores yield larger angular contrast (e.g., in ellipsoidal pores, σ = 1.264 at ε = 1000, and σ = 1.097 at ε = 1/1000). In the case of prolate geometries, increasing ε beyond the value of 15 (σ = 1.258) led to only a slight change in the angular profiles. Similarly in the case of oblate pores, ε values smaller than 0.1 all yielded approximately the same profiles. These observations suggest that there is a finite range of CSA values that can be extracted from double-PFG signal at long mixing times. In other words, the inverse problem of obtaining the CSA value from the double-PFG signal is ill-posed if the pores are very anisotropic.
Figure 6.

The double-PFG signal attenuation at long mixing times (tm→∞, qR0 = 0.25) plotted against the angle between the two gradients (ψ). The simulated specimen is a randomly oriented ensemble of ellipsoidal (left) and cylindrical (right) pores with varying values of pore eccentricity, or compartment shape anisotropy. The red and green curves depict prolate and oblate pore shapes, respectively.
So far we discussed only isotropically distributed pores, which can be seen as the first component in a series formed with spherical harmonics when more general ensembles are encountered (see Eq. 6). On the other extreme is a population of perfectly coherent anisotropic pores. In this case, the solution is easier to obtain as no orientational averaging is necessary. In the top row of Figure 7 we show the signal profiles when an ensemble of ellipsoidal pores is coherently oriented along the z-direction. In these simulations, the first gradient is set along the x-direction, and the direction of the second gradient is specified by the polar angle θ, and the azimuthal angle ϕ We plot the signal against ϕ for various values of θ Clearly, for coherently oriented pores, the signal does not depend on ϕ at long mixing times although the angle between the two gradient directions does vary. However, one obtains different values for different polar angles, which can be considered a signature for EA. This behavior is very similar to what is obtained in single-PFG acquisitions and enables the extraction of the orientation of the pores.
Figure 7.
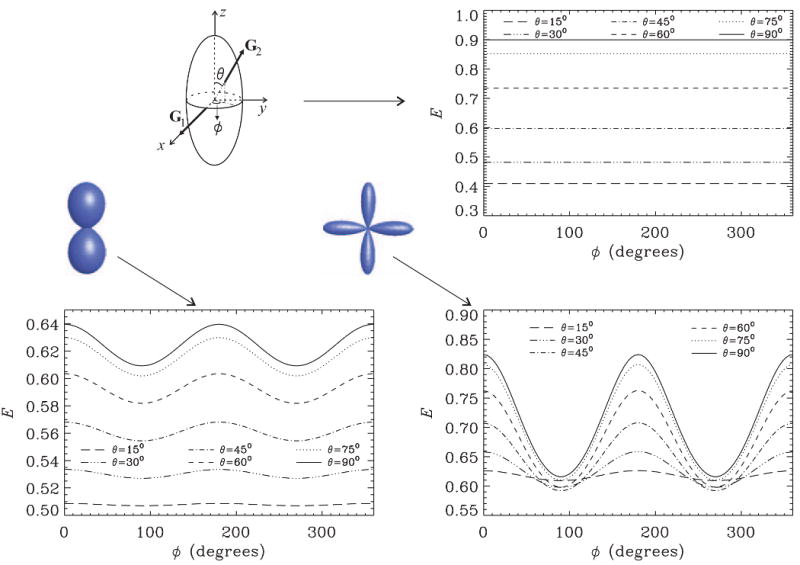
The double-PFG signal at long mixing times (tm→∞, qR0 = 0.2) for spheroidal pores with ε= 4. The first gradient is fixed along the x-direction; the orientation of the second gradient is specified by the polar angle θ and the azimuthal angle ϕ The top panel in the right column depicts the signal profiles for pores coherently oriented along the z-axis. The left panel in the bottom row shows the signal profiles for an ensemble of pores whose mean orientation is along the z-axis, but suffers from some angular dispersion. The panel on the right side of bottom row depicts the signal profiles when a bimodal distribution of pore orientations is considered where the two modes are centered around the y- and z-axes, respectively. The glyphs illustrate the orientation distribution functions assumed in the plots in the bottom row.
The left panel of the bottom row of Figure 7 illustrates the corresponding plots for an ensemble of pores whose orientations are distributed around the z-direction. The underlying orientation distribution function is described by a second order Cartesian tensor whose principal eigenvalue was taken to be 5 times the other two eigenvalues. In obtaining the flm coefficients corresponding to the Cartesian tensor, the relationships in Ref. [34] were employed. Clearly, angular features characteristic of CSA start to develop. To understand this, we consider only the curves drawn with continuous lines, which correspond to θ = 90°. In this case, the angle between the gradients, ψ, is equal to ϕ Note that when θ = 90°, the second gradient vector spans the intersection of the pore wall and the xy-plane. When the pores are coherently oriented, all such cross sections are circular, i.e., they do not possess shape anisotropy, leading to a constant value for the signal. However, when there is a distribution of pores, the curve that is defined by the intersection of the xy-plane and the ellipsoid is, in general, elliptical. Therefore, the CSA is observed for such ensembles. Finally, in the last panel of Figure 7, we simulate an ensemble comprising two fiber bundles, where the average orientations of the two bundles are along the y and z axes, respectively. Such an orientation distribution function was obtained from an eighth order spherical tensor, whose elements were computed using the techniques in Ref. [35]. The resulting angular dependence is due to the superposition of the effects of cross-sectional CSA of the bundle along the z-direction, and the EA of the bundle along the y-direction.
The geometry consisting of isotropically distributed cylinders with ε = 4 and qR0 = 0.2 (r0 = 2.5μm, L = 20μm, and q = 25.7mm−1) is used to demonstrate the effects of deviations in the experimental timing parameters from their ideal values. First, we show the effect of variations in the mixing times. As can be seen in the top panel of Figure 8, when tm is short, the bell-shaped curve characteristic of μA is predicted (μ = 1.512 and σ = 0.875 at tm = 1.5ms). This profile that resembles the −cos ψ function gradually evolves into a cos(2ψ)-like curve. When long tm-values are achieved, the correlation within each pore is lost, suppressing the effects of μA, and curves characteristic of CSA are observed (μ = 1.000 and σ = 1.090 at tm = 200ms). In the second panel of the same figure the effect of variations in Δ is shown when tm is taken to be relatively long. The angular contrast due to CSA is gradually lost as Δ is shortened (σ = 1.090 at Δ = 200ms, and σ = 1.021 at Δ = 15ms). However, prolonging the Δ values beyond 100ms does not create a significant change in the angular pattern. Finally, in the last panel we show the effects of variations in the diffusion pulse duration. A clearer delineation of the angular variations is possible if short gradient pulses are employed (σ = 1.091 at δ = 0.001ms, and σ =1.005 at δ = 150ms). Perhaps the most important observation in this panel is that even 1ms pulses appear to create a significant change in the signal profiles supporting the view that if experimental timing parameters are not considered, deviations from true values are unavoidable even when 1ms diffusion pulses are used.
Figure 8.

In all plots, an ensemble of randomly distributed cylindrical pores with ε = 4 is considered. The signal values at qR0 = 0.2 are plotted against the angle between the two gradients of the double-PFG experiment. Top panel: the effect of varying the mixing time when δ = 1ms, and Δ = 200ms. Middle panel: the effect of variations in the diffusion pulse separation when tm = 200ms, and δ = 1ms. Bottom panel: the effect of varying the diffusion pulse duration when the other timing parameters are set to tm = Δ = 200ms.
5 Discussion & Conclusion
The double-PFG observation of diffusion in anisotropic pores has been addressed to some extent in Ref. [21]. There, explicit relationships for the quadratic term of the signal decay was employed for isotropic compartments in one, two, and three dimensions; in all cases it was possible to denote the compartment size via a single variable. In addition, the solution for two-dimensional isotropic pores (circles) was combined with the solution for free diffusion to obtain the relevant expressions for infinitely long cylinders. Clearly, such a geometry can be considered to be a limiting case of the cylindrical as well as ellipsoidal pore shapes treated in this article. However, since only one size-variable was employed, CSA cannot be quantified using the formulations in Ref. [21]. One of the goals of this article was to expand the model to enable the estimation of CSA directly from double-PFG data. As discussed above, there is a limit to the anisotropy that can be quantified using the methods presented in this article and the above formulations are relevant for moderately anisotropic pores. Therefore, when the pores are very anisotropic, the techniques presented in Ref. [21] can also be employed to assess the diameter of the fibers.
In a recent study, the estimates for pore size were obtained from the quadratic term of the double-PFG MR signal attenuation [36] at short mixing times. Such an approach has serious limitations for at least two reasons. (i) The experiments are assumed to be performed in ideal experimental parameters. However, a more recent study [22] decisively established that in small pores, such as those relevant in the examinations of biological tissue, the finite duration of the pulses creates significant deviations in the size estimates; ≈ 20% deviations were reported in 5μm diameter tubes when the pulse duration was set to 7.5ms. (ii) Although the technique in Ref. [36], and its more recent variant in Ref. [37] are said to hold for arbitrary pore shapes, the estimated quantity, 〈r2〉 can be interpreted appropriately only if the underlying geometry is known. As we showed in the definition of a unified q-value above, identical values of 〈r2〉, hence the quadratic term, are possible in spherical and anisotropic pores. As the pore shape gets elongated, pores enclosing smaller volumes yield the same 〈r2〉 value. Therefore, the 〈r2〉 value estimated from the quadratic term of the signal decay has limited value by itself except when isotropic pores are considered as in Ref. [21]. In fact, the treatment in [21] does not suffer from the need to perform the experiment with ideal experimental parameters (point (i) above) either as all experimental timing parameters are incorporated. It should be noted that although the small q-value assumption employed in Ref. [21] as well as [36] can lead to some bias. This bias can be removed simply by computing the decay rate along each direction near the q = 0 point; this scheme was employed in Ref. [22]. An even better alternative that does not require acquisitions at different q-values is the scheme in Ref. [24]. Clearly, the incorporation of two size parameters, as was done in this work, enables a better interpretation of the underlying geometry for a greater range of pore shapes. Moreover, the assumption of cylindrical pore shape provides the further advantage that all experimental parameters can be taken into account.
The problem of characterizing the CSA becomes tractable when the pores are assumed to be ellipses or cylinders. However, incorporation of the experimental parameters was presented only for cylindrical pores. Figures 4-6 suggest that the predicted signal profiles for these geometries are very similar especially when the q-value is not very high. An important special case involves the spherical pores, or equivalently ellipsoidal pores with ε = 1. Although it is not a special case of cylindrical pores, the simulations of cylindrical pores with ε = 1 yield approximately constant signal profiles. This result suggests that if the specimen is composed of spherical compartments, and the model of cylindrical compartments was fitted, the estimate for L would be approximately equal to 2r0. This result justifies the definition ε = L/(2r0) for cylindrical pores. Based on the resemblance between the profiles for ellipsoidal and cylindrical pores, we can say that a signal profile obtained from cylindrical pores can be fitted with a model based on elliptical pores and vice versa. In most biological specimens, e.g., in brain white-matter or in elongated yeast cells, sharp boundaries such as those in the capped cylinder geometry are highly unlikely. However, in the micrographs obtained from these cells, the cross sectional diameter of the cells does not seem to vary significantly except at the very ends, hence resembling the cylindrical geometry. Although the actual shape of the compartments in real life specimens will certainly be more complicated than the shapes that can be handled analytically, we expect that for a fairly large class of shapes, reasonable approximations can be achieved if the pores are assumed to be cylindrical or ellipsoidal.
In the quest to characterize anisotropy at different length scales, an earlier work [38] exploited the local anisotropy induced by macroscopic interfaces to map orientations perpendicular to the boundaries enclosing pores that are larger than the voxel size (see Ref. [39] as well). To this end, single-PFG acquisitions are appropriate. Such anisotropy is the same kind of anisotropy referred to as μA in this article although the pore sizes may be much smaller than the voxel size. Because the relevant length scale for this kind of anisotropy to emerge is on the order of the mean squared displacements of the diffusing molecules, the term microscopic anisotropy (μA) was used to refer to such anisotropy [21]. At a much coarser length scale, the coherence of the elongated pores gives rise to ensemble anisotropy (EA). In this article, anisotropy at an intermediate length scale (CSA) as reflected on double-PFG measurements was addressed, filling in the important gap between the problems tackled in previous publications.
Previously, the scaling characteristics of diffusion within disordered media were characterized by varying the diffusion pulse separation in single-PFG acquisitions [40]. Clearly, varying the gradient orientation in double-PFG acquisitions provides an alternative means to procure information at different length scales. One route to extract such information involves fitting the model to data. For example, if the cylindrical geometry is chosen, then the unknowns are the flm coefficients characterizing the EA at the gross length scale, and r0 and L at the compartmental length scale, which provide an estimate for pore volume as well as eccentricity, or CSA. Note that although acquiring the data at long mixing times may be preferred as it provides a signature for CSA, the estimations of the same quantities can be performed at short and intermediate values of the mixing time as well.
Acknowledgments
The author would like to acknowledge Dr. Peter J. Basser for his encouragement and many stimulating discussions and Liz Salak for editing the manuscript. This research was supported by the Intramural Research Program of the NICHD at the National Institutes of Health (NIH).
Footnotes
Publisher's Disclaimer: This is a PDF file of an unedited manuscript that has been accepted for publication. As a service to our customers we are providing this early version of the manuscript. The manuscript will undergo copyediting, typesetting, and review of the resulting proof before it is published in its final citable form. Please note that during the production process errors may be discovered which could affect the content, and all legal disclaimers that apply to the journal pertain.
References
- 1.Stejskal EO, Tanner JE. Spin diffusion measurements: Spin echoes in the presence of a time-dependent field gradient. J Chem Phys. 1965;42(1):288–292. [Google Scholar]
- 2.Basser PJ. Inferring microstructural features and the physiological state of tissues from diffusion-weighted images. NMR Biomed. 1995;8(78):333–344. doi: 10.1002/nbm.1940080707. [DOI] [PubMed] [Google Scholar]
- 3.Özarslan E, Vemuri BC, Mareci TH. Generalized scalar measures for diffusion MRI using trace, variance, and entropy. Magn Reson Med. 2005;53(4):866–876. doi: 10.1002/mrm.20411. URL http://dx.doi.org/10.1002/mrm.20411. [DOI] [PubMed]
- 4.Mori S, Crain BJ, Chacko VP, van Zijl PCM. Three-dimensional tracking of axonal projections in the brain by magnetic resonance imaging. Ann Neurol. 1999;45:265–269. doi: 10.1002/1531-8249(199902)45:2<265::aid-ana21>3.0.co;2-3. [DOI] [PubMed] [Google Scholar]
- 5.Basser PJ, Pajevic S, Pierpaoli C, Duda J, Aldroubi A. In vivo fiber tractography using DT-MRI data. Magn Reson Med. 2000;44:625–632. doi: 10.1002/1522-2594(200010)44:4<625::aid-mrm17>3.0.co;2-o. [DOI] [PubMed] [Google Scholar]
- 6.Beaulieu C, Allen PS. Determinants of anisotropic water diffusion in nerves. Magn Reson Med. 1994;31(4):394–400. doi: 10.1002/mrm.1910310408. [DOI] [PubMed] [Google Scholar]
- 7.Beaulieu C, Allen PS. Water diffusion in the giant axon of the squid: implications for diffusion-weighted MRI of the nervous system. Magn Reson Med. 1994;32(5):579–583. doi: 10.1002/mrm.1910320506. [DOI] [PubMed] [Google Scholar]
- 8.Cory DG, Garroway AN, Miller JB. Applications of spin transport as a probe of local geometry. Polym Preprints. 1990;31:149. [Google Scholar]
- 9.Callaghan PT, Manz B. Velocity exchange spectroscopy. J Magn Reson A. 1994;106:260–265. [Google Scholar]
- 10.Stepišnik J, Callaghan PT. The long time tail of molecular velocity correlation in a confined fluid: observation by modulated gradient spin-echo NMR. Physica B. 2000;292:296–301. [Google Scholar]
- 11.Stapf S, Han SI, Heine C, Blümich B. Spatiotemporal correlations in transport processes determined by multiple pulsed field gradient experiments. Concepts Magn Reson. 2002;14(3):172–211. [Google Scholar]
- 12.Callaghan PT, Komlosh ME. Locally anisotropic motion in a macroscopically isotropic system: displacement correlations measured using double pulsed gradient spin-echo NMR. Magn Reson Chem. 2002;40:S15–S19. [Google Scholar]
- 13.Callaghan PT, Furo I. Diffusion-diffusion correlation and exchange as a signature for local order and dynamics. J Chem Phys. 2004;120(8):4032–4038. doi: 10.1063/1.1642604. URL http://dx.doi.org/10.1063/1.1642604. [DOI] [PubMed]
- 14.Qiao Y, Galvosas P, Callaghan PT. Diffusion correlation NMR spectroscopic study of anisotropic diffusion of water in plant tissues. Biophys J. 2005;89(4):2899–2905. doi: 10.1529/biophysj.105.064709. URL http://dx.doi.org/10.1529/biophysj.105.064709. [DOI] [PMC free article] [PubMed]
- 15.Hubbard PL, McGrath KM, Callaghan PT. Evolution of a lamellar domain structure for an equilibrating lyotropic liquid crystal. J Phys Chem B. 2006;110(42):20781–20788. doi: 10.1021/jp0601872. URL http://dx.doi.org/10.1021/jp0601872. [DOI] [PubMed]
- 16.Komlosh ME, Horkay F, Freidlin RZ, Nevo U, Assaf Y, Basser PJ. Detection of microscopic anisotropy in gray matter and in a novel tissue phantom using double pulsed gradient spin echo MR. J Magn Reson. 2007;189(1):38–45. doi: 10.1016/j.jmr.2007.07.003. URL http://dx.doi.org/10.1016/j.jmr.2007.07.003. [DOI] [PubMed]
- 17.Mitra PP. Multiple wave-vector extensions of the NMR pulsed-field-gradient spin-echo diffusion measurement. Phys Rev B. 1995;51(21):15074–15078. doi: 10.1103/physrevb.51.15074. [DOI] [PubMed] [Google Scholar]
- 18.Callaghan PT, Coy A, MacGowan D, Packer KJ, Zelaya FO. Diffraction-like effects in NMR diffusion studies of fluids in porous solids. Nature. 1991;351:467–469. [Google Scholar]
- 19.Özarslan E, Basser PJ. MR diffusion - “diffraction” phenomenon in multi-pulse-field-gradient experiments. J Magn Reson. 2007;188(2):285–294. doi: 10.1016/j.jmr.2007.08.002. URL http://dx.doi.org/10.1016/j.jmr.2007.08.002. [DOI] [PMC free article] [PubMed]
- 20.Shemesh N, Cohen Y. The effect of experimental parameters on the signal decay in double-PGSE experiments: negative diffractions and enhancement of structural information. J Magn Reson. 2008;195(2):153–161. doi: 10.1016/j.jmr.2008.09.006. URL http://dx.doi.org/10.1016/jjmr.2008.09.006. [DOI] [PubMed]
- 21.Özarslan E, Basser PJ. Microscopic anisotropy revealed by NMR double pulsed field gradient experiments with arbitrary timing parameters. J Chem Phys. 2008;128(15):154511. doi: 10.1063/1.2905765. URL http://dx.doi.org/10.1063/1.2905765. [DOI] [PMC free article] [PubMed]
- 22.Shemesh N, Özarslan E, Basser PJ, Cohen Y. Measuring small compartmental dimensions with low-q angular double-PGSE NMR: the effect of experimental parameters on signal decay. J Magn Reson. doi: 10.1016/j.jmr.2009.01.004. in press URL http://dx.doi.org/10.1016/j.jmr.2009.01.004. [DOI] [PubMed]
- 23.Cheng Y, Cory DG. Multiple scattering by NMR. J Am Chem Soc. 1999;121:7935–7936. [Google Scholar]
- 24.Özarslan E, Shemesh N, Basser PJ. A general framework to quantify the effect of restricted diffusion on the NMR signal with applications to double pulsed field gradient NMR experiments. J Chem Phys. 2009;130:104702. doi: 10.1063/1.3082078. [DOI] [PMC free article] [PubMed] [Google Scholar]
- 25.Grebenkov DS. NMR survey of reflected Brownian motion. Rev Mod Phys. 2007;79:1077–1137. [Google Scholar]
- 26.Grebenkov DS. Analytical solution for restricted diffusion in circular and spherical layers under inhomogeneous magnetic fields. J Chem Phys. 2008;128(13):134702. doi: 10.1063/1.2841367. URL http://dx.doi.org/10.1063/1.2841367. [DOI] [PubMed]
- 27.Koay CG, Sarlls JE, Özarslan E. Three-dimensional analytical magnetic resonance imaging phantom in the Fourier domain. Magn Reson Med. 2007;58(2):430–436. doi: 10.1002/mrm.21292. URL http://dx.doi.org/10.1002/mrm.21292. [DOI] [PubMed]
- 28.Barzykin AV. Exact solution of the Torrey-Bloch equation for a spin echo in restricted geometries. Phys Rev B. 1998;58:14171–14174. [Google Scholar]
- 29.Barzykin AV. Theory of spin echo in restricted geometries under a step-wise gradient pulse sequence. J Magn Reson. 1999;139(2):342–353. doi: 10.1006/jmre.1999.1778. URL http://dx.doi.org/10.1006/jmre.1999.1778. [DOI] [PubMed]
- 30.Axelrod S, Sen PN. Nuclear magnetic resonance spin echoes for restricted diffusion in an inhomogeneous field: methods and asymptotic regimes. J Chem Phys. 2001;114:6878–6895. [Google Scholar]
- 31.Robertson B. Spin-echo decay of spins diffusing in a bounded region. Phys Rev. 1966;151:273–277. [Google Scholar]
- 32.Grebenkov DS. Residence times and other functionals of reflected Brownian motion. Phys Rev E Stat Nonlin Soft Matter Phys. 2007;76:041139. doi: 10.1103/PhysRevE.76.041139. [DOI] [PubMed] [Google Scholar]
- 33.Bar-Shir A, Avram L, Özarslan E, Basser PJ, Cohen Y. The effect of the diffusion time and pulse gradient duration ratio on the diffraction pattern and the structural information estimated from q-space diffusion MR: experiments and simulations. J Magn Reson. 2008;194(2):230–236. doi: 10.1016/j.jmr.2008.07.009. URL http://dx.doi.org/10.1016/j.jmr.2008.07.009. [DOI] [PMC free article] [PubMed]
- 34.Özarslan E, Mareci TH. Generalized diffusion tensor imaging and analytical relationships between diffusion tensor imaging and high angular resolution diffusion imaging. Magn Reson Med. 2003;50(5) doi: 10.1002/mrm.10596. URL http://dx.doi.org/10.1002/mrm.10596. [DOI] [PubMed]
- 35.Özarslan E, Shepherd TM, Vemuri BC, Blackband SJ, Mareci TH. Resolution of complex tissue microarchitecture using the diffusion orientation transform (DOT) NeuroImage. 2006;31(3):1086–1103. doi: 10.1016/j.neuroimage.2006.01.024. URL http://dx.doi.org/10.1016/j.neuroimage.2006.01.024. [DOI] [PubMed]
- 36.Koch MA, Finsterbusch J. Compartment size estimation with double wave vector diffusion-weighted imaging. Magn Reson Med. 2008;60(1):90–101. doi: 10.1002/mrm.21514. URL http://dx.doi.org/10.1002/mrm.21514. [DOI] [PubMed]
- 37.Finsterbusch J, Koch MA. A tensor approach to double wave vector diffusion-weighting experiments on restricted diffusion. J Magn Reson. 2008;195(1):23–32. doi: 10.1016/j.jmr.2008.08.003. URL http://dx.doi.org/10.1016/j.jmr.2008.08.003. [DOI] [PubMed]
- 38.Özarslan E, Nevo U, Basser PJ. Anisotropy induced by macroscopic boundaries: Surface-normal mapping using diffusion-weighted imaging. Biophys J. 2008;94(7):2809–2818. doi: 10.1529/biophysj.107.124081. URL http://dx.doi.org/10.1529/biop.107.124081. [DOI] [PMC free article] [PubMed]
- 39.Özarslan E, Koay CG, Basser PJ. Remarks on q-space MR propagator in partially restricted, axially-symmetric, and isotropic environments. Magn Reson Imaging. doi: 10.1016/j.mri.2009.01.005. URL http://dx.doi.org/10.1016/j.mri.2009.01.005. [DOI] [PubMed]
- 40.Özarslan E, Basser PJ, Shepherd TM, Thelwall PE, Vemuri BC, Blackband SJ. Observation of anomalous diffusion in excised tissue by characterizing the diffusion-time dependence of the MR signal. J Magn Reson. 2006;183(2):315–323. doi: 10.1016/j.jmr.2006.08.009. URL http://dx.doi.org/10.1016/j.jmr.2006.08.009. [DOI] [PubMed]