

Abstract
Expression of purine genes is modulated by inflammation or experimental colitis and altered expression leads to disrupted gut function. We studied purine gene dysregulation profiles in IBD and determined whether they can distinguish between CD and UC using Pathway Analysis and a new Comparative Analysis of Gene Expression and Selection (CAGES) method. Raw datasets for 22 purine genes and 36 probe-sets from NCBI GEO (http://www.ncbi.nlm.nih.gov/ projects /geo/) were analyzed by NCI BRB array tools for random-variance of multiple/36 t-tests in colonic mucosal biopsies or PBMCs of CD, UC or control subjects. Dysregulation occurs in 59% of purine genes in IBD including ADORA3,CD73, ADORA2A,ADORA2B,ADAR,AMPD2,AMPD3,DPP4, P2RY5,P2RY6,P2RY13,P2RY14 and P2RX5. In CD biopsies, expression of ADORA3,AMPD3,P2RY13 and P2RY5 were negatively correlated with acute inflammatory score, CDAI or disease chronicity;P2RY14 was positively correlated in UC. In mucosal biopsies or PBMCs, CD and UC were distinguished by unique patterns of dysregulation (up- or down-regulation) in purine genes. Purine gene dysregulation differs between PBMCs and biopsies and possibly between sexes for each disease. Ingenuity pathway analysis (IPA) revealed significant associations between alterations in the expression of CD73 (upregulation) or ADORA3 (downregulation) and inflammatory or purine genes (≤10% of 57 genes) as well as GPCR, cAMP-dependent and inflammatory pathways; IPA distinguishes CD from UC. In conclusion, CAGES and Pathway Analysis provided novel evidence that UC and CD have distinct purine gene dysregulation signatures in association with inflammation, cAMP or other signaling pathways. Disease-specific purine gene signature profiles and pathway associations may be of therapeutic, diagnostic and functional relevance.
Keywords: Purine gene expression, Adenosine receptors, Adenosine A3 receptor, Adenosine A2 receptor, P2Y receptors, Inflammatory Bowel Diseases, Ulcerative Colitis, Crohn's disease, peripheral blood mononuclear cells, mucosal biopsy, microarray analysis
Introduction
Many substances have been used to treat the development of experimental gut inflammation and inflammatory bowel diseases (IBD), but to date available and effective clinical treatments for Crohn's disease (CD) and ulcerative colitis (UC) are limited. Adenosine (ADO) receptors may offer a novel therapeutic target in gut inflammation, IBD1 or other diseases.2-5 Endogenous adenosine (eADO) is a metabolite of ATP that acts at A1 receptor (A1R), A2AR, A2BR or A3R to influence mucosal secretion and neural sensory motor reflexes. ATP itself or other related purinergic mediators act on the receptors P2YR (P2YR 1, 2, 4, 6, 12-14) and P2XR (P2XR 1-7) to influence gut reflexes and function.6-11 A3Rs in particular have a wide range of physiological and disease-related effects4,5,8,12,13 with promise for treatment of heart disease, uveitis, colorectal cancer and inflammation.14 The A3R agonist N6-(3-iodobenzyl)adenosine-5′N-methyluronamide (IB-MECA), is in Phase II clinical trials as a treatment for rheumatoid arthritis chronic inflammatory disease and is apparently without toxicity (www.canfite.com/develop.html).
A3R and A2AR have been reported to have protective or therapeutic effects in experimental models of colitis, and the underlying mechanisms are under investigation.15-18 Increasing the concentration of eADO is one mechanism by which several drugs may reduce gut inflammation.19-22 Adenosine kinase inhibitor and an A3R agonist IB-MECA have been shown to reduce inflammation in rodent models of colitis.23,24
Our previous study established the protective effect of the prototypical A3R agonist IB-MECA on mucosal injury, inflammation and gene dysregulation in rat TNBS colitis.18 High density oligonucleotide microarray analysis of gene dysregulation (RNU34 neural GeneChip) indicated that oral IB-MECA prevented dysregulation in 92% of these genes including most purine genes as well as genes involved in oxidative stress signaling pathways. IB-MECA and adenosine were shown to also suppress elevated free radicals in ex-vivo inflamed gut.
Adenosine A1, A2A, A2B and A3R gene products are variably expressed in neural and non-neural layers of the human gut, epithelial cells or enterochromaffin (EC) cells.25 mRNA transcripts for A2BR, A2AR and A3R are expressed throughout the gastrointestinal (GI) tract in epithelial cells, mucosa and submucosa. Genechip analysis, quantitative PCR, in situ hybridization, and immunochemical analysis have all identified adenosine A1, A2A, A2B, A3, P2X2, P2X3, P2X5, P2X7, P2Y2, P2Y4, P2Y6, P2Y12 and P2Y14 gene products in the ENS of guinea-pig, mouse, rat or human gut.9,10,25-36
Purinergic signaling regulates important physiological functions of the GI tract including epithelial transport, serotonin (5-HT) release, mucosal reflexes, sensory signaling, synaptic transmission, as well as coordination of motility and secretion.6,9-11,26,37-40 Expression of purine-related genes can be modulated by disease, gut abnormalities, or drug treatments, including experimental colitis and IBD. 41-49 In both human IBD patients and TNBS induced colitis, expression of the ATP-gated ion channel P2X3 is increased.50,18 A recent high-density oligonucleotide microarray analysis of experimentally-induced colitis showed up-regulation of P2X1R, P2X4R, P2X7R, P2Y2R, P2Y6R, A2AR, A2BR, A1R and A3R genes and down-regulation of P2X2R, P2Y1R and P2Y4R.18 Such wide-spread dysregulation could be expected to cause significant disruption in normal gut motility, secretion, neural and coordination reflexes which are known to be modulated by these receptors.6-8 It is not known to what extent such purine gene receptor dysregulation occurs in CD or UC.
In this paper we present a novel comparative analysis of gene expression and selection (CAGES) methodology for analyzing and integrating existing clinical gene expression data from different IBD studies. We used the CAGES approach to assess purine gene expression profiles in IBD and to determine whether such profiles can distinguish between CD and UC. We hypothesized that purinergic genes are differentially expressed in IBD in a similar manner to the differential expression that occurs in experimental models of clinical IBD18, 50 We tested this hypothesis in a first-time analysis of existing genechip expression data sets generated from colonic mucosal biopsies or PBMCs derived from IBD patients with UC or CD. Twenty-two purine genes were analyzed such as P2X and P2Y receptor subtypes, as well as other genes involved in purine metabolism such as CD73 (NT5E), a 5′ectonucleotidase that converts AMP to adenosine whose expression is sensitive to disease states.51,52 Ingenuity Pathway analysis permitted identification of associations between alterations in purine gene expression and inflammatory genes, purine genes or various functional signaling pathways in IBD. Portions of the CAGES analysis were presented in preliminary form as a poster abstract at the American Gastroenterology Association meeting (2006) and as an oral presentation abstract at the 6th Annual Advances in the Inflammatory Bowel Diseases meeting (2007).
Methods
The new CAGES method was designed to compare the changes of a specific subset of genes of interest, e.g. the purine genes in multiple gene expression datasets, especially the ones for multiple types of diseases. Unlike the traditional MetaAnalysis which focuses on combining existing analysis results from different studies, the new CAGES methodology consists of carrying out a new analysis on the raw experimental data to test a novel hypothesis; the analysis was not conducted or even intended in the original studies. With multiple datasets under different experimental and clinical conditions, we can correlate the regulation of gene expression with different disease or physiological conditions. This approach allows us to overcome some previously insurmountable hurdles in generating and testing new hypotheses such as collecting tissue samples from patients for all different conditions. CAGES also facilitates the comparison of different materials (e.g. mucosal tissue samples and PBMCs as done in this study). Specifically, raw datasets for 22 purine genes and 36 probe-sets from NCBI GEO (http://www.ncbi.nlm.nih.gov/ projects /geo/) were analyzed by NCI BRB array tools for random-variance of multiple/36 t-tests in colonic mucosal biopsies or PBMCs of CD, UC or control subjects. CAGES methodology is the first step in the identification of the purine gene dysregulation profile in UC or CD.
Gene expression profiles were generated from mucosal biopsies or PBMCs from the colon of CD or UC patients and compared with matched controls from healthy volunteers. The RZPD1 spotted DNA/cDNA non-commercial chip/GPL was used to analyze gene expression in mucosal biopsies.53 Affymetrix HG_U133A/B GPL96 was used to analyze gene expression in PBMCs.54 Genechip datasets were extracted from the GEO (Gene Expression Omnibus) database maintained by NCBI (http://www.ncbi.nlm.nih.gov/geo/).
The data selection criteria included:
Search for “Crohn's” or “Ulcerative Colitis” in the GEO database until December 1, 2007.
Human samples.
At least three samples in each group (control and disease states); the data were selected such that both control and IBD samples were contained in the same dataset.
Clinically relevant based on the related literature.
Data sets
The following datasets were selected: GDS1330 (for comparison between CD and UC), GDS1615 (for comparison of PBMC between CD and UC). The original data were collected using Affymetrix GeneChip arrays or custom arrays, and then deposited in the GEO database.53,54 Datasets GDS504 (PBMC for hypertension), DGS962 (PBMC for exercise) and GDS1028 (PBMC for SARS) that were unrelated to IBD were used as negative controls. Additional existing datasets GDS559 and GDS560 for IBD (including control, CD, and UC) were dropped from the study since they didn't have sufficient number of samples.
Among datasets that contained multiples types of disease, all combinations of control and sample were analyzed. Prior to analysis, data that was logarithmic was converted to linear format, and all null values were excluded. We have independently validated the normalization on every dataset by inspecting the distribution of expression values. Datasets for sigmoid colon mucosal biopsies of Crohn's (CD, n=11), ulcerative colitis (UC, n=10) and controls (n=10, GSE#1710), as well as datasets for peripheral blood mononuclear cells (PBMCs) (CD, n=59; UC, n=26; controls, n=42, GSE#3365), were analyzed by BRB array tools for all 36 purine-related probe-sets representing the 22 distinct genes. If age and sex information was available, both the control group and the disease group were blocked for age and sex factors and analyzed using a random block ANOVA in order to reduce the variability caused by the blocking factors and achieve a greater precision. To correct for multiple testing we used a Bonferroni-Holm correction.
In the IBD study by Costello et al53,54 patients with CD ranged from 2 years to 20 years after diagnosis. Inclusion criteria for CD were clinically active disease defined as CDAI > 150 or CAI ≥ 4 and inflammation present in sigmoid colon during endoscopy. All biopsies were taken from sigmoid colon and patients were free of all medication (other than low dose 5-ASA) for a minimum of 6 weeks prior to endoscopy. A correlation analysis was done between the severity of the disease and the expression of purine genes.
Mucosal biopsies for acute inflammatory score were obtained from the same site as gene array expression analysis samples and subjected to routine histopathology. Briefly, in that study, a blinded reviewer assessed the slides. Samples were graded (scale 0-3) along the presence of acute inflammatory cells (A0-A3) and presence of a chronic infiltrate (C0-C3). A correlation analysis was done between acute inflammatory score (and presence of a chronic infiltrate) with purine gene expression.
Pathway analysis of purine gene dysregulation
Pathway studio analysis
A list of 36 genes was generated from the most exceptional cluster of gene dysregulation observed in our previous study in experimental colitis.18 This list was imported into Pathway Studios in order to generate a pathway analysis between inflammatory genes (i.e. oxidative stress, redox sensitive genes, trophic factors, chemokines, complement, etc) and the 22 purine genes listed in Table 1; in that study, a significant number of ADO, P2X and P2Y genes were shown to be abnormally expressed in experimental colitis. Adenosine and calcium was added to the pathway. A pathway was generated using the “shortest path” function. ”Proteins” was the only entity, and “binding” and “expression” the only relation filter applied. After the pathway was built, inflammation proteins sharing no relations with purine proteins were removed from the pathway. Then, using the “relation” table, relations which did not include at least one purine protein were removed. The circular membrane layout was selected for pathway display.
Table 1.
List of distinct purine genes analyzed from GEO database in IBD
| Gene Symbol | Name |
|---|---|
| Receptors | |
| ADORA1, ADORA2A, ADORA2B, ADORA3 | Adenosine receptors, G-protein coupled |
| P2RY1, P2Y2, P2Y5, P2Y6, P2Y12, P2Y14 | Purinergic receptors P2Y, G-protein coupled |
| P2RX1, P2RX2, P2RX3, P2RX4, P2X5 | Purinergic receptors P2X, ligand-gated cation channel receptors |
| Enzymes | |
| ADAR | adenosine deaminase, RNA-specific |
| ADK | adenosine kinase |
| AMPD2 | adenosine monophosphate deaminase 2 (isoform L) |
| AMPD3 | adenosine monophosphate deaminase (isoform E) |
| DDP4 | dipeptidyl-peptidase 4 (CD26, adenosine deaminase complexing protein 2) |
| NT5E | 5′-nucleotidase, ecto (CD73) |
| ADARB1 | human RNA editing deaminase |
Ingenuity Pathway Analysis
The selected genes identified as being dysregulated in IBD (i.e. inflammation, purines, oxidative stress, trophic factors, chemokines, etc) were imported to the Ingenuity Pathway Analysis (IPA, http://www.ingenuity.com) for functional analysis of Canonical Pathways associated with such genes. The Functional Analysis identified the biological functions and/or diseases that were most significant to the data set. Genes were associated with biological functions and/or diseases in the Ingenuity Pathways Knowledge Base that were considered for the analysis. The number of genes associated with each biological function and/or disease is counted. Fischer's exact test was used to calculate a p-value determining the probability that each biological function and/or disease assigned to that data set is due to chance alone. Ingenuity pathway analysis tested for significant associations between mucosal up-regulation of CD73 (NT5E) or down-regulation of ADORA3 and alterations in various pathways including inflammatory pathways, acute phase response signaling, IGF-1 signaling, GPCR/purine gene signaling, cAMP-dependent signaling, oxidative stress signaling, IL-10 signaling, as well as synaptic long term depression or axonal guidance signaling.
Data sources for analysis
The following sources were used for extracting data / information for our statistical analyses:
Raw data on gene expression of purines in IBD and non-IBD tissues samples extracted from: NCBI GEO (http://www.ncbi.nlm.nih.gov/ projects /geo/)
Criteria/severity of IBD in mucosal biopsies, inflammatory score, chronicity of IBD and criteria for patient recruitment as referenced 53
Raw data set for peripheral blood mononuclear cells; and criteria for patient recruitment as referenced 54
Basis of hypothesis on purine gene dysregulation in experimental colitis; source of 35 inflammatory genes used for assessing associations with purine gene dysregulation as referenced 18
Statistical Analysis
As our interest was in purine-related genes, we examined the expression profiles of purine genes in each dataset. First, we performed either related samples or independent samples t-tests, as appropriate, on gene expression levels between control and test samples. Parametric p-values are used to assess significance. The ratio of the geometric means of intensities is used to calculate percent change in gene expression. The gene is considered to be differentially expressed if p<0.05. We also list the false discovery rate (FDR), computed using the BRB Array tools. Since we are studying only a small set of genes, high FDR numbers (value > 0.10) do not necessarily imply a type-I error. For genes with high FDR and p<0.05, we further studied their correlation with other factors such as CDAI and chronicity to establish biological relevance. For each dataset, a list of purine genes whose expression level is significantly changed was generated using these criteria. The resulting lists were investigated for potential molecular mechanisms that might be involved in IBD or other gut abnormalities. Pathway Studio and IPA/Canonical Pathway analysis, 2 pathway generating programs, were used to explore the relationship between purine expression and inflammation.
Results
Data analysis was done using a novel CAGES methodology to determine the expression profiles of purine gene dysregulation in CD and UC in mucosal biopsies or PBMCs and to assess differences between CD and UC according to these purine gene profiles. Our analysis also assessed possible sex related differences in expression profiles in IBD. We further probed the complex associations between purine genes and inflammatory genes in IBD, the severity or chronicity of the disease, and Ingenuity Pathway analysis was used to assess the association between purine genes and other biological signaling pathways. The results are organized according to these analyses and sections and summarized in Tables 1-6 and Supplemental Tables 1-3, and Figures 1-3 and Supplemental Figure 1. Table 1 lists the 22 purine genes represented by 36 probe-sets used in the CAGES analysis. Data will be described separately for biopsy and PBMCs with a focus on differences that distinguish between the two types of IBD.
Table 6.
Correlations between NT5E gene dysregulation and purine or inflammatory gene dysregulation in CD or UC mucosal biopsies
| Specimen | Crohn's Disease | Ulcerative Colitis |
|---|---|---|
| Mucosal Biopsy | Correl. Coefficient (r-value)* | Correl. Coefficient (r-value)* |
| Gene | ||
| ADORA2A | +0.516 | None |
| ADORA3 | -0.785 | None |
| IGF1 | +0.626 | +0.407 |
| APOE | +0.711 | +0.578 |
| HMOX1 | +0.720 | +0.504 |
| CXCL2 | None | +0.583 |
| C3 | None | +0.717 |
| IL1-β | None | +0.717 |
| PBMC | None | None |
NT5E / CD73 gene dysregulation was correlated with alterations in expression of 35 inflammatory and 22 purine genes in CD or UC. Genes selected for analysis were those identified in experimental colitis and referenced in Inflamm Bowel Dis. 2006 Aug;12(8):766-789: Extended list of genes included in the correlation analysis – note: only a subset of genes are significantly correlated. Stat3, rc AI236828 s at, signal transducer and activator of transcription 3; Rbp2, M13949 at, retinol-binding protein 2; ---, rc AI071965 s at, R. norvegicus hsp 70.2 mRNA for HSP 70; Hspala, L16764 s at, heat shock 70kD protein 1A; Rbp1, M19257 at, retinol-binding protein 1; ---, S76779 s at, ---; Cxcl2; U45965 at, chemokine (C-X-C motif) ligand 2; Cc13, U22414 at, chemokine (C-C motif) ligand 3; Plat, M23697 at, Plasminogen activator, tissue; Il1b, M98820 g at, Interleukin 1 beta; Scya2, X17053mRNA s at, small inducible cytokine A2; C3, M29866 s at, Complement component 3; Sod2, Y00497 s at, superoxide dismutase 2; Apoe, X04979 at, apolipoprotein E; Egr1, AF023087 s at, early growth response 1; Bzrp, J05122 at, Benzodiazepin receptor (peripheral); Cebpb, X60769mRNA at, CCAAT/enhancer binding ptn (C/EBP), β; Igf1, M15481 g at, insulin-like growth factor 1; C3, X52477 at, Complement component 3; Hmox1, J02722cds at, Heme oxygenase; Scya2, X17053cds s at, small inducible cytokine A2; Pdgfra, rc AI232379 at, platelet-derived growth factor receptor α; Nos2, U03699complete seq at, nitric oxide synthase 2; Egr1, M18416 at, early growth response 1; ---, U75397UTR#1 s at, ---; Vim, X62952 at, vimentin; LOC57301, E13732cds at, MIP-1 α receptor gene; Il1b, E01884cds s at, Interleukin 1 β; C4a, U42719 at, Complement component 4a; Tf, D38380 g at, Transferrin; Hspb1, rc AA998683 g at, heat shock 27kD protein 1; Tac1, M15191 s at, Tachykinin (SP, neurokinin A, NK, neuropeptide γ; LOC60665, U90448 at, CXC chemokine LIX; Nrp, AF016296 at, neuropilin; Slc1a3, rc AI101255 s at, solute carrier family 1, member 3; Cebpb, S77528cds s at, CCAAT/enhancer binding protein (C/EBP), β; Ncam1, X06564 at, neural cell adhesion molecule 1; ---, E00001cds f at, ---; Selp, L23088 at, selectin, platelet; Igfbp5, rc AI029920 s at insulin-like growth factor binding protein 5; Ania4, AF030089UTR#1_at, neurotransmitter-induced early gene protein 4.
Figure 1.
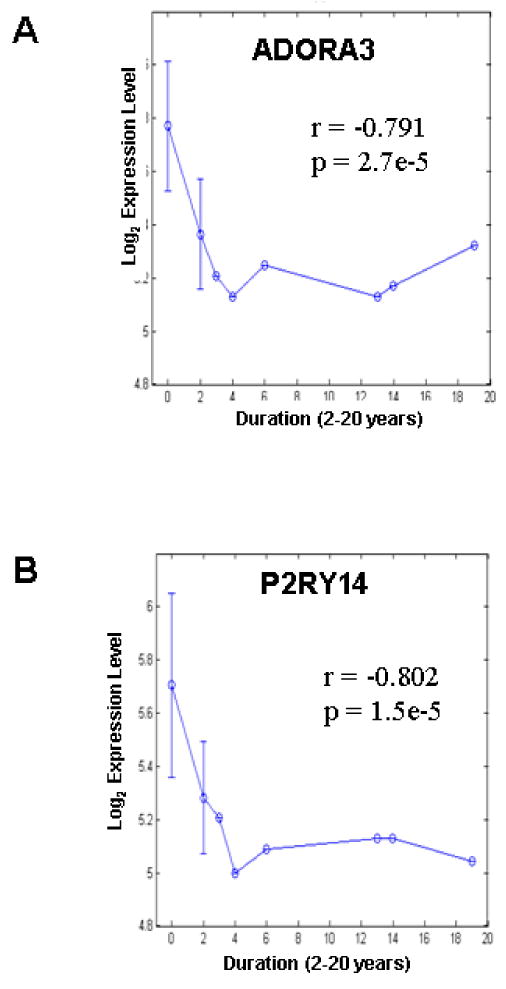
A negative correlation exists between duration of CD and mRNA expression of (A) ADORA3 and (B) P2RY14 in mucosal biopsy. Error bars = S.D.
Figure 3.

Canonical pathway analysis reveals novel signaling pathways associated with CD73 / NT5E or ADORA3 mRNA gene dysregulation that distinguish between CD and UC. (A, B) NT5E pathway analysis reveals that NT5E gene dysregulation is associated with acute phase response signaling, cAMP-mediated signaling, NRF2-mediated oxidative stress response and G-protein coupled receptor signaling (i.e. bars above threshold line for significant association). A distinct profile is observed in UC (B). ADORA3 pathway analysis reveals that ADORA3 gene dysregulation is associated with acute phase response signaling, cAMP-mediated signaling, G-protein coupled receptor signaling, IGF-1 signaling and IL-10 signaling. A distinct profile is observed in UC (D). Bars – The significance calculated for each function/Canonical Pathway is a measurement of the likelihood that the function is associated with the dataset by random chance. On the y-axis of the diagram, the significance is expressed as the minus log (10-based) of the p-values calculated from Ingenuity pathway analysis and Fischer's exact test. Threshold set at 0.05 for p-value, in the chart it corresponds to −log (0.05)). Note: the higher the bar, the lower the p-value and hence the more significant for the enrichment of the group/pathway/network. Ratio - The ratio between the number of genes in our list and the total number of genes in the defined functional group or pathway or network; curve just links all the data points for the ratio.
Purine gene expression in mucosal biopsy
In mucosal biopsies from the colon of CD patients compared to controls, abnormalities in gene expression occurred in 7 of 22 purine genes: ADORA3, ADORA2A, ADAR, AMPD3, P2RY13 and P2RY14; NT5E/CD73 expression will be discussed later. Down-regulation occurred in ADORA3, P2RY14, P2RY13 and AMPD3 (Table 2). Up-regulation occurred in ADORA2A and ADAR. In contrast, in UC patients, ADORA3, P2RY14, P2RY13 and AMPD3 were all up-regulated genes. Furthermore, abnormal expression occurred in DPP4 (up-regulation) and P2RY6 (down-regulation) exclusively in UC (Supplement Table 1).
Table 2.
Relative change in gene expression profiles from mucosal biopsies for Crohn's Disease as compared to healthy controls for all subjects and by sex
| Biopsy | GDS1330 | |||||||||
|---|---|---|---|---|---|---|---|---|---|---|
| Gene Symbol | Δ in Gene Expression | |||||||||
| Parametric P values | FDR | Normal vs Crohn's | Parametric P values | FDR | Normal Male vs Crohn's Male | Parametric P values | FDR | Normal Female vs Crohn's Female | ||
| 1 | ADORA3 | 4.91E-05 | 0.001473 | ↓ 30% | 0.014684 | 0.059574 | ↓ 33% | 0.000642 | 0.003852 | ↓ 29% |
| 2 | P2RY14 | 0.0013713 | 0.02057 | ↓ 32% | 0.038688 | 0.068264 | ↓ 37% | 0.007963 | 0.023888 | ↓ 31% |
| 3 | ADORA2A | 0.0041518 | 0.041518 | ↑ 36% | 0.052072 | 0.068264 | ↑ 35% | 0.029283 | 0.058565 | ↑ 44% |
| 4 | AMPD3 | 0.0181902 | 0.119108 | ↓ 19% | 0.056887 | 0.068264 | ↓ 33% | 0.216604 | 0.259925 | ↓ 16% |
| 5 | ADAR | 0.0198514 | 0.119108 | ↑ 21% | 0.019858 | 0.059574 | ↑ 35% | |||
| 6 | ADAR | 0.0293943 | 0.146972 | ↑ 17% | ||||||
| 7 | P2RY13 | 0.0343941 | 0.147403 | ↓ 25% | 0.098049 | 0.098049 | ↓ 29% | 0.201804 | 0.259925 | ↓ 24% |
For most genes, blocking for sex did not affect the pattern or magnitude of gene dysregulation in mucosal biopsies from CD or UC (Tables 2 and Supplement Table 1). In CD, no sex differences are apparent in the abnormal expression of ADORA3, P2YR13 or P2YR14 (Table 2). However, there appears to be a sex difference in gene expression of AMPD3, ADAR and ADORA2A. In AMPD3, there is a 19% down-regulation without blocking for sex, a 33% down-regulation when analysis is restricted to males and a 16% down-regulation in female CD patients. In males, ADAR is up-regulated by 35% compared to 21% without blocking for sex. Overall, abnormalities in these genes occur in both males and females.
In UC, data analysis could not be performed separately in females due to low sample size. In males, abnormalities in gene expression were similar to those without blocking for sex except for P2YR14 where up-regulation was 51% in males compared to 35% without blocking for sex. Up-regulation of ADORA3, P2RY14, AMPD3, P2YR13 and DPP4 also occurs in the mucosa of male CD patients compared to control males (Table 2).
Correlation of expression with severity of CD (CDAI/CAI)
A negative correlation occurred between the severity of the disease and the expression of the genes for receptors ADORA3 and P2RY14. Therefore, for these genes, more severe disease leads to a greater down-regulation of gene expression. There was a positive correlation for ADORA2A, ADAR and ADARB2 (Table 3).
Table 3.
Correlation analysis between purine gene expression and severity CDAI/CAI in CD mucosal biopsies
| Correlation coefficient | Parametric p-value | FDR | Gene symbol | |
|---|---|---|---|---|
| 1 | -0.722* | 0.0024919 | 0.074757 | ADORA3 |
| 2 | +0.4873 | 0.0063086 | 0.094629 | ADORA2A |
| 3 | -0.615* | 0.0208666 | 0.194834 | P2RY14 |
| 4 | +0.3995 | 0.0259779 | 0.194834 | ADAR |
| 5 | +0.3659 | 0.0429484 | 0.25769 | ADARB2 |
implies negative correlation
For CD, our analysis revealed a negative correlation between acute inflammatory score (and the presence of chronic infiltrate) and expression of ADORA3, P2RY14, AMPD3, P2RY13 and P2RY5. This relationship was seen only in probe sets X and Y. Probe set Z showed a negative correlation in the expression of P2Y13 but failed to show significant correlation in the expression of ADORA3, P2RY14, or AMPD3; a positive correlation was observed with ADAR, suggesting instead that its up-regulation in CD is enhanced with inflammation (Table 4). In contrast, in UC mucosal biopsies, only P2RY14 was positively correlated with inflammatory score.
Table 4.
Correlation analysis between purine gene expression with acute inflammatory score in IBD mucosal biopsies
| Specimen | Correlation coefficient | Parametric p-value | Gene symbol | |
|---|---|---|---|---|
| CD Mucosal Biopsy | 1 | - 0.614* | 0.0022248 | ADORA3 |
| 2 | - 0.241* | 0.0030579 | P2RY14 | |
| 3 | - 0.493* | 0.0055007 | AMPD3 | |
| 4 | - 0.419* | 0.0137236 | P2RY13 | |
| 5 | +0.391 | 0.0297683 | AMPD3 | |
| 6 | +0.382 | 0.0340674 | ADAR | |
| 7 | - 0.361* | 0.0447283 | AMPD3 | |
| 8 | - 0.800* | 0.0098000 | P2RY5 | |
| UC Mucosal Biopsy | 9 | +0.758 | P2YR14 |
Implies negative correlation
Correlation of expression with chronicity
The data for CD shows a negative correlation between expression and chronicity of disease for P2RY14, ADORA3, AMPD3 and P2RY13. For ADORA2A and ADAR, a positive correlation occurs between expression and chronicity (Table 5). The relationship between duration of CD and gene expression and dysregulation is illustrated in Fig 1A for ADORA3 and Fig 1B for P2RY14. Information on chronicity was not reported for UC in that study.
Table 5.
Correlation analysis between purine gene expression / dysregulation and duration of Crohn's disease after diagnosis
| Correlation coefficient | Parametric p-value | Gene symbol | |
|---|---|---|---|
| 1 | - 0.802* | 1.5e-05 | P2RY14 |
| 2 | - 0.791* | 2.7e-05 | ADORA3 |
| 3 | - 0.3870* | 0.0054279 | AMPD3 |
| 4 | - 0.3728* | 0.0184086 | P2RY13 |
| 5 | +0.4123 | 0.0235875 | ADORA2A |
| 6 | +0.4003 | 0.0256568 | ADAR |
implies negative correlation
Purine gene dysregulation in PBMC from CD
In PBMCs isolated from blood taken from CD patients, the expression of 8 different purine genes was abnormal compared to controls. There was up-regulation in ADORA2B, ADORA2A, P2RY5, AMPD2 and AMPD3. Down-regulation occurred in ADAR, DPP4 and P2X5. Alterations in gene expression were still observed in males vs females when analyzed separately. However, notable differences in male versus female occurred in the % up-or-down-regulation in ADORA2A (up-regulation), and DPP4 (down-regulation confirmed with 3 different probe-sets). Greater up-regulation of ADORA2A and greater down-regulation of DPP4 occurred in females (Supplement Table 2).
In CD, the only gene expression abnormality common to both PBMCs and mucosa is seen in the ADORA2A which is up-regulated by disease. In contrast to PBMCs, 5 other genes (ADORA2B, DPP4, P2RX5, P2RY5, and AMPD2) did not change in mucosal biopsies. AMPD3 was down-regulated in mucosal biopsies and up-regulated in PBMCs. The converse occurred for ADAR.
Purine gene dysregulation in PBMC from UC
In PBMCs from UC patients, the expressions of 6 genes were altered by disease. ADAR, DPP4 and P2X5 were up-regulated in contrast to CD in which they were all down-regulated. P2RX1, 2, and 3 are only on gene chip GDS1615. P2RX4 is not significant in the analysis. P2RY4, 11 and 12 were not represented on either chip. ADORA2A, ADORA2B and AMPD2 were down-regulated, whereas in CD they were all up-regulated genes. AMPD3 and P2RY5 did not change in CD, unlike UC (Supplement Table 3).
The down-regulation of ADORA2A and AMPD2 is apparently restricted to PBMCs from female UC subjects; no change occurs in males. For DPP4, up-regulation is twice as much in females compared to males. In contrast to CD, ADORA2A and ADORA2B in PBMCs are down-regulated in UC. DPP4 and ADAR are up-regulated in UC and down-regulated in CD.
Purine Gene signature profiles in UC and CD
Figure 2 summarizes, in histogram form, the purine gene dysregulation signature profiles that clearly distinguish between UC and CD for biopsy and PBMC. For each cell source, differences exist in purine gene dysregulation between CD and UC.
Figure 2.

Purine Gene dysregulation signature profiles clearly distinguish between UC and CD. (A) Purine gene dysregulation profiles in mucosal biopsies. (B) Purine gene dysregulation profiles in PBMCs. CAGES analysis was done as described in methods, and all alterations in gene expressions depicted in the histograms are statistically significant at p<0.001 – p<0.00001. Data is derived from Tables 2, Supplement Tables 1-3.
General Pathway analysis of purine gene dysregulation
Supplemental Figure 1 illustrates the relationships that exists between inflammatory genes and all 22 purine genes of interest in the current analysis found using Pathway Studios. The many interactions that exist between inflammatory and purine genes are highlighted.
Ingenuity Pathway Analysis (IPA) and Canonical Pathways
CD73/NT5E Expression
The mRNA expression of the 5-ectonucleotidase enzyme CD73 that breaks down AMP to adenosine is up-regulated in both UC and CD mucosal biopsies but it does not change in PBMCS for either disease (p>0.05). NT5E is significantly up-regulated in the most highly expressed of the 6 NT5E probe-sets in GDS1330. NT5E gene probe was significantly up-regulated by 66% in females with Crohn's disease (p=5.67e-05) and not males. There were not enough samples to conduct an analysis for females with UC. In males with UC, there was a significant 52% up-regulation (6.8e-03) of NT5E expression.
Table 6 summarizes significant correlations/associations between CD73 up-regulation and alterations in inflammatory genes or purine genes. In CD, CD73 expression is positively correlated with ADORA2A expression and negatively correlated with ADORA3, 2 GPCR signaling pathways. No associations exist between these or other purine genes and CD73 up-regulation. Alterations in IGF1, APOE and HMOX1 in CD are all positively correlated with CD73 up-regulation. This is also the case for UC but CXCL2, C3 and IL-1β are positively correlated with CD73 over-expression exclusively in UC. No such associations occur in PBMCs for CD73.
We next used IPA Canonical Pathway analysis to determine the associations between gene expression and dysregulation of 2 specific purine genes, CD73/NT5E and ADORA3 with biological responses including acute phase response signaling and inflammation, purine genes and GPCR signaling, IL-10 signaling, NRF-2 mediated oxidative stress response, complement system, IL-6 signaling, IGF-1 signaling, p38 MAPK signaling, NF-κB signaling, cAMP-mediated signaling, synaptic long term depression and axonal guidance signaling. Figure 3A summarizes data for significant associations between CD73 up-regulation in CD and expression with biological responses of interest noted above. Data indicates that variations in expression of CD73 in IBD are associated with acute phase response signaling (i.e. HMOX1, C3, SOD2, tumor necrosis factor, IL-1β, RBP1), cAMP-mediated signaling, oxidative stress response and GPCR signaling. In UC, the relationship of CD73 expression and the selected pathways differs from that with CD. Therefore, in UC, IL-10 signaling and not GPCRs or cAMP-mediated signaling emerge as having significant associations with CD73 (Figure 3B).
IPA/Canonical Pathway analysis revealed significant associations between ADORA3 down regulation in CD and IL-10, IGF-1, acute phase response, GPCRs and cAMP mediated signaling pathways (Figure 3C). As with CD73, the GPCR and cAMP-mediated signaling pathways are not associated with ADORA3 up-regulation in CD.
Discussion
To our knowledge, this study is the first to provide proof for extensive purine gene dysregulation in IBD. About 55% of purine genes analyzed are either up-regulated or down-regulated in IBD. This dysregulation is expected to have remarkable effects on mucosal function and could result in significant disruption of epithelial transport, secretion, mucosal or motility reflexes.6 Experimental gut inflammation leads to abnormalities in purinergic A1 or A2A – receptor mediated actions on motility.55, 56 A disadvantage of the CAGES method is that there is no access to tissues to validate microarray results by quantitative RT-PCR or proteomic analysis. Still, the distinct purine gene dysregulation profiles obtained in UC and CD in either mucosal tissue or PBMCs likely represent differences in pathophysiological mechanisms between UC and CD. CAGES does provide significant new data and a basis for future study.
Purines as therapeutic targets in IBD
Elevation of eADO by adenosine kinase inhibitors or selective agonists for adenosine A3R, A2AR or A2BR are of therapeutic potential in experimental models of IBD.15,16,18,55 However, before adenosine receptors can be proven to be of therapeutic value in IBD, a better understanding of the pathophysiological consequences of such complex alterations in purine gene expression is necessary. Our previous analysis in whole-thick tissues of rat TNBS colitis which has features of both CD and UC26 indicated that up-regulation occurred in A1, A3, A2A, P2X1, P2X3, P2X7, P2Y2, P2Y6 receptor transcripts. Modest down-regulation occurred in P2X2, P2Y4 and P2Y1Rs.18 Differences in purine expression between TNBS colitis and IBD (this study) may reflect differences between species, colonic region, the mixed nature of the TNBS disease model, additional cell types included in whole thick tissues or the type of IBD disease being compared (i.e. UC vs CD) since the two IBD diseases can be distinguished by differential purine gene expression profiles. Neurons do express purine receptors26 that could also become dysregulated in IBD, in addition to mucosal receptors analyzed in the current study.50
Based on the CAGES analysis, we can make some preliminary predictions about the ADOA3R or other adenosine receptors as potential therapeutic targets in IBD. For example, adenosine A3R is down-regulated in CD and is further compromised with severity of disease and chronicity of disease from time of diagnosis (i.e. 2-20 yrs). This could have implications for dosing regimens and efficacy of using the A3R agonist drugs like IB-MECA or 2-Cl-IBMECA, currently being tested in clinical studies for rheumatoid arthritis57,58 (www.canfite.com/develop.html). Data suggest that the A3R is potentially a more favorable therapeutic target in UC than CD, since ADORA3 gene expression in UC may be up-regulated by disease.
Abnormally expressed purine genes represent enzymes involved in purine metabolism (ADAR, DPP4/CD26, NT5E/CD73, AMPD2, AMPD3), adenosine receptors (ADORA3, ADORA2B, ADORA2A), P2X receptors (P2RX5) and P2Y receptors (P2RY5, P2RY6, P2RY12, P2RY13, P2RY14). Clear differences exist in dysregulation profiles of purine genes between UC and CD in mucosal biopsies and PBMCs (see Figure 2). Genes that are up-regulated in CD are down-regulated in UC and vice versa. Other genes are abnormally expressed in one disease but not the other. Therefore, purine gene dysregulation profiles strongly argue for CD and UC as distinct disease entities at the purine gene expression level in mucosal biopsies.
The purine gene dysregulation profile can also clearly distinguish between PBMCs and mucosal cells. Furthermore CD and UC can be clearly distinguished by their purine gene dysregulation signature profiles in PBMCs. In PBMCs from UC, the unique purine gene signature profile is down regulation of ADORA2A, ADORA2B, AMPD2 and up-regulation in ADAR, DPP4 and P2X5. P2RY5 and AMPD3 remained normal in UC. An interesting finding is that it appears that changes in the ADORA2A and AMPD2 gene products occur exclusively in female UC subjects. This is not the case in CD. Overall, our CAGES method provides novel evidence indicating that cell specific and unique gene dysregulation signatures exist that can distinguish CD from UC. For other genes, unrelated to purines, global cDNA microarray analysis or restricted cDNA array (MICROMAX) in mucosal biopsies or PBMCs revealed a multitude of genes that become dysregulated in human IBD, and provided evidence for significant differences in gene dysregulation profiles between CD and UC.53,54,59-61 Our analysis suggests that a restricted set of genes representing purines can distinguish between CD and UC.
Implications in IBD for alterations in Gut Reflexes
The mucosal neural secretomotor reflex is activated or influenced by nutrients, mechanical stimulation, gut inflammation or IBD, Clostridium difficile toxin A (TxA), or other gut infections and diseases. Activation of the reflex leads to secretion of chloride, bicarbonate, potassium, mucin and fluid secretion and even profuse diarrhea.11,26
Purines are involved in the modulation of gut reflexes by interacting with purine receptors at all steps of the EC – neural – epithelial or smooth muscle cell axis.6,11,25,26,37 Adenosine can activate inhibitory A3/A1R- Gαq/PLC/IP3-Ca2+ and excitatory A2a/A2bR-AC/cAMP signaling pathways on EC cells to regulate 5-HT release in the mucosa and trigger reflexes.37 Significant species and tissue differences exist in distribution and function of P2X, P2Y and P1 receptors in the mammalian gut11, and such information is mostly lacking for the human gut. Gene expression and differential dysregulation of ADORA1, A2A, A2B, A3R, as well as 8 other genes was revealed by CAGES analysis of raw gene array data of mucosal biopsies taken from sigmoid colon of CD or UC patients. Such abnormal expression of purinergic receptors may contribute to functional abnormalities and diarrhea in IBD.11
Various P2 receptors are found in both the basolateral and luminal membranes of the gut mucosa.62 Luminal fluid secretion and a diarrhea response would occur with activation of luminal P2YRs in small intestine (Cl- secretion) or colon (inhibition of Na+ absorption via ENaCs and K+ secretion). A diarrhea response may play a role in host defense reactions against potential pathogenic invading organisms. Recent evidence suggests that basolateral P2Y6R that are sensitive to UDP in colonic epithelial cells stimulate sustained NaCl secretion.11 P2Y6R gene expression is down regulated exclusively in UC and this function may be compromised. Expression of other P2YR transcripts remained unchanged in the mucosa of IBD patients, except for P2RY13 and PRY14 – their function is unknown.11
An A2 agonist can stimulate chloride secretion in human gut. A2BR immunoreactivity is prominent in human mucosa or epithelial cells of the colon, cecum and jejunum.31,63,64 In human intestinal epithelial cells, adenosine modulates immune function and exerts anti-inflammatory effects by acting as a negative regulator of NF-κB and MAPK signaling and to reduce IL-8 expression and secretion.65 Adenosine is generated at sites of tissue injury or stress including ischemia, inflammation and tissue remodeling by the break-down of ATP. Adenosine at inflammatory sites can have either pro-inflammatory or anti-inflammatory effects depending on the receptor or tissue. In crypt abscesses during periods of active inflammation, ectonucleotidases convert ATP released from neutrophils to adenosine. A2BR activation causes apical chloride and interleukin-6 secretion. It has been suggested that interleukin-6 would promote neutrophil degranulation and enhance microbicidal activity of neutrophil trafficking to the intestinal mucosa.66-68 Our CAGES analysis shows that PBMCs in CD patients over-express ADORA2B. Cells from UC patients display down-regulation of ADORA2B. Some PBMCs (∼15%) isolated from CD patients represent neutrophils that are known to participate in active inflammation. The data suggest that in CD, neutrophil activation is potentially enhanced by over-expression of ADORA2B, whereas in UC it may be suppressed by ADORA2B down-regulation.
ADORA2A gene expression is up-regulated in mucosa and PBMCs of IBD patients. This makes it a logical target for novel IBD treatments. In this regard, a selective A2AR agonist, ATL 313, could reduce Clostridium difficile Toxin A-induced diarrhea and edema, prevented mucosal damage, neutrophil infiltration, cell death and TNFα production and increased ADA activity in murine-ileal loops exposed to Toxin A. Toxin A (TxA) release from Clostridium difficile (a gram-+-anaerobic bacillus) can also contribute to antibiotic-induced diarrhea and pseudomembranous colitis through A2ARs because its effects could be reversed by a selective A2A antagonist ZM241385.15 Therefore, up-regulation of A2AR gene expression in CD can be seen as an adoptive response aimed at ameliorating inflammation, mucosal damage and diarrhea. Activation of an A2AR attenuates intestinal inflammation in animal models17,18.
In our analysis, the observed up-regulation of CD73 in IBD is expected to lead to increased availability of endogenous adenosine that may have implications to the absorption of nutrients in the inflamed gut mucosa, and it has been shown to be beneficial in alleviating severe diarrhea in children with cholera.30,69,70 Lumenal ADO (or AMP) can rapidly increase glucose transport by small intestine, and increase systemic availability of 3-O-methylglucose after an oral administration to mice.71
Purine receptor transcripts in peripheral blood mononuclear cells (PBMCs)
Circulating PBMCs function in the comprehensive surveillance of the body for signs of infection and disease and have proven useful in the evaluation of disease-induced gene expression profiles as a biomarker of disease status or severity.54 Molecular classification using transcriptional profiles in PBMCs have been able to distinguish several autoimmune diseases from healthy volunteers (i.e. type 1 diabetes, systemic lupus erythematosus, rheumatoid arthritis, multiple sclerosis72), and distinguish between CD and UC.50,54 A PBMC cell-based gene expression signature provides a molecular diagnostic tool for CD and UC. The cell composition of PBMCs is 52% lymphocytes, 29.4% monocytes and 15% neutrophils; eosinophils and basophils are about 2% of the population.54 Neutrophils and endothelial cells release large amounts of adenosine at sites of metabolic distress, infection or inflammation.73 Adenosine receptors on monocytes (and macrophages) permit these cells to fine-tune their responses to stressful stimuli. Purine gene dysregulation in monocytes/PBMCs will affect the secretion of extracellular mediators released in response to toll-like receptor ligands and other inflammatory events. Monocytes secrete reactive oxygen species, a process that is crucial for the bactericidal activation of macrophages.74 Adenosine could suppress the oxidative burst in monocytes/macrophages via ADORA3. Inhibition of TNF-α production by monocytes/macrophages may involve ADORA3, ADORA1 and ADORA2A.74-76 ADORA1 and ADORA3 gene expression remains unchanged in CD and UC in our analysis in PBMCs, and hence their important inhibitory function is conserved. Inhibition via ADORA2A could be enhanced in CD since ADORA2A gene expression is up-regulated, and attenuated in UC by being down-regulated. In addition, facilitation of IL-10 production and secretion by monocytes77 may contribute to immunosuppressive and anti-inflammatory effects via A2A and A2B receptors.74 A2 receptor-mediated IL-10 effects are expected to be enhanced in CD patients since ADORA2A and ADORA2B up-regulation occurs in PBMCs and compromised in UC patients since ADORA2A and ADORA2B are down-regulated in PBMCs.
Abnormalities in enzymes regulating endogenous purine levels
Gene expression profiles of various enzymes involved in the metabolism of purines such as ADAR, ADARB1, DPP4, AMPD2 and AMPD3 were altered by disease. DPP4 or CD26 is a T cell activation antigen and is directly associated with adenosine deaminase (ADA) on the surface of T cells.78 Released ADA binds to cell surface CD26, and this complex can reduce the local concentrations of adenosine – this is suggested to be an important immunomodulatory mechanism.79 DPP4/CD26 is also highly expressed in human gut epithelial cells, and its luminal expression is suggestive of transport functions.80 The observed up-regulation of DPP4 gene expression in UC would enhance ADA activity to further reduce local concentrations of adenosine in mucosa or PBMCs that include lymphocytes and monocytes. In PBMCs or biopsies from CD, adenosine levels could remain more elevated due to down-regulation of DPP4. Gene expression of ADK, an enzyme that catalyzes conversion of ADO to AMP or other nucleotides is not altered in IBD. Effects observed on AMPD enzymes would have opposite effects on AMP deamination in the two diseases and interactions with adenosine receptors.11 ADORA1 gene expression remains the same suggesting that inhibitory adenosinergic tone and modulation of mucosal reflexes in rodent 27 or human gut (Christofi & Wunderlich, unpublished observations) may be conserved.
Relationship between purines and gut inflammation
Pathway studio analysis revealed the many possible interactions between inflammation and the purinergic signaling pathways. There are significant interactions (positive or negative) between purines and inflammatory genes especially with chemokine, cytokine and oxidant genes (Figure 3; CCL3, CCL5, IFNγ, IL8, IL6, TNF, IL10, IL1β, IL12B, NOS2A). Such interactions and alterations in expression of inflammation or purine genes or both are likely to have more global impact on host responses and gut mucosal biology and reflexes.
Our analysis in CD biopsies established significant negative correlation between acute inflammatory score in IBD and ADORA3, P2RY13 and P2YR5. Therefore, severity of inflammation has a negative influence on expression of these purine genes. In UC, P2YR14 is the only purine gene that displays a strong positive correlation (up-regulated) with the severity of inflammation.
Analysis permitted further identification of the relationships between purines and inflammation in IBD. A key example is CD73/NT5E, a cell-surface membrane-bound enzyme that catalyzes the conversion of AMP to adenosine. CD73 is induced in disease states, and a strong stimulus for induction is ischemia.51,52 Our analysis revealed that mRNA for CD73 is up-regulated in both UC and CD. However, correlation analysis to determine associations between alterations in purine genes and inflammatory genes, or IPA/Canonical analysis to assess associations with various signaling pathways indicated that up-regulation of CD73 (or down-regulation of ADORA3) in IBD can distinguish between CD and UC. For example, alterations in genes involved in inflammatory processes (IGF1, HMOX1 and APOE, CXCL2, C3 and IL-1β) are significantly associated with CD73 over-expression in UC mucosal biopsy. Only a subset of these genes is significantly associated with CD73 over-expression in CD. In addition, CD73 over-expression is positively correlated with ADORA2A expression and negatively correlated with ADORA3 exclusively in CD mucosal biopsy. No such associations occur in PBMCs for CD73. Overall, significant associations (r-value ≥ 0.4) between CD73 and purine or inflammatory genes occurred in 8.8% of 57 genes tested for CD and 10.5% of genes for UC.
IPA/Canonical pathways provided evidence for significant associations between CD73 up-regulation and cAMP-mediated signaling, GPCR signaling and purine – GPCR genes in CD; associations with purine genes is restricted to CD for ADORA3 and ADORA2A (and does not occur in UC). Furthermore, IPA/Canonical pathways identified a similar significant association between ADORA3 down-regulation and the cAMP-CD73-GPCR signaling pathway in CD (not UC). An important recent publication in Gastroenterology81 provided proof for a functional cAMP-adenosinergic pathway in the intestine that is involved in neuroeffector responses. Our recent study in infection-induced gut inflammation emphasizes that gut inflammation can cause amplification in the GPCR/AC-cAMP signaling pathway leading to gut immune-neuroplasticity involving cAMP-dependent CREB transcriptional regulation.82 Together, our current analysis in IBD and data in the literature on experimental gut inflammation provide the basis of a novel hypothesis that an aberrant cAMP-AMP-CD73-adenosine – GPCR pathway may exist in the mucosa of CD patients but not UC patients. It is postulated that elevated cAMP levels during gut inflammation would provide increased substrate availability for AMP formation via phosphodiesterases and subsequent CD73 conversion to adenosine and activation of GPCRs (that are also known to be linked to AC/cAMP signaling). Sustained elevation of adenosine levels in the inflamed mucosa would cause down regulation of ADORA3 and perhaps other adenosine – GPCRs. This deserves further study. New finding indicate that IGF- signaling and IL-10 signaling were shown to be strongly associated with ADORA3 down regulation in CD (not UC) and are potential new targets for study.
Summary and Conclusions
In this paper, our CAGES and IPA/Canonical Pathways were used to analyze and integrate existing clinical gene expression data from different studies. High throughput technology in biomedicine such as gene chips results in large amount of publicly available raw experimental data. Unlike the traditional MetaAnalysis which focuses on combining existing analysis results from different studies, the new mechanistic and hypothesis-driven approach consists of carrying out new analysis on the raw experimental data. The analysis was not conducted or even intended in the original studies. With multiple datasets under different experimental and clinical conditions, we can correlate the regulation of gene expression with different disease or physiological conditions. This approach allows us to overcome some previously insurmountable hurdles in generating and testing new hypotheses such as collecting tissue samples from patients for all different conditions. It also underscores example of the importance of data sharing and cost-effectiveness in modern medicine. Using the CAGES/novel Pathways approach, we can screen a large class of genes or investigate more thoroughly a few highly relevant ones. This process has provided new insights into purine gene expression abnormalities in IBD, a novel way to test a new hypothesis in Crohn's or Ulcerative colitis, and suggests new hypotheses based on data from previous experiments. This provides the bases for further investigation.
Further analysis in more data sets is suggested by our studies to validate the unique cell-based signatures of purine gene dysregulation profiles in association with different signaling pathways includes inflammatory pathways that distinguish between CD and UC. Such differences could potentially lead to different functional gut-immune cell phenotypes. Purine gene signatures and their associated novel signaling pathways may be of diagnostic value in discriminating between UC and CD if they can be validated by quantitative RT-PCR and proteomic analysis. An expanded analysis with purine genes and related inflammatory genes may be of additional diagnostic value.
A better understanding of the functional consequences of purine gene dysregulation is essential to potential therapeutic targeting in IBD. The data seem to suggest that the same purine gene is not likely to be a therapeutic target common to both UC and CD.
Supplementary Material
Pathway Studio analysis revealed some of the interactions known to exist between genes involved in inflammatory signaling pathways and the 22 purine genes that we analyzed using the CAGES methodology. There are significant interactions (positive or negative) between purines and inflammatory genes especially with chemokine, cytokine and oxidant stress genes (Figure 3A; CCL3, CCL5, IFNG, IL8, IL6, TNF, IL10, IL1B, IL12B, NOS2A) that may be relevant in IBD. For clarity, not all pathway connections with purine genes are shown on the diagram; the diagram is limited only to direct interactions between a purine gene and another/inflammatory gene/pathway. This is relevant in IBD, because about half of the 22 purine genes were shown to be dysregulated in IBD.
Acknowledgments
National Institutes of Health (NIH) Grant RO1 DK44179-13 to F.L. Christofi.
Abbreviations
- ADO
adenosine
- eADO
endogenous adenosine
- AMPD2
adenosine monophosphate deaminase 2 (isoform L)
- ATP
adenosine-5′-triphosphate
- CD
Crohn's disease
- UC
ulcerative colitis
- IBD
inflammatory bowel diseases
- IB-MECA
N6-(3-iodobenzyl)adenosine-5′N-methyluronamide
- PBMCs
peripheral blood mononuclear cells
- EC
enterochromaffin cells
- ENS
enteric nervous systems
- GPCR
G-protein coupled receptors
- GI
gastrointestinal system
- TNF
tumor necrosis factor (TNF superfamily, member 2)
- NOS2
nitric oxide synthase 2 inducible
- IFNG
interferon-γ
- IL6
interleukin 6
- IL8
interleukin 8
- IFNA1
similar to Interferon alpha-1 precursor (predicted)
- IL12B
interleukin 12b
- CCL2
chemokine (C-C motif) ligand 12 (predicted)
- SELP
selectin, platelet
- IL10
interleukin 10
- CCR1
chemokine (C-C motif) receptor 1
- IL1B
interleukin 1 beta
- CCL5
chemokine (C-C motif) ligand 5
- CCL3
chemokine (C-C motif) ligand 3
- DPP4
dipeptidylpeptidase 4
- P2RX3
purinergic receptor P2X, ligand-gated ion channel, 3
- P2RX2
purinergic receptor P2X, ligand-gated ion channel, 2
- P2RY1
purinergic receptor P2Y, G-protein coupled 1
- P2RX1
purinergic receptor P2X, ligand-gated ion channel, 1
- P2RX5
purinergic receptor P2X, ligand-gated ion channel, 5
- PGK1
phosphoglycerate kinase 1
- ADORA3
adenosine A3 receptor
- ADAR
adenosine deaminase, RNA-specific
- ADORA2A
adenosine A2a receptor
- NT5E (CD73)
5′ nucleotidase, ecto
- ADARB2
adenosine deaminase, RNA-specific, B2
- IFNB1
interferon beta 1, fibroblast
- P2RY2
purinergic receptor P2Y, G-protein coupled 2
- ADORA1
adenosine A1 receptor
- P2RX4
purinergic receptor P2X, ligand-gated ion channel 4
- ADK
adenosine kinase
- P2RY6
pyrimidinergic receptor P2Y, G-protein coupled, 6
- P2RY14
purinergic receptor P2Y, G-protein coupled, 14
- ADORA2B
adenosine A2B receptor
- AMPD3
adenosine monophosphate deaminase 3
- P2RY13
purinergic receptor P2Y, G-protein coupled, 13
- P2RY5
similar to purinergic receptor P2Y, G-protein coupled, 5
References
- 1.Cronstein BN, Naime D, Ostad E. The anti-inflammatory mechanism of methotrexate: increased adenosine release at inflamed sites diminished leukocyte accumulation in an in vivo model of inflammation. J Clin Invest. 1993;92:2675–2682. doi: 10.1172/JCI116884. [DOI] [PMC free article] [PubMed] [Google Scholar]
- 2.Marak GE, Jr, de Kozak Y, Faure JP, et al. Pharmacologic modulation of acute ocular inflammation I Adenosine. Ophthalmic Res. 1988;20:220–226. doi: 10.1159/000266646. [DOI] [PubMed] [Google Scholar]
- 3.Schrier DJ, Lesch ME, Wright CD, et al. The anti-inflammatory effects of adenosine receptor agonists on the carrageenan-induced pleural inflammatory response in rats. J Immunol. 1990;145:1874–1879. [PubMed] [Google Scholar]
- 4.Hasko G, Szabo C. Regulation of cytokine and chemokine production by transmitters and co-transmitters of the autonomic nervous system. Biochem Pharmacol. 1998;56:1079–1087. doi: 10.1016/s0006-2952(98)00153-1. [DOI] [PubMed] [Google Scholar]
- 5.Hasko G, Kuhel DG, Chen JF, et al. Adenosine inhibits IL-12 and TNF-alpha production via adenosine A2a receptor-dependent and independent mechanisms. FASEB J. 2000;14:2065–2074. doi: 10.1096/fj.99-0508com. [DOI] [PubMed] [Google Scholar]
- 6.Cooke HJ, Wunderlich J, Christofi FL. “The force be with you” – ATP in Gut Mechanosensory Transduction. NIPS. 2003;18:43–49. doi: 10.1152/nips.01411.2002. [DOI] [PubMed] [Google Scholar]
- 7.Christofi FL. Unlocking mysteries of gut sensory transmission: is adenosine the key? NIPS. 2001;16:201–207. doi: 10.1152/physiologyonline.2001.16.5.201. [DOI] [PubMed] [Google Scholar]
- 8.Cooke HJ, Javed N, Christofi FL. Enteric Neural Reflexes & Secretion. In: Goetzl E, Blennerhassett M, Bienestock J, editors. Autonomic Nervous System, Autonomic Neuroimmunology. Vol. 16. Reading, Brookshire, UK: Harwood Academic Publishers; 2003. pp. 35–59. [Google Scholar]
- 9.Cooke HJ, Xue J, Yu JG, et al. Mechanical stimulation releases nucleotides that activate P2Y1 receptors to trigger neural reflex chloride secretion in guinea pig distal colon. J Comp Neurol. 2004;469(1):1–15. doi: 10.1002/cne.10960. [DOI] [PubMed] [Google Scholar]
- 10.Christofi FL, Wunderlich J, Yu JG, et al. Mechanically evoked reflex electrogenic chloride secretion in rat distal colon is triggered by endogenous nucleotides acting at P2Y1, P2Y2, and P2Y4 receptors. J Comp Neurol. 2004;469(1):16–36. doi: 10.1002/cne.10961. [DOI] [PubMed] [Google Scholar]
- 11.Christofi FL. Purinergic Receptors and Gastrointestinal Secretomotor Function. Purinergic Signalling. doi: 10.1007/s11302-008-9104-4. In Press. [DOI] [PMC free article] [PubMed] [Google Scholar]
- 12.Costenla AR, de Mendonca A, Ribeiro JA. Adenosine modulates synaptic plasticity in hippocampal slices from aged rats. Brain Res. 1999;851:228–234. doi: 10.1016/s0006-8993(99)02194-0. [DOI] [PubMed] [Google Scholar]
- 13.Linden J. Cloned adenosine A3 receptors: pharmacological properties, species differences and receptor functions. Trends Pharmacol Sci. 1994;15:298–306. doi: 10.1016/0165-6147(94)90011-6. [DOI] [PubMed] [Google Scholar]
- 14.Borman S, Washington C, Washington EN. A3 Receptors. Compounds that activate or inhibit adenosine A3 receptors are being studied for potential therapeutic use in heart disease and cancer. Sci & Technol. 2001;79:37–40. [Google Scholar]
- 15.Cavalcante IC, Castro MV, Barreto AR, et al. Effect of novel A2A adenosine receptor agonist ATL 313 on Clostridium difficile toxin A-induced murine ileal enteritis. Infect Immun. 2006;74(5):2606–2612. doi: 10.1128/IAI.74.5.2606-2612.2006. [DOI] [PMC free article] [PubMed] [Google Scholar]
- 16.Naganuma M, Wiznerowicz EB, Lappas CM, et al. Cutting edge: Critical role for A2A adenosine receptors in the T cell-mediated regulation of colitis. J Immunol. 2006;177(5):2765–2769. doi: 10.4049/jimmunol.177.5.2765. [DOI] [PubMed] [Google Scholar]
- 17.Odashima M, Bamias G, Rivera-Nieves J, et al. Activation of A2A adenosine receptor attenuates intestinal inflammation in animal models of inflammatory bowel disease. Gastroenterology. 2005;129(1):26–33. doi: 10.1053/j.gastro.2005.05.032. [DOI] [PubMed] [Google Scholar]
- 18.Guzman J, Yu JG, Suntres Z, et al. ADOA3R as a therapeutic target in experimental colitis: proof by validated high-density oligonucleotide microarray analysis. Inflamm Bowel Dis. 2006;12(8):766–789. doi: 10.1097/00054725-200608000-00014. [DOI] [PubMed] [Google Scholar]
- 19.Dragunow M, Faull RL. Neuroprotective effects of adenosine. Trends Pharmacol Sci. 1988;9:193–194. doi: 10.1016/0165-6147(88)90079-x. [DOI] [PubMed] [Google Scholar]
- 20.Ahonen A, Kyosola K, Penttila O. Enterochromaffin cells in macrophages in ulcerative colitis and irritable colon. Ann Clin Res. 1976;8:1–7. [PubMed] [Google Scholar]
- 21.Apasov S, Koshiba M, Redegeld F, et al. Role of extracellular ATP and P1 and P2 classes of purinergic receptors in T-cell development and cytotoxic T lymphocyte effector functions. Immunol Rev. 1995;146:5–19. doi: 10.1111/j.1600-065x.1995.tb00680.x. [DOI] [PubMed] [Google Scholar]
- 22.Broussas M, Cornillet-Lefebvre P, Potron G, et al. Inhibition of fMLP-triggered respiratory burst of human monocytes by adenosine: involvement of A3 adenosine receptor. J Leukoc Biol. 1999;66:495–501. [PubMed] [Google Scholar]
- 23.Mabley J, Soriano F, Pacher P, et al. The adenosine A3 receptor agonist, N6-(3-iodobenyl)-adenosine-5′-N-methyluronamide, is protective in two murine models of colitis. Eur J Pharmacol. 2003;466:323–329. doi: 10.1016/s0014-2999(03)01570-x. [DOI] [PubMed] [Google Scholar]
- 24.Siegmund B, Rieder F, Albrich S, et al. Adenosine kinase inhibitor GP515 improves experimental colitis in mice. JPET. 2001;296:99–105. [PubMed] [Google Scholar]
- 25.Christofi FL, Zhang H, Yu JG, et al. Differential gene expression of adenosine A1, A2a, A2b, and A3 receptors in the human enteric nervous system. J Comp Neurol. 2001;439(1):46–64. doi: 10.1002/cne.1334. [DOI] [PubMed] [Google Scholar]
- 26.Cooke HJ, Christofi FL. Enteric Neural Regulation of Mucosal Secretion. In: Johnson LR, editor. Physiology of the Gastrointestinal Tract. 4th. New York, NY: Academic Press; 2006. pp. 737–762. [Google Scholar]
- 27.Cooke HJ, Wang Y, Liu CY, et al. Activation of neuronal adenosine A1 receptors suppresses secretory reflexes in the guinea pig colon. Am J Physiol. 1999;276(2 Pt 1):G451–G462. doi: 10.1152/ajpgi.1999.276.2.G451. [DOI] [PubMed] [Google Scholar]
- 28.Castelucci P, Robbins HL, Poole DP, et al. The distribution of purine P2X(2) receptors in the guinea-pig enteric nervous system. Histochem Cell Biol. 2002;117(5):415–422. doi: 10.1007/s00418-002-0404-4. [DOI] [PubMed] [Google Scholar]
- 29.Hu HZ, Gao N, Lin Z, et al. P2X(7) receptors in the enteric nervous system of guinea-pig small intestine. J Comp Neurol. 2001;440(3):299–310. doi: 10.1002/cne.1387. [DOI] [PubMed] [Google Scholar]
- 30.Ruan HZ, Burnstock G. P2X2 and P2X3 receptor expression in the gallbladder of the guinea pig. Auton Neurosci. 2004;111(2):89–96. doi: 10.1016/j.autneu.2004.03.002. [DOI] [PubMed] [Google Scholar]
- 31.Ruan HZ, Burnstock G. The distribution of P2X5 purinergic receptors in the enteric nervous system of mouse. Cell Tissue Res. 2005;319(2):191–200. doi: 10.1007/s00441-004-1002-7. [DOI] [PubMed] [Google Scholar]
- 32.Van Nassauw L, Brouns I, Adriaensen D, et al. Neurochemical identification of enteric neurons expressing P2X(3) receptors in the guinea-pig ileum. Histochem Cell Biol. 2002;118(3):193–203. doi: 10.1007/s00418-002-0447-6. [DOI] [PubMed] [Google Scholar]
- 33.Van Nassauw L, Costagliola A, Van Op den Bosch J, Cecio, et al. Region-specific distribution of the P2Y4 receptor inenteric glial cells and interstitial cells of Cajal within the guinea-pig gastrointestinal tract. Auton Neurosci. 2006;126-127:299–306. doi: 10.1016/j.autneu.2006.02.018. [DOI] [PubMed] [Google Scholar]
- 34.Xiang Z, Burnstock G. Distribution of P2Y(6) and P2Y(12) receptor: their colocalization with calbindin, calretinin and nitric oxide synthase in the guinea pig enteric nervous system. Histochem Cell Biol. 2006;125(4):327–336. doi: 10.1007/s00418-005-0071-3. [DOI] [PubMed] [Google Scholar]
- 35.Xiang Z, Burnstock G. Distribution of P2Y2 receptors in the guinea pig enteric nervous system and its coexistence with P2X2 and P2X3 receptors, neuropeptide Y, nitric oxide synthase and calretinin. Histochem Cell Biol. 2005;124(5):379–390. doi: 10.1007/s00418-005-0043-7. [DOI] [PubMed] [Google Scholar]
- 36.Xiang Z, Burnstock G. P2X2 and P2X3 purinoceptors in the rat enteric nervous system. Histochem Cell Biol. 2004;121(3):169–179. doi: 10.1007/s00418-004-0620-1. [DOI] [PubMed] [Google Scholar]
- 37.Christofi FL, Kim M, Wunderlich JE, et al. Endogenous adenosine differentially modulates 5-hydroxytryptamine from a human enterochromaffin cell model. Gastroenterology. 2004;127:188–202. doi: 10.1053/j.gastro.2004.04.070. [DOI] [PubMed] [Google Scholar]
- 38.Xue J, Christofi FL, Cooke HJ. Mechanosensitive release of calcium or 5HT: P2Y1 receptor over-expression in human Bon cells. Gastroenterology. 2007;132 2:A–242. [Google Scholar]
- 39.Xue J, Christofi FL, Cooke HJ. P2Y12 receptors inhibit mechanosensitive release of 5-HT from human carcinoid Bon cells. Gastroenterology. 2007;132 2:A–546. [Google Scholar]
- 40.Wunderlich JE, Needleman BJ, Chen Z, et al. Dual purinergic synaptic transmission in the human enteric nervous system. Am J Physiol Gastrointest Liver Physiol. 2008;294(2):G554–566. doi: 10.1152/ajpgi.00500.2007. [DOI] [PubMed] [Google Scholar]
- 41.von Armin CAF, Timmler M, Ludolph AC, et al. Adenosine receptor up-regulation: initiated upon preconditioning but not upheld. Mol Sci. 2000;11:1223–1226. doi: 10.1097/00001756-200004270-00016. [DOI] [PubMed] [Google Scholar]
- 42.Walker BAM, Jacobson MA, Knight DA, et al. Adenosine A3 receptor expression and function in eosinophils. Am J Respir Cell Mol Biol. 1997;16:531–537. doi: 10.1165/ajrcmb.16.5.9160835. [DOI] [PubMed] [Google Scholar]
- 43.Jacobson KA. Adenosine A3 receptors: novel ligands and paradoxical effects. Trends Pharmacol Sci. 1998:184–191. doi: 10.1016/s0165-6147(98)01203-6. [DOI] [PMC free article] [PubMed] [Google Scholar]
- 44.Nie Z, Mei Y, Ford M, Rybak L, Marcuzzi A, Ren H, Stiles GL, Ramkumar V. Oxidative stress increases A1 adenosine receptor expression by activating nuclear factor kappa B. Mol Pharmacol. 1998;53(4):663–669. doi: 10.1124/mol.53.4.663. [DOI] [PubMed] [Google Scholar]
- 45.Coulson R, Proch PS, Olsson RA, Chalfant CE, Cooper DR. Upregulated renal adenosine A1 receptors augment PKC and glucose transport but inhibit proliferation. Am J Physiol. 1996;270(2 Pt 2):F263–F2674. doi: 10.1152/ajprenal.1996.270.2.F263. [DOI] [PubMed] [Google Scholar]
- 46.Biber K, Fiebich BL, Gebicke-Harter P, van Calker D. Carbamazepine-induced upregulation of adenosine A1-receptors in astrocyte cultures affects coupling to the phosphoinositol signaling pathway. Neuropsychopharmacology. 1999;20(3):271–278. doi: 10.1016/S0893-133X(98)00059-1. [DOI] [PubMed] [Google Scholar]
- 47.Gerwins P, Fredholm BB. Glucocorticoid receptor activation leads to up-regulation of adenosine A1 receptors and down-regulation of adenosine A2 responses in DDT1 MF-2 smooth muscle cells. Mol Pharmacol. 1991;40(2):149–155. [PubMed] [Google Scholar]
- 48.Jarvis MF, Becker HC. Single and repeated episodes of ethanol withdrawal increase adenosine A1, but not A2A, receptor density in mouse brain. Brain Res. 1998;786(1-2):80–88. doi: 10.1016/s0006-8993(97)01413-3. [DOI] [PubMed] [Google Scholar]
- 49.Sundaram U, Hassanain H, Suntres Z, et al. Rabbit chronic ileitis leads to up-regulation of adenosine A1/A3 gene products, oxidative stress, and immune modulation. Biochem Pharmacol. 2003;65(9):1529–1538. doi: 10.1016/s0006-2952(03)00067-4. [DOI] [PubMed] [Google Scholar]
- 50.Yiangou Y, Facer P, Baecker PA, et al. ATP-gated ion channel P2X(3) is increased in human inflammatory bowel disease. Neurogastroenterol Motil. 2001;13(4):365–369. doi: 10.1046/j.1365-2982.2001.00276.x. [DOI] [PubMed] [Google Scholar]
- 51.Eckle T, Krahn T, Grenz A, et al. Cardioprotection by ecto-5′-nucleotidase (CD73) and A2B adenosine receptors. Circulation. 2007;115(12):1581–1590. doi: 10.1161/CIRCULATIONAHA.106.669697. [DOI] [PubMed] [Google Scholar]
- 52.Thompson LF, Eltzschig HK, Ibla JC, et al. Crucial role for ecto-5′-nucleotidase (CD73) in vascular leakage during hypoxia. J Exp Med. 2004;200(11):1395–1405. doi: 10.1084/jem.20040915. [DOI] [PMC free article] [PubMed] [Google Scholar]
- 53.Costello CM, Mah N, Hasler R, et al. Dissection of the inflammatory bowel disease transcriptome using genome-wide cDNA microarrays. PLoS Med. 2005 Aug;2(8):e199, 0771–0787. doi: 10.1371/journal.pmed.0020199. [DOI] [PMC free article] [PubMed] [Google Scholar]
- 54.Burczynski ME, Peterson RL, Twine NC, et al. Molecular classification of Crohn's disease and ulcerative colitis patients using transcriptional profiles in peripheral blood mononuclear cells. J Mol Diagn. 2006;8(1):51–61. doi: 10.2353/jmoldx.2006.050079. [DOI] [PMC free article] [PubMed] [Google Scholar]
- 55.Antonioli L, Fornai M, Colucci R, et al. A2a receptors mediate inhibitory effects of adenosine on colonic motility in the presence of experimental colitis. Inflamm Bowel Dis. 2006;12(2):117–122. doi: 10.1097/01.MIB.0000198535.13822.a9. [DOI] [PubMed] [Google Scholar]
- 56.De Man JG, Seerden TC, De Winter BY, et al. Alteration of the purinergic modulation of enteric neurotransmission in the mouse ileum during chronic intestinal inflammation. Br J Pharmacol. 2003;139:172–184. doi: 10.1038/sj.bjp.0705218. [DOI] [PMC free article] [PubMed] [Google Scholar]
- 57.van Troostenburg AR, Clark EV, Carey WD, et al. Tolerability, pharmacokinetics and concentration-dependent hemodynamic effects of oral CF101, an A3 adenosine receptor agonist, in healthy young men. Int J Clin Pharmacol Ther. 2004 Oct;42(10):534–542. doi: 10.5414/cpp42534. [DOI] [PubMed] [Google Scholar]
- 58.Jacobson KA, Gao ZG. Adenosine receptors as therapeutic targets. Nat Rev Drug Discov. 2006;5(3):247–264. doi: 10.1038/nrd1983. [DOI] [PMC free article] [PubMed] [Google Scholar]
- 59.Mannick EE, Bonomolo JC, Horswell R, et al. Gene expression in mononuclear cells from patients with inflammatory bowel disease. Clin Immunol. 2004;112(3):247–257. doi: 10.1016/j.clim.2004.03.014. [DOI] [PubMed] [Google Scholar]
- 60.Lawrance IC, Fiocchi C, Chakravarti S. Ulcerative colitis and Crohn's disease: distinctive gene expression profiles and novel susceptibility candidate genes. Hum Mol Genet. 2001;10(5):445–456. doi: 10.1093/hmg/10.5.445. [DOI] [PubMed] [Google Scholar]
- 61.Dieckgraefe BK, Stenson WF, Korzenik JR, et al. Analysis of mucosal gene expression in inflammatory bowel disease by parallel oligonucleotide arrays. Physiol Genomics. 2000;4(1):1–11. doi: 10.1152/physiolgenomics.2000.4.1.1. [DOI] [PubMed] [Google Scholar]
- 62.Leipziger J. Control of epithelial transport via luminal P2 receptors. Am J Physiol Renal Physiol. 2003;284(3):F419–F432. doi: 10.1152/ajprenal.00075.2002. [DOI] [PubMed] [Google Scholar]
- 63.Rivkees SA, Reppert SM. RFL9 encodes an A2b-adenosine receptor. Mol Endocrinol. 1992;6(10):1598–1604. doi: 10.1210/mend.6.10.1333049. [DOI] [PubMed] [Google Scholar]
- 64.Strohmeier GR, Lencer WI, Patapoff TW, et al. Surface expression, polarization, and functional significance of CD73 in human intestinal epithelia. J Clin Invest. 1997;99(11):2588–2601. doi: 10.1172/JCI119447. [DOI] [PMC free article] [PubMed] [Google Scholar]
- 65.Jijon HB, Walker J, Hoentjen F, et al. Adenosine is a negative regulator of NF-kappaB and MAPK signaling in human intestinal epithelial cells. Cell Immunol. 2005;237(2):86–95. doi: 10.1016/j.cellimm.2005.10.005. [DOI] [PubMed] [Google Scholar]
- 66.Eltzschig HK, Ibla JC, Furuta GT, et al. Coordinated adenine nucleotide phosphohydrolysis and nucleoside signaling in posthypoxic endothelium: role of ectonucleotidases and adenosine A2B receptors. J Exp Med. 2003;198(5):783–796. doi: 10.1084/jem.20030891. [DOI] [PMC free article] [PubMed] [Google Scholar]
- 67.Madara JL, Nash S, Parkos C. Neutrophil-epithelial cell interactions in the intestine. Adv Exp Med Biol. 1991;314:329–334. doi: 10.1007/978-1-4684-6024-7_22. [DOI] [PubMed] [Google Scholar]
- 68.Sitaraman SV, Merlin D, Wang L, et al. Neutrophil-epithelial crosstalk at the intestinal lumenal surface mediated by reciprocal secretion of adenosine and IL-6. J Clin Invest. 2001;107(7):861–869. doi: 10.1172/JCI11783. [DOI] [PMC free article] [PubMed] [Google Scholar]
- 69.Sanchez-Pozo A, Gil A. Nucleotides as semiessential nutritional components. Br J Nutr. 2002;87:S135–137. doi: 10.1079/bjn2001467. [DOI] [PubMed] [Google Scholar]
- 70.Kadowaki M, Nagakura Y, Tokita K, et al. Adenosine A1 receptor blockade reverses experimental postoperative ileus in rat colon. Eur J Pharmacol. 2003;458(1-2):197–200. doi: 10.1016/s0014-2999(02)02766-8. [DOI] [PubMed] [Google Scholar]
- 71.Kimura Y, Turner JR, Braasch DA, et al. Lumenal adenosine and AMP rapidly increase glucose transport by intact small intestine. Am J Physiol Gastrointest Liver Physiol. 2005;289(6):G1007–G1014. doi: 10.1152/ajpgi.00085.2005. [DOI] [PubMed] [Google Scholar]
- 72.Maas K, Chan S, Parker J, et al. Cutting edge: molecular portrait of human autoimmune disease. J Immunol. 2002;169:5–9. doi: 10.4049/jimmunol.169.1.5. [DOI] [PubMed] [Google Scholar]
- 73.Hasko G, Pacher P, Deitch EA, et al. Shaping of monocyte and macrophage function by adenosine receptors. Pharmacol Ther. 2007;113(2):264–275. doi: 10.1016/j.pharmthera.2006.08.003. [DOI] [PMC free article] [PubMed] [Google Scholar]
- 74.Forman HJ, Torres M. Reactive oxygen species and cell signaling: respiratory burst in macrophage signaling. Am J Respir Crit Care Med. 2002;166(12 Pt 2):S4–8. doi: 10.1164/rccm.2206007. [DOI] [PubMed] [Google Scholar]
- 75.Sajjadi FG, Takabayashi K, Foster AC, et al. Inhibition of TNF-alpha expression by adenosine: role of A3 adenosine receptors. J Immunol. 1996;156(9):3435–3442. [PubMed] [Google Scholar]
- 76.Mayne M, Shepel PN, Jiang Y, et al. Dysregulation of adenosine A1 receptor-mediated cytokine expression in peripheral blood mononuclear cells from multiple sclerosis patients. Ann Neurol. 1999;45(5):633–639. doi: 10.1002/1531-8249(199905)45:5<633::aid-ana12>3.0.co;2-x. [DOI] [PubMed] [Google Scholar]
- 77.Khoa ND, Montesinos MC, Reiss AB, et al. Inflammatory cytokines regulate function and expression of adenosine A(2A) receptors in human monocytic THP-1 cells. J Immunol. 2001;167(7):4026–4032. doi: 10.4049/jimmunol.167.7.4026. [DOI] [PubMed] [Google Scholar]
- 78.Dong RP, Kameoka J, Hegen M, et al. Characterization of adenosine deaminase binding to human CD26 on T cells and its biologic role in immune response. J Immunol. 1996;156(4):1349–1355. [PubMed] [Google Scholar]
- 79.Ben-Shooshan I, Kessel A, Ben-Tal N, et al. On the regulatory role of dipeptidyl peptidase IV (DPP4 = adenosine deaminase complexing protein) on adenosine deaminase activity. Biochim Biophys Acta. 2002;1587(1):21–30. doi: 10.1016/s0925-4439(02)00050-9. [DOI] [PubMed] [Google Scholar]
- 80.Dinjens WN, ten Kate J, van der Linden EP, et al. Distribution of adenosine deaminase complexing protein (ADCP) in human tissues. J Histochem Cytochem. 1989;37(12):1869–1875. doi: 10.1177/37.12.2573631. [DOI] [PubMed] [Google Scholar]
- 81.Giron MC, Bin A, Brun P, et al. Cyclic AMP in rat ileum: evidence for the presence of an extracellular cyclic AMP-adenosine pathway. Gastroenterology. 2008;134(4):1116–1126. doi: 10.1053/j.gastro.2008.01.030. [DOI] [PubMed] [Google Scholar]
- 82.Chen Z, Suntres Z, Palmer J, et al. Cyclic AMP signaling contributes to neural plasticity and hyperexcitability in AH sensory neurons following intestinal Trichinella spiralis-induced inflammation. Int J Parasitol. 2007;37(7):743–61. doi: 10.1016/j.ijpara.2006.12.018. [DOI] [PubMed] [Google Scholar]
Associated Data
This section collects any data citations, data availability statements, or supplementary materials included in this article.
Supplementary Materials
Pathway Studio analysis revealed some of the interactions known to exist between genes involved in inflammatory signaling pathways and the 22 purine genes that we analyzed using the CAGES methodology. There are significant interactions (positive or negative) between purines and inflammatory genes especially with chemokine, cytokine and oxidant stress genes (Figure 3A; CCL3, CCL5, IFNG, IL8, IL6, TNF, IL10, IL1B, IL12B, NOS2A) that may be relevant in IBD. For clarity, not all pathway connections with purine genes are shown on the diagram; the diagram is limited only to direct interactions between a purine gene and another/inflammatory gene/pathway. This is relevant in IBD, because about half of the 22 purine genes were shown to be dysregulated in IBD.