Abstract
Periods of low frequency stimulation are known to increase the net Ca2+ uptake in skeletal muscle but the mechanism responsible for this Ca2+ entry is not known. In this study a novel high-resolution fluorescence microscopy approach allowed the detection of an action potential-induced Ca2+ flux across the tubular (t-) system of rat extensor digitorum longus muscle fibres that appears to be responsible for the net uptake of Ca2+ in working muscle. Action potentials were triggered in the t-system of mechanically skinned fibres from rat by brief field stimulation and t-system [Ca2+] ([Ca2+]t-sys) and cytoplasmic [Ca2+] ([Ca2+]cyto) were simultaneously resolved on a confocal microscope. When initial [Ca2+]t-sys was ≥ 0.2 mm a Ca2+ flux from t-system to the cytoplasm was observed following a single action potential. The action potential-induced Ca2+ flux and associated t-system Ca2+ permeability decayed exponentially and displayed inactivation characteristics such that further Ca2+ entry across the t-system could not be observed after 2–3 action potentials at 10 Hz stimulation rate. When [Ca2+]t-sys was closer to 0.1 mm, a transient rise in [Ca2+]t-sys was observed almost concurrently with the increase in [Ca2+]cyto following the action potential. The change in direction of Ca2+ flux was consistent with changes in the direction of the driving force for Ca2+. This is the first demonstration of a rapid t-system Ca2+ flux associated with a single action potential in mammalian skeletal muscle. The properties of this channel are inconsistent with a flux through the L-type Ca2+ channel suggesting that an as yet unidentified t-system protein is conducting this current. This action potential-activated Ca2+ flux provides an explanation for the previously described Ca2+ entry and accumulation observed with prolonged, intermittent muscle activity.
Ca2+ entry into cells is a fundamental process to regulate cytoplasmic [Ca2+], [Ca2+] in intracellular stores and many Ca2+-dependent intracellular processes from gene expression to muscle contraction (Berchtold et al. 2000). Cardiac cells have an absolute requirement for Ca2+ entry via the L-type Ca2+ channel upon excitation to induce Ca2+ release from the sarcoplasmic reticulum (SR) and consequently activate the contractile apparatus. Another isoform of the L-type Ca2+ channel also exists in skeletal muscle (α1s of the dihydropyridine receptor (DHPR)) but the duration of membrane depolarization during a single action potential in skeletal fibres is too brief (2–5 ms), compared to that in cardiomyocytes (100–250 ms), to activate this channel to any detectable degree. Instead, the α1s-subunit of the L-type Ca2+ channel in skeletal muscle acts as a voltage sensor, which directly activates Ca2+ release from the SR (Melzer et al. 1995). This is not to say that skeletal muscle L-type Ca2+ channels cannot pass Ca2+, they simply require a relatively long period of depolarization that does not occur under normal physiological conditions, i.e. during a single twitch or during brief tetani. Yet, there is evidence for Ca2+ entry associated with periods of low frequency excitation (1–2 Hz) of skeletal muscle (Bianchi & Shanes, 1959; Curtis, 1966; Gissel & Clausen, 1999), but the mechanism of Ca2+ entry during normal excitation in adult skeletal muscle fibres has not been identified due to inherent limitations in the techniques used to record very small Ca2+ fluxes.
There are major limitations upon recording very small Ca2+ fluxes with conventional electrophysiological techniques. In the whole-cell configuration of skeletal muscle fibres resolution of the minute currents in the lower picoamp range are usually prevented by noise levels determined by the use of feedback resistors (50–500 MΩ) to resolve currents between 0.1 and 200 nA (e.g. MultiClamp Commander specifications, Molecular Devices, USA). The problem of recording small Ca2+ currents is further compounded by the long depolarizing pulses that significantly reduce the driving force for Ca2+ (DFCa) entry. Classically these small currents would be assessed with patch-clamp techniques. However, in skeletal muscle the major interface between myoplasm and extracellular environment is the transverse tubular system (t-system) membrane which exists as deep invagination from the surface membrane (Peachey, 1966). This membrane is not accessible to microelectrodes. A more sensitive technique employs mechanically skinned fibres in conjunction with a low affinity Ca2+-sensitive dye trapped in the t-system, the source compartment for the Ca2+ influx. The use of this preparation allows the derivation of t-system Ca2+ fluxes from net changes in t-system [Ca2+] ([Ca2+]t-sys). This method has enabled real-time analysis of the store-operated Ca2+ current across the t-system in muscle during Ca2+ release (Launikonis et al. 2003; Launikonis & Ríos, 2007) which has been inaccessible to careful electrophysiological measurements (Allard et al. 2006).
In the present study we simultaneously recorded dynamic changes in [Ca2+] in the sealed t-system ([Ca2+]t-sys) using the sensitive ‘shifted excitation and emission ratioing’ (SEER) [Ca2+] imaging technique (Launikonis et al. 2005) and changes in cytoplasmic [Ca2+] in response to single action potentials (Posterino et al. 2000) under conditions approaching the normal distribution of the major physiologically occurring ions. This allowed us to directly describe, for the first time, the t-system action potential-activated Ca2+ current (APACC) and characterize its basic properties.
Methods
All experimental methods were approved by the Institutional Animal Care and Use Committee at Rush University. Ten Sprague–Dawley rats (250–300 g) were used in this study. Rats were killed by a rising concentration of CO2 and the extensor digitorum longus (EDL) muscles were rapidly excised. Muscles were then placed in a Petri dish under paraffin oil above a layer of Sylgard.
The method of trapping fluorescent dye in the sealed t-system has been described (Lamb et al. 1995). Briefly, small bundles of fibres were isolated and exposed to a ‘dye solution’ while still intact. Individual fibres were then isolated and mechanically skinned. Skinned fibres were transferred to a custom-built experimental chamber with a coverslip bottom, where they were bathed in a standard K+-repriming solution. The preparation was positioned in the chamber between two platinum electrodes, which ran parallel to the longitudinal axis of the mounted fibre. Skinned fibres were electrically stimulated with a field pulse at approximately 70 V cm−1 for 2 ms, as described previously (Posterino et al. 2000; Launikonis et al. 2006).
Solutions
The dye solution was a physiological solution containing (mm): NaCl, 145; KCl, 3; CaCl2, 2.5; MgCl2, 2; mag-indo-1 salt, 10; and Hepes; 10 (pH adjusted to 7.4 with NaOH). Note that the apparent [mag-indo-1] per pixel in the confocal image associated with the t-system was in the range 2–50 μm. Given the much smaller volume of the t-system compared with the pixel size, the true [mag-indo-1] value in the t-system must be much higher than 50 μm but will be still considerably lower than the 10 mm applied to the external environment of the intact fibres. This is because there is dye loss from the t-system during the skinning procedure and some dye is also removed from the sealed t-system by anion transporters (Launikonis & Stephenson, 2002). The standard K+-repriming solution contained (mm): K+, 126; Na+, 36, Mg2+, 1; HDTA, 50; Hepes, 90; EGTA, 0.01; ATP, 8; creatine phosphate, 10; and rhod-2, 0.1. Osmolality was adjusted to 290 ± 10 mosmol kg−1 with sucrose and pH was set to 7.1 with KOH. This solution kept the sealed t-system polarized (Lamb & Stephenson, 1994). n-Benzyl-p-toluene sulphonamide (BTS; 50 μm; Sigma-Aldrich Co., St Louis, MO, USA) was added to suppress contraction without affecting excitability or Ca2+ movements (Cheung et al. 2002; Macdonald et al. 2005). 2-Aminoethyl diphenyl borate (2-APB; 0.1 mm; Sigma-Aldrich) and SKF-96356 (25 μm; Sigma-Aldrich) were added to solutions as required from a 100 mm stock in DMSO.
Confocal imaging and analysis
Imaging was as described in Launikonis et al. (2005) using a TCS SP2 confocal system (Leica) in the laboratory of Eduardo Ríos (Rush University Medical Center, Chicago, USA). Line scan images were obtained at 0.625 ms line−1 and 0.23 μm pixel−1, for a group scanning speed of 1.875 ms line−1. Simultaneous monitoring of [Ca2+]t-sys and cytoplasmic dye required three interleaved images: F1(x, t), F2(x, t) and F3(x, t), with excitation lines at 351, 364 and 543 nm and emission bands of 390–440, 465–535 and 562–666 nm, respectively. SEER ratio images R(x, t) =F1(x, t)/F2(x, t) were used to derive [Ca2+]t-sys as described in Launikonis & Ríos (2007) using the equation:
| (1) |
where γKD, Rmax and Rmin were 0.615 mm, 4.82 and 0.45, respectively. These parameters were determined in situ as described by Launikonis & Ríos (2007). F3(x, t) of rhod-2 in the internal solution was normalized by dividing it by the average resting value F3,0, a common procedure when using a non-ratiometric indicator of [Ca2+]cyto.
SEER images of 50 μm indo-5F in the cytoplasmic solution were also recorded during field stimulation. The parameters to define [Ca2+]cyto from R in the cytoplasm were derived in situ and the following parameters were derived from equations defined in Launikonis et al. (2005): Rmin= 0.5; Rmax= 3.2; and γKD= 2.38 μm.
Results
Action potential-induced Ca2+ release in mechanically skinned fibres
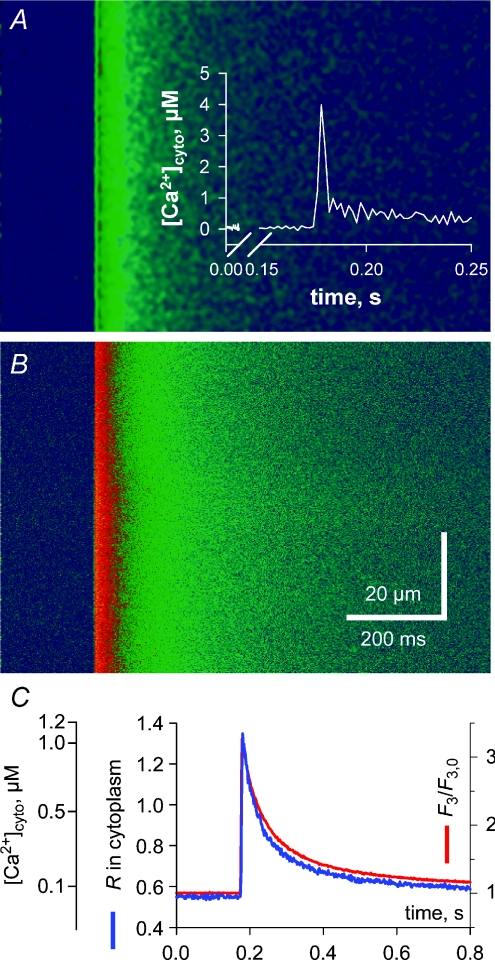
Figure 1 shows the transient rise in cytoplasmic [Ca2+] ([Ca2+]cyto) in a mechanically skinned fibre from the EDL muscle of the rat in response to electrical field stimulation. The ratio (R=F1/F2) image of indo-5F fluorescence in the cytoplasm is displayed in panel A and the simultaneous rhod-2 fluorescence image (F3) in B. The spatially averaged signals are represented in C showing little difference between the time course of the R and F3 signals. Note also that there was a spatially and temporally homogeneous rise in the fluorescence signals upon field stimulation. In the absence of the sarcolemma this indicates that an action potential was triggered in each transverse tubule in the imaging plane, which then synchronously propagated radially across the fibre.
Figure 1. Action potential activation of a global Ca2+ transient in a skinned fibre.
A, ratio (R) in the cytoplasm derived from the indo-5F fluorescence, which was simultaneously recorded with the F3 image of rhod-2 fluorescence in the cytoplasm (B) during a twitch in a skinned fibre from rat EDL muscle. C, spatially averaged profiles of R and F3. Inset in A is the derived Ca2+ transient from R corrected for dye kinetics, as described in the text.
The rise time of the fluorescence signals was 5.6 and 7.5 ms for F3 and R, respectively, and the peak of [Ca2+]cyto that is not corrected for the delay with which R tracks the actual [Ca2+]cyto changes, was 1.1 μm (Fig. 1C). This is similar to recordings made in intact skeletal muscle fibres using similar dyes (Westerblad & Allen, 1996; Jacquemond, 1997; Baylor & Hollingworth, 2003).
Correcting for the delay with which R tracks the actual [Ca2+]cyto (Fig. 1C) using eqn (2) from Bakker et al. (1997):
where k−1 for indo-5F was assumed to be 75 s−1 and γKD is 2.38 μm.[Ca2+]R is [Ca2+]cyto directly calculated from R of indo-5F in cytoplasm. Because k+1 is approximately the same for indo-1 and indo-5F, the k−1 of indo-5F will increase by the ratio of the KD values of indo-5F/indo-1. Zhou et al. (2006) calculated γKD of indo-1 in the cytoplasm to be 1.62 μm. Thus a k−1 of 55 s−1 for indo-1 (Westerblad & Allen, 1996) equates to 75 s−1 for indo-5F. The inset in Fig. 1A shows that the actual [Ca2+]cyto transient is much faster than the corresponding fluorescence signals (R, F3) and reaches a [Ca2+] peak of 4 μm that is markedly greater than the apparent [Ca2+] of 1.1 μm if the correction was not applied (see also Baylor & Hollingworth, 1988). However, the peak of the Ca2+ transient is also most likely ‘blunted’ by the (low) temporal resolution of the group scanning speed of the three lasers (2 ms; Royer et al. 2008).
Thus the skinned fibre releases Ca2+ at a normal rate and magnitude during excitation–contraction (EC) coupling (Posterino & Lamb, 2003; Launikonis et al. 2006). Indeed the absence of the sarcolemma in skinned fibres, like the absence of a nerve supply in isolated intact fibres, makes little difference to the function of the EC coupling machinery within the triads. Therefore we used this preparation to determine whether there is a Ca2+ current across the t-system associated with an action potential using a recently developed fluorescence technique (Launikonis & Ríos, 2007).
A rapidly available pathway for Ca2+ movement across the t-system
In these experiments, the ratiometric Ca2+-sensitive fluorescent dye mag-indo-1 was trapped in the sealed t-system to allow the measurement of its [Ca2+], [Ca2+]t-sys. Rhod-2 was simultaneously present in the cytoplasmic environment to allow myoplasmic [Ca2+] measurements, [Ca2+]cyto. Note that [Ca2+]t-sys in skinned fibres can be easily altered over a wide range of concentrations in the same preparation by altering the level of t-system membrane polarization and [Ca2+]cyto (Launikonis & Ríos, 2007). In order to help maximally polarize the t-system of skinned fibre preparations and fully re-prime the voltage sensors, a Cl−-free internal bathing solution was used (see Posterino et al. 2000; Methods). Note, however, that when the t-system is hyperpolarized, the ability of the t-system Ca2+ pumps to maintain a large [Ca2+]t-sys is reduced and the absence of Cl− will limit the rate at which the t-system can sustain trains of action potentials (Dutka et al. 2008). The maximum stimulation rate used in this study was 10 Hz.
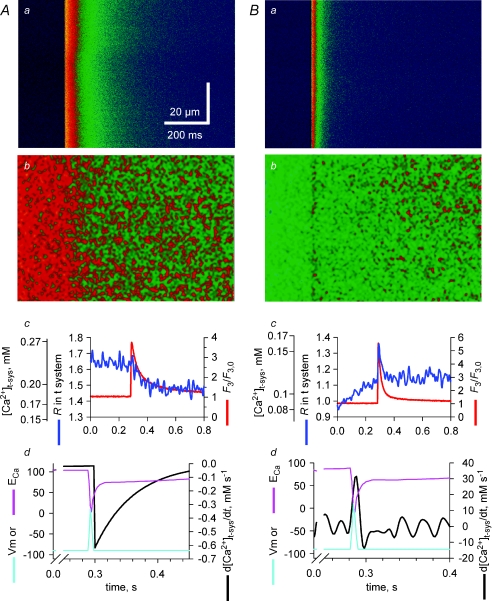
Figure 2 illustrates experiments comparing the evolution of [Ca2+]t-sys starting from two different levels (panels A or B). The action potential-induced Ca2+ release from the SR is visualized in panels Aa and Ba by corresponding changes in confocal line scans of rhod-2 fluorescence intensity (F3), while the changes in the mag-indo-1 ratio images R(x, t), reflecting changes in [Ca2+]t-sys, are shown in panels Ab and Bb. The spatially averaged values from these images are plotted vs. time in the respective c panels in Fig. 2. From Fig. 2A, one can observe a decrease in the t-system R value right from the time when the peak of the cytoplasmic [Ca2+] was reached. This indicates that there was a net flow of Ca2+ from the t-system into the cytoplasm following an action potential. In contrast, when the [Ca2+]t-sys was low at the time an action potential was triggered (Fig. 2B), there was a net initial outward flow of Ca2+ from the cytoplasm into the t-system that was rapidly reversed during the remainder of the action potential duration.
Figure 2. Action potential activation of a t-system Ca2+ current.
A and B represent two examples of simultaneous recordings of R in t-system (b) and F3 fluorescence in cytoplasm (a) during a field-stimulated action potential. Spatially averaged signals are represented in c for each example. Panels d represent the Ca2+ flux across the t-system, the modelled action potential and ECa. Note that the line scan images have been digitally filtered and thus the striated pattern of the t-system is no longer apparent (see Supplemental Fig. 1, available online only).
Because the t-system volume does not change during release (Launikonis & Ríos, 2007) the flux of Ca2+ across the t-system membrane is equal to β× d[Ca2+]t-sys/dt, where β is a proportionality constant, representing the t-system Ca2+-buffering capacity (Launikonis & Ríos, 2007). In Fig. 2Ad, d[Ca2+]t-sys/dt has been derived from an exponential fit to the [Ca2+]t-sys data in panel Ac (as derived from measured R values, eqn (1), Methods). Derivatives were calculated from fitted curves to the raw data in Fig. 2Ac to reduce the otherwise large amount of noise. The calculated changes in the membrane potential, Vm, during an action potential are also shown in panel Ad. The action potential was reconstructed as the sum of two first-order exponential functions, one rising with rate constant of 0.4 ms−1 and the other decaying with a rate constant of 0.23 ms−1 (Friedrich et al. 2004). The peak of the action potential and Ca2+ transient were assumed to be within 3 ms of each other, in line with experimental data (Delbono & Stefani, 1993; Claflin et al. 1994) and the argument made below. The action potential had a duration of < 6 ms (Nielsen et al. 2004; Friedrich et al. 2004) with a reduced peak at +10 mV because [Na+]cyto was 36 mm (Cairns et al. 2003) in the internal solution. In the example shown in Fig. 2A, the exponentially decaying Ca2+ flux was activated within milliseconds of the peak of the action potential-induced cytoplasmic Ca2+ transient and then decayed in an exponential manner within 200 ms.
In Fig. 2Bd, d[Ca2+]t-sys/dt has been calculated from [Ca2+]t-sys in Bc and the time course of the action potential is also shown. In this case, there is a clear and rapid flow of Ca2+ from the cytoplasmic space to the t-system at the time of excitation followed by a reversed flow within 10–20 ms of smaller magnitude. The rising baseline for R in the t-system before stimulation is probably due to gradual Ca2+ entry into the t-system mediated by the plasmalemmal Ca2+-ATPase located in the t-system membrane (Sachetto et al. 1996) after the t-system Ca2+ was initially depleted to very low values (Launikonis et al. 2003; Launikonis & Ríos, 2007). Since the Ca2+ pump in the t-system continues to transport Ca2+ into the t-system for some time over the period shown in panel Bc, the absence of a net rise in [Ca2+]t-sys after the action potential indicates a flow of Ca2+ from the t-system into the myoplasm via the pathway initiated by the action potential. This can be quantitatively corrected for as shown in Fig. 3.
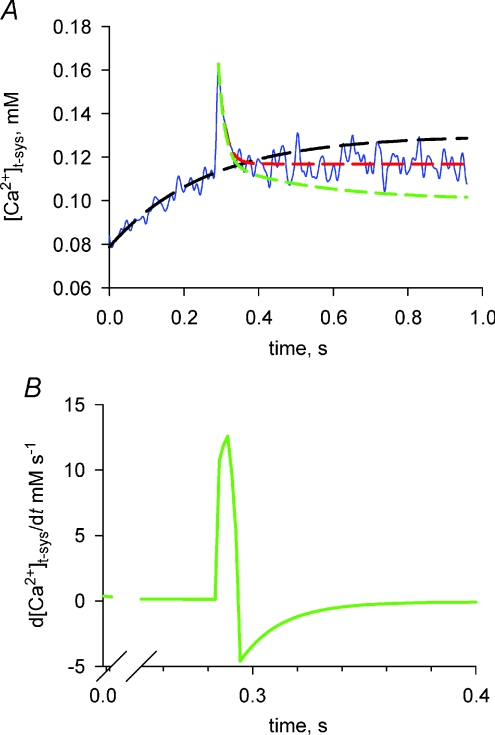
Figure 3. Correction for Ca2+ transport into the t-system to observe action potential-activated Ca2+ flux at low [Ca2+]t-sys.
A, the net change in [Ca2+]t-sys (from Fig. 2Bc) is shown (blue line); an exponential has been fitted to the rising baseline and extrapolated beyond the point where the fibre was stimulated (dashed black line; k= 3.9 ± 1.0 s−1 and r2= 0.84); a decaying exponential has been fitted to the net change in [Ca2+]t-sys from the point where Ca2+ flux has become inward (dashed red line; k= 55.0 ± 5.0 s−1 and r2= 0.54); and this has been corrected for Ca2+ transport (dashed green line; k= 22.0 ± 0.7 s−1 and r2= 0.92). B, the derivative indicating the Ca2+ flux taking into account the correction to remove the influence of Ca2+ transport on net [Ca2+]t-sys measurements is shown. Note the flux is initially outward and then reverses rapidly and continues for some 100 ms.
The rising baseline due to Ca2+ transport into the t-system prior to action potential-induced Ca2+ release has been fitted with an exponential and extrapolated for the duration of the measurement (dashed black line in Fig. 3A) to the data in Fig. 2Bc. The dashed red line in Fig. 3A fits the decline of the [Ca2+]t-sys transient following membrane repolarization, which causes reversal of the DFCa making the Ca2+ flux inward and the dashed green line represents the decline of the APACC contribution to the Ca2+ transient in the t-system, after subtracting the baseline.
Finally, in Fig. 3B is shown d[Ca2+]t-sys/dt of the APACC contribution to the Ca2+ transient in the t-system which is representative of the APACC itself. The outward Ca2+ flux (directed into the t-system) appears slightly longer than predicted by the model of DFCa (Fig. 2) due to smoothing of the raw data and the temporal resolution of 2 ms but still within experimental errors. This is followed by an inward Ca2+ flux which decays exponentially over 100 ms with a rate constant of 24 s−1.
As shown in Fig. 2Ad, the APACC in that case could also be fitted with a single exponential for 100 ms or so during the time when the membrane potential must have returned to the resting level. This indicates that once activated, the channels deactivated/inactivated with a rate constant of 25.2 ± 3.6 s−1 (n= 8), consistent with the corrected rate of the inward APACC in Fig. 3A. Therefore, most of the Ca2+ flux across the t-system would occur when Vm is close to the resting level.
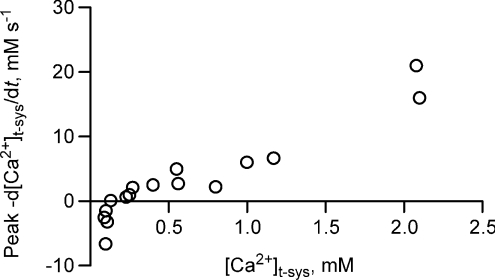
The peak tubular Ca2+ flux initiated by stimulation, peak −d[Ca2+]t-sys/dt, is summarized in Fig. 4 as a function of initial [Ca2+]t-sys. Above 0.2 mm[Ca2+]t-sys, flux was inward (indicating net loss from the t-system) and clearly depended on the Ca2+ gradient in a roughly linear fashion. Below ∼0.15 mm[Ca2+]t-sys, peak flux was outward (from cytosol to t-system) although the flux always reversed following repolarization of the t-system.
Figure 4. Peak flux of Ca2+ across the t-system following an action potential.
The peak Ca2+ flux at [Ca2+]t-sys is shown. Result is from 10 fibres.
From Fig. 4 one can see that there is a change in the direction of Ca2+ flux across the t-system and therefore, a change in the direction of the driving force for Ca2+, the electrochemical potential difference VCa, when [Ca2+]t-sys is about 0.15 mm (the peak becomes outwardly directed, an efflux). Let Vm represent the membrane potential, ECa the equilibrium potential for Ca2+ and [Ca2+]cleft the [Ca2+] on the cytoplasmic side of the t-system wall; then it is possible to calculate VCa as:
VCa=Vm−ECa=Vm− (RT/2F)
× ln([Ca2+]t-sys/[Ca2+]cleft)
Hence it is possible to estimate the [Ca2+] peak in the cleft during excitation as greater than the value that annuls VCa. Thus, if the Ca2+ entry pathway was activated and if the inversion occurred at the peak of the action potential or slightly thereafter, when Vm∼+10 mV to −10 mV, [Ca2+]cleft at that time would be [Ca2+]t-sys exp(–2FVm/RT) = 68 μm (at +10 mV) to 330 μm (at −10 mV). During the time that the flux is outward, the concentration in the cleft should be greater than 68 μm.
Conversely, one can place an upper limit on how late this Ca2+ pathway can be activated following an action potential by considering that [Ca2+]cleft following excitation cannot be greater than the [Ca2+] in the SR, which is around 1 mm (Fryer & Stephenson, 1996). Thus, assuming 1 mm as the highest possible [Ca2+]cleft and [Ca2+]t-sys= 0.15 mm, reversal of direction of flux across the t-system membrane would occur at Vm values more positive than −24 mV. This condition would be satisfied only for about 3 ms after an action potential is initiated in the t-system (Woods et al. 2004, DiFranco et al. 2005). This clearly shows that the action potential-induced Ca2+ flux (APACC) is activated very rapidly during an action potential, suggesting that it is mediated by voltage-activated channels.
We have also attempted to block the APACC with pharmacological agents. The non-specific cation channel blocker 2-APB (100 μm), which is commonly used to block transient receptor potential (TRP) channels caused rapid reduction of action potential-induced Ca2+ release which was abolished within 2–3 pulses (1–2 min) in three preparations tested (not shown). The current continued to be seen when the responses declined, but given the short time in the presence of 2-APB, it was difficult to assess whether 2-APB had time to equilibrate and bind to t-system membrane proteins, as we have previously reported that 2-APB also binds with some delay to the ryanodine receptor RyR1 (Launikonis & Ríos, 2007). Another non-specific cation channel blocker, the drug SKF-96356 (25 μm), which is also used to block TRP channels, caused an immediate block (within seconds) of action potential-induced Ca2+ release in the three fibres examined and no APACC current could be observed. Since the drug was shown not to affect the action potentials in cardiac cells (Ju et al. 2007), the most likely explanation of our result is that SKF-96356 blocks the APACC without affecting the action potentials. In such a case, the complete and rapid abolition of APACC in the presence of SKF-96356 may suggest that the APACC occurs via TRP channels, although one should bear in mind that SKF-96356 is known to have pleiotropic cellular effects (Leung & Kwan, 1999). Note that the TRP channels that are voltage insensitive (TRPC1/TRPC4, Vandebrouck et al. 2002) are excluded as potential candidates. Also excluded as potential candidates are voltage-sensitive TRP channels that activate on a much slower time scale than APACC (e.g. TRPP3 Shimizu et al. 2009 and TRPC5: Obukhov & Nowycky, 2008).
Permeability of the APACC
Under the simplifying constant field assumptions, the flux would be governed by the following flux equation (Hodgkin & Katz, 1949):
where PCa is the permeability for Ca2+ and υ= 2FVm/RT, assuming that Vm at rest is close to −90 mV, υ=−7.1 and the expression becomes:
Further considering that under all our conditions 0.00083[Ca2+]cleft < 0.01[Ca2+]t-sys, it follows that for all practical purposes the net Ca2+ flux across the t-system membrane into the cytoplasmic environment is directly proportional to [Ca2+]t-sys, thus explaining the overall linear dependence of the Ca2+ entry in Fig. 4 on [Ca2+]t-sys.
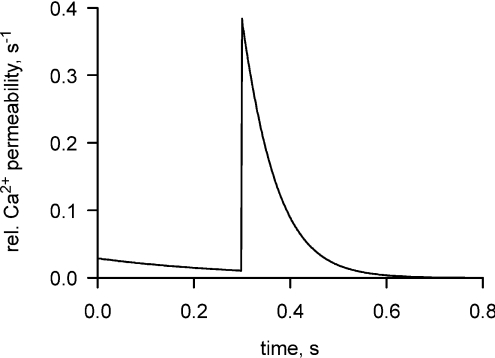
By dividing now the time course of the Ca2+ flux in Fig. 2Ad by 7[Ca2+]t-sys we derive the time course of PCa which should give an indication of the time course of the channel opening. This relationship is shown in Fig. 5.
Figure 5. Time course of the permeability to Ca2+ across the t-system following an action potential.
This relationship has been determined from the flux in Fig. 2Ad, as described in the text.
Regulation of the APACC
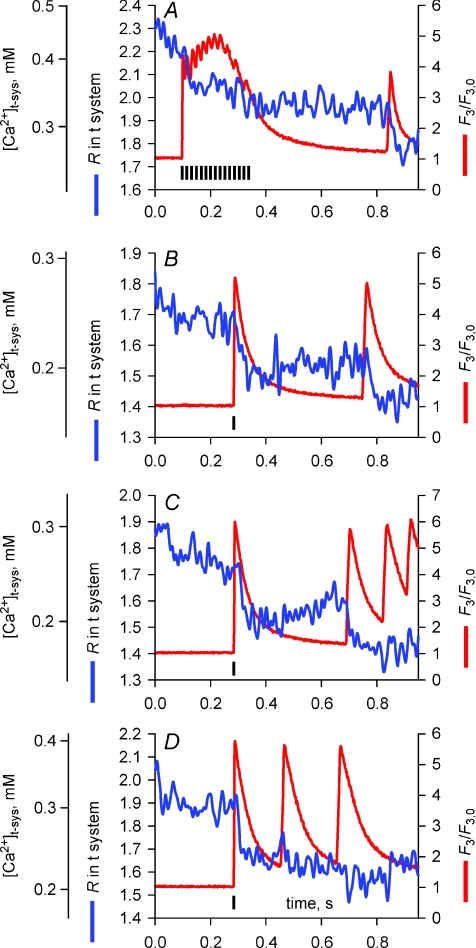
If the decrease in t-system flux is deactivation, then a second action potential would be expected to increase the flux to the initial peak, but if it is inactivation, then there would be little or no increase. Figure 6A–D shows examples of multiple action potential-activated releases of Ca2+ from the SR and the simultaneous movement of [Ca2+]t-sys from measurements of F3 fluorescence and R, respectively. Typical responses, elicited by a train of action potentials at 10 Hz, are shown in Fig. 6A. Towards the end of the trace a spontaneous action potential was generated in the t-system, some 0.4 s after the field stimulation-elicited action potentials (note that two fibres of the sixteen imaged in this study showed such Ca2+ release in response to spontaneous action potentials). The changes in R indicate a single Ca2+ influx event from the t-system into the cytoplasmic environment at the start of the electrical stimulation and a second event of similar magnitude associated with the spontaneous response. Changes in R shown in Fig. 6B and C suggest that action potentials must be spaced at least a few hundred milliseconds apart to induce an inward Ca2+ current. When action potentials were elicited at higher rates (last three responses in C and D), R decreased markedly only following the first action potential. Note that in B–D, the first response was elicited by field stimulation while the subsequent responses were due to spontaneous action potentials (field pulses indicated by vertical black bars in Fig. 6). The presence of a t-system Ca2+ current during either spontaneous or field pulse-elicited action potentials indicates that the field pulse itself cannot be the cause of any change in R.
Figure 6. The action potential-activated Ca2+ current during different stimulation protocols.
A–D, examples of R and F3 fluorescence during multiple field-stimulated (indicated by black vertical bars) or spontaneous action potentials.
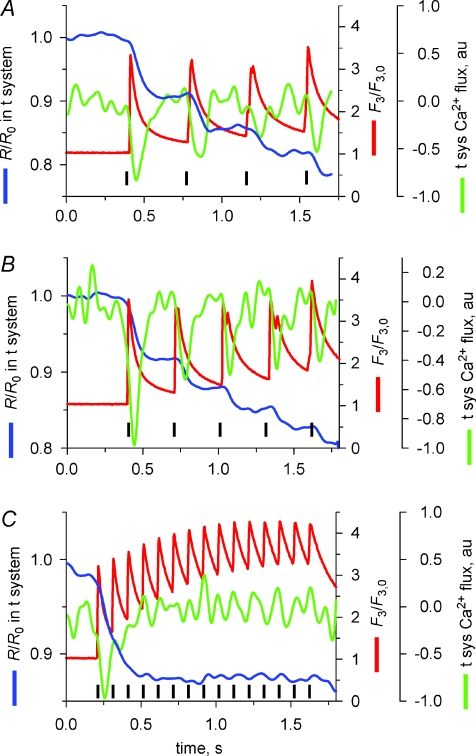
It is possible that the inhibition of APACC at higher stimulation frequencies could be due to the maintained higher [Ca2+]cyto and not stimulation frequency. To test this hypothesis skinned fibres were stimulated by trains of action potentials at different rates for longer than 1 s. Figure 7 plots R and rhod-2 fluorescence from fibres that were field stimulated at 2.5 (A), 3 (B) and 10 Hz (C). Each panel is the average of experiments from 3–5 fibres (shifted in time for coincidence of the first peak of F3). R was normalized to the initial R (R0) and corrected for passive leak in each experiment. Minor deviations in stimulation frequency resulted in a small misalignment of some of the peaks of the Ca2+ transients, as apparent in the averages shown in A and B. When the frequency of stimulation was 2.5 or 3 Hz, a drop in R/R0 (an inward t-system flux) was associated with each twitch (Fig. 7A and B). A greater drop in R/R0 was observed following the first two to three action potentials in the 10 Hz train (C), indicating a build-up of the effect.
Figure 7. Regulation of the action potential-activated Ca2+ current by [Ca2+]cleft.
Average R and F3 fluorescence from experiments in 3–5 fibres where preparations were field stimulated (indicated by black vertical bars) at 2.5 (A), 3 (B) and 10 Hz (C). au, arbitrary units.
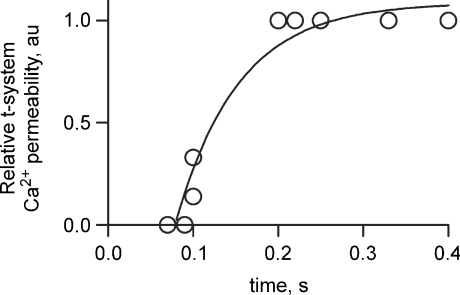
To assess this effect further, the relative t-system Ca2+ flux is also plotted in Fig. 7 (green lines). The relationship between relative Ca2+ permeability and the time between the first and second action potentials are plotted in Fig. 8. These data are derived from Figs 6 and 7. Specifically the relative t-system Ca2+ permeability following the second action potential in a stimulation sequence has been divided by the relative t-system Ca2+ permeability following the first action potential and plotted as a function of the time between these action potentials. This analysis clearly shows that the spacing between action potentials affects the relative t-system Ca2+ permeability. Only when the stimulation rate is close to 10 Hz is there a marked decline in Ca2+ permeability. This indicates that the current inactivates rather than deactivates after a single action potential. The continued inhibition of APACC during subsequent action potentials suggests [Ca2+]cyto is keeping the channel in an inactivated state.
Figure 8. Recovery of APACC from inactivation.
From the results in Figs 6 and 7 the relationship between the time between the first and second AP and the relative t-system Ca2+ permeability has been plotted. An exponential curve fitted the data (r2= 0.95, with a rate constant of 13.5 ± 4.5 s−1).
Is APACC inactivated by Ca2+ flowing from the t-system?
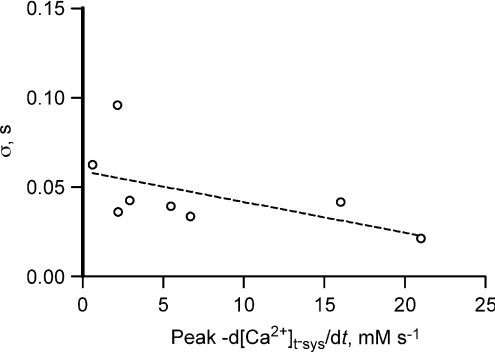
Is the total amount of Ca2+ passing through the t-system membrane responsible for inhibiting the channel? In such a case the rate constant of decay of the Ca2+ flux would be expected to be greater when the peaks of the Ca2+ flux are larger. However, as shown in Fig. 9 this does not appear to be the case (P= 0.16). Therefore the bulk [Ca2+]cleft, mostly provided by the SR, must be responsible for inactivation of this flux.
Figure 9. Peak Ca2+ flux vs. time constant of flux decay.
Linear regression through these points is not significant from 0 (null hypothesis accepted, P= 0.1556).
Discussion
We show, for the first time, that a Ca2+ flux is activated across the t-system of adult mammalian skeletal muscle fibres following a single action potential. A fluorescence method applied in skinned fibres allowed simultaneous imaging of [Ca2+]cyto and [Ca2+]t-sys. SEER imaging (Launikonis et al. 2005) of [Ca2+]t-sys conferred a high sensitivity for observing Ca2+ movements across the t-system during excitation and allowed quantification of the t-system flux with millisecond resolution. The flux was found to activate rapidly upon depolarization (∼ms) and decay more slowly. The decay was identified as an inactivation, because repeated pulses caused only marginal summation of the flux (Figs 6–8). The properties of this inactivation are consistent with a mechanism mediated by elevated [Ca2+] in the triadic cleft between tubule and terminal cisternae. One consequence of the inactivation is to limit continuous influx of Ca2+ during trains of action potentials.
Given fibre diameters of between 40 and 80 μm, peak −d[Ca2+]t-sys/dt of between 2.5 and 20 mm s−1 for most of the tubular Ca2+ concentrations (Fig. 4), and assuming a fractional t-system volume of 0.014, the APACC flux translates to a peak Ca2+ current of between 8.5 × 10⁻⁸ and 2.0 × 10⁻⁶ A (cm fibre length)−1 when related to the whole fibre volume. Thus, in a silicone-clamp arrangement, as used by Allard et al. (2006), with a clamped fibre length of ∼200 μm, the expected peak current would be roughly between 2 and 40 nA, depending on the tubular Ca2+ concentration. At these intensities, the APACC should be detectable with electrophysiological techniques. However, no action potential-activated Ca2+ current was previously reported using electrophysiological techniques.
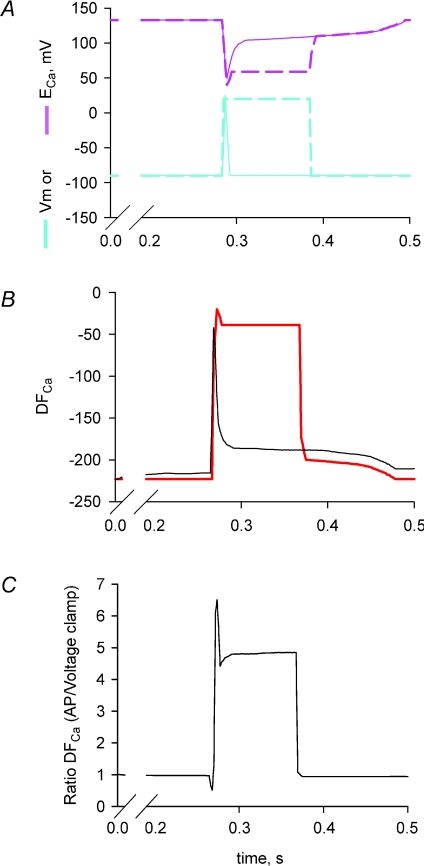
The apparent discrepancy between our observations and previous electrophysiological measurements may also be explained by differences associated with measurements of Ca2+ currents in response to square voltage pulses under voltage-clamp conditions instead of physiological voltage changes associated with an action potential. For example, during a long depolarizing pulse from −80 mV to +20 mV with the voltage-clamp method, the driving force, DFCa for the Ca2+ current initiated by the rapid depolarization will be reduced by more than 5-fold compared to that occurring following the rapid repolarization of an action potential (Fig. 10). The reduced DFCa would markedly decrease the Ca2+ influx under voltage-clamp conditions to a range that may be below the resolution of the macroscopic whole-cell current. It should be stressed that tubular Ca2+ currents are not accessible to cell-attached patch-clamp recordings that have a higher resolution due to larger feedback resistors in the headstage and, therefore, completely rely on whole-cell recordings.
Figure 10. Tubular driving force for Ca2+, DFCa, is significantly reduced during a voltage-clamp depolarization compared to physiological excitation.
A, Vm and ECa for action potentials (continuous lines) and voltage clamp (dashed lines), calculated as in Fig. 2. B, DFCa during action potential (black line) and voltage clamp (red line). C, ratio of DFCa during an action potential compared to voltage clamp. Note the ratio is close to 5 during stimulation.
It is also possible that APACC can only be revealed following normal excitation in the presence of physiologically occurring monovalent ions Na+ and K+, which are not usually present in the experiments with conventional electrophysiological techniques mentioned above where background currents have to be blocked by the use of Cs+, TEA+ or other organic compounds (Donaldson & Beam, 1983). The typical square pulses applied in voltage-clamp experiments produce a Ca2+ transient (or derived release flux) that differs significantly from that produced following physiological excitation. Action potentials produce a Ca2+ transient with a rapid rise to a peak that then decays exponentially. This is followed by a peak with every action potential subsequently propagating through the fibre. This Ca2+ transient is the same in intact and skinned preparations excited with action potentials (Figs 1, 2, 6 and 7; Baylor & Hollingworth, 1988, 2003; Westerblad & Allen, 1996; Woods et al. 2004; Launikonis et al. 2006), strongly suggesting the coupling mechanism is exactly the same in intact and skinned fibres. In contrast, voltage-clamped fibres during a square pulse produce a well-described Ca2+ transient with a high peak followed by a plateau phase that continues with the depolarizing pulse (e.g. Shirokova et al. 1996, 1998). Clearly, the waveform of membrane excitation affects Ca2+ release due to the different electrical fields across the DHPR. Thus, functional differences in voltage-sensitive proteins of the t-system are observed when challenged with physiological excitation or long, square pulses. This is a likely reason for APACC not activating under typical voltage-clamp conditions. There is also error in our in situ calibration of mag-indo-1 that may have led to an overestimate of the magnitude of APACC (Launikonis et al. 2005; Launikonis & Ríos, 2007).
Nevertheless, there is supporting evidence for APACC from electrophysiological recordings from intact muscle fibres under current-clamp conditions. For example, the slow depolarization following an action potential during current-clamp conditions of the intact mammalian muscle fibre shown on the pedestal in Fig. 4 of Pedersen et al. (2005) and looking like a passive voltage response to the long (25 ms) constant current pulse is consistent with the APACC in terms of magnitude and time course of its inactivation.
Possible sources for APACC
The inactivation of APACC at 10 Hz without noticeable effect on the Ca2+ transients (Figs 5 and 6) shows that the flux of Ca2+ cannot be passing through t-system channels that are involved in excitation of the membrane, ruling out Na+ and K+ channels as pathways of the observed current. Also as T-type channels progressively disappear during maturation within 3 weeks of birth (Beam & Knudson, 1988; Berthier et al. 2002), they are unlikely to present a source of Ca2+ entry in adult muscle. Furthermore, APACC is clearly activated by voltage, distinguishing it from voltage-independent store-operated Ca2+ entry (SOCE; Launikonis & Ríos, 2007).
We do not believe that the Na+–Ca2+ exchanger (NCX) makes a major contribution to the APACC flux under normal conditions because if this were the case, then the APACC flux would be expected to stop and even reverse direction within milliseconds after the t-system membrane repolarizes following an action potential, which was not the case (Fig. 2). Also, in a preceding paper we have shown that the maximal rate of Ca2+ uptake by the t-system during SR Ca2+ release is around 1 mm s−1 (relative to t-system volume; Launikonis & Ríos, 2007). This uptake must be conducted by the Ca2+ pump and NCX. During an action potential, when t-system Ca2+ was low (e.g. Fig. 2B), we observed Ca2+ uptake by the t-system at a rate that was about 5 times greater. This strongly suggests that NCX is not involved in passing this much greater, action potential-induced Ca2+ flux.
‘Excitation-coupled Ca2+ entry’ (ECCE) is described as a Ca2+ entry pathway in skeletal myotubes that requires retrograde signalling from the ryanodine receptor and continuous (trains of action potentials) or chronic depolarization (Cherednichenko et al. 2004). There is no experimental evidence that ECCE is activated by a single action potential, either in myotubes or in adult muscle, distinguishing it from APACC. Indeed it has been recently shown that the majority, if not all, of the ECCE current is carried by the L-type Ca2+ channel (Bannister et al. 2009). This is consistent with the requirement of ECCE for repetitive or chronic stimulation for activation.
A candidate channel for APACC would be the L-type Ca2+ channel. Its voltage–current relationship would suggest activation for most of the potential range covered by a single action potential. However, with its prolonged activation kinetics of more than 40–100 ms time-to-peak in adult fibres (Friedrich et al. 1999, 2004) and > 25 ms activation time constants in myotubes (Morrill et al. 1998), the L-type Ca2+ channel is not fully activated by the brief action potentials in muscle. Importantly, this does not necessarily rule out the DHPR as the protein that conducts APACC during an action potential per se because more Ca2+ is being carried into the cell upon channel deactivation during repolarization than during the brief depolarization during an action potential. This is mainly a consequence of the much larger DFCa present during repolarization than depolarization (Fig. 2; Johnson et al. 1997; Friedrich et al. 2004). However, the fact that APACC needed about 0.2 s to recover from inactivation is inconsistent with the predominant involvement of L-type Ca2+ channels, as these require seconds to recover from inactivation in adult muscle (time constant between 1.1 s and 16 s depending on recovery voltage; Morrill et al. 1998, Harasztosi et al. 1998) or adult muscle fibres (> 5 s for charge movement recovery from inactivation, Collet et al. 2003). It is noteworthy that L-type gating, deactivation and tail current kinetics can be strongly modulated by auxiliary subunits (Andronache et al. 2007) and cAMP-dependent kinases (Johnson et al. 1997, 2005).
A fast current that passed through the L-type Ca2+ channel has been recorded following conditioning pulses only (Feldmeyer et al. 1990). This current failed to inactivate under voltage-clamp depolarization, which constitutes a major kinetic difference from the APACC described here. In the present study APACC was readily observed without a conditioning depolarization.
The description of the properties of the L-type Ca2+ channel above and the observation of the inactivation of APACC after a few action potentials at 10 Hz (Figs 4 and 5) are indeed inconsistent with any involvement of the L-type Ca2+ channel in conducting APACC. Therefore we can infer that APACC is conducted by a t-system protein other than the L-type Ca2+ channel. This protein must be present in the junctional membranes of the muscle fibre.
Physiological relevance
The contribution of APACC to the cytosolic Ca2+ transient associated with one action potential is small, but not negligibly small. Assuming a [Ca2+]t-sys of 1.5 mm, the total APACC would contribute approximately 7 μm Ca2+ to the cytosol which corresponds to about 3% of the total Ca released from the SR (Posterino & Lamb, 2003). Directing this Ca2+ flux to the junctional region between the t-system and the SR, where the ryanodine receptors (RyRs) are located, we can speculate that the inhibitory effect exerted by Mg2+ ions on the activation sites on the RyRs would be reduced (Laver et al. 2004) and this would help prime the RyRs to open maximally more rapidly when the DHPRs are activated by the wave of depolarization associated with the action potential. Note that such a situation would only occur for the first action potential in a train of action potentials, because [Ca2+] in the junctional area will remain elevated following one action potential for the entire duration of the train of action potentials, and therefore additional action potential-activated Ca2+ fluxes would not be necessary. This provides a direct explanation as to why APACC should remain inactivated for the duration of trains of action potentials at frequencies above 10 Hz. If this inactivation mechanism becomes dysfunctional, then APACC may contribute to Ca2+ overload particularly in muscle disease states with disrupted Ca2+ homeostasis, like Duchenne muscular dystrophy.
Importantly, the APACC described in this paper may explain previous observations on twitch and tetanic responses in low Ca2+ bathing solutions when the Ca2+ flux is directed from the cytosol to the t-system lumen and [Mg2+] is high to maintain activatability of the voltage sensor (Melzer et al. 1995). Under such conditions, Ca2+ deprivation does not affect the membrane potential or the action potential and the magnitude of the single twitch response was markedly depressed, while the magnitude of the tetanic response was only slightly reduced (Lüttgau & Spiecker, 1979). Moreover, we show here that at [Ca2+]t-sys below 0.1 mm, an action potential causes a rapid and brief outward flux of Ca2+ to the t-system (Figs 2 and 3). This reversal of APACC at low [Ca2+]t-sys may act as a compensatory mechanism against Ca2+ loss from the t-system to ensure normal function of the voltage sensors.
The net influx of Ca2+ during an action potential also provides a mechanism to explain the increased uptake of 45Ca2+ during excitation, as shown in frog, rat and human skeletal muscle (Bianchi & Shanes, 1959; Curtis, 1966; Gissel & Clausen, 1999). It is particularly important to point out that the results published by Gissel & Clausen, 1999; Figs 2 and 4) indicate that the amount of Ca2+ entry per action potential in soleus muscle of the rat appears to decrease by factors of about 2, 3 and 4, as the frequency of stimulation increased from 0.5 Hz to 5, 10 and 20 Hz, respectively. This fully supports our observation that the APACC inactivates at higher rates of stimulation.
The Ca2+ entry from the t-system into the muscle fibre associated with APACC could also be used as a feedback mechanism to measure the level of muscle activity in fast-twitch muscles which are activated by short trains of action potentials eliciting tetani, with short periods of rest in between. With each APACC, the concentration of Ca2+ in the t-system decreases by some 0.25–0.5 mm (Fig. 4) and there is now growing evidence about the presence of molecules that can act as extracellular receptors triggering signals about changes in the extracellular [Ca2+] (Hofer, 2005) which can be used in various ways in the body.
With Ca2+ entering the skeletal muscle cell via APACC, what would be the role of SOCE that has been identified in muscle (Kurebayashi & Ogawa, 2001; Launikonis & Ríos, 2007) and how would these Ca2+ entry mechanisms work together to maintain normal [Ca2+]SR? It is clear that there is a threshold [Ca2+]SR for SOCE activation in muscle (Launikonis & Ríos, 2007). Therefore, SOCE would become activated only if the [Ca2+]SR was depleted below this level. However, in cases where [Ca2+]SR does indeed fall to critically low levels, SOCE activation mobilizes a continuous Ca2+ inflow until [Ca2+]SR has returned to a normal level (Launikonis & Ríos, 2007). Importantly SOCE is voltage independent, ensuring continuous Ca2+ inflow, as required regardless of the active state of the muscle. Thus the APACC complements SOCE to prevent severe [Ca2+]SR depletion. A similar argument has been made for the complementary function of SOCE and ECCE in myotubes (Lyfenko & Dirksen, 2008).
In summary, we show for the first time that a Ca2+ flux is activated in the t-system of adult mammalian skeletal muscle by a single action potential. This flux appears to help with priming the RyRs to open maximally and more rapidly when the DHPRs are activated by an action potential. This flux is also inactivated by the increase in [Ca2+] on the cytoplasmic side of the tubular wall during repetitive stimulation, preventing potential Ca2+ overload. The flux described here provides an explanation for the observations of low frequency, excitation-induced uptake of Ca2+ in skeletal muscle (Bianchi & Shanes, 1959; Curtis, 1966; Gissel & Clausen, 1999) and potentially for changes in the action potential-induced force responses under conditions of Ca2+ deprivation (Lüttgau & Spiecker, 1979).
Acknowledgments
We thank Eduardo Ríos (Rush University Medical Center, Chicago) for comments on the manuscript. B.S.L. was a C. J. Martin Fellow of the National Health and Medical Research Council (NHMRC; Australia) and O.F. was an International Linkage Fellow of the Australian Research Council (ARC). This work was supported by an ARC Discovery Grant to B.S.L., and a NHMRC Project Grant to B.S.L. and D.G.S.
Author contributions
All experiments were designed and performed at Rush University Medical Center, Chicago, by B.S.L. Data were analysed and interpreted by B.S.L., D.G.S. and O.F. The paper was written by B.S.L.
Supplemental material
References
- Allard B, Couchoux H, Pouvreau S, Jacquemond V. Sarcoplasmic reticulum Ca2+ release and depletion fail to affect sarcolemmal ion channel activity in mouse skeletal muscle. J Physiol. 2006;575:68–81. doi: 10.1113/jphysiol.2006.112367. [DOI] [PMC free article] [PubMed] [Google Scholar]
- Andronache Z, Ursu D, Lehnert S, Freichel M, Flockeriz V, Melzer W. The auxiliary subunit γ1 of the skeletal muscle L-type Ca2+ channel is an endogenous Ca2+ antagonist. Proc Natl Acad Sci U S A. 2007;104:17885–17890. doi: 10.1073/pnas.0704340104. [DOI] [PMC free article] [PubMed] [Google Scholar]
- Bakker AJ, Head SI, Stephenson DG. Time course of calcium transients derived from Fura-2 fluorescence measurements in single fast twitch fibres of adult mice and rat myotubes developing in primary culture. Cell Calcium. 1997;21:359–364. doi: 10.1016/s0143-4160(97)90029-4. [DOI] [PubMed] [Google Scholar]
- Bannister RA, Pessah IN, Beam KG. The skeletal L-type Ca2+ current is a major contributor to excitation-coupled Ca2+ entry. J Gen Physiol. 2009;133:79–91. doi: 10.1085/jgp.200810105. [DOI] [PMC free article] [PubMed] [Google Scholar]
- Baylor S, Hollingworth S. Fura-2 calcium transients in frog skeletal muscle fibres. J Physiol. 1988;403:151–192. doi: 10.1113/jphysiol.1988.sp017244. [DOI] [PMC free article] [PubMed] [Google Scholar]
- Baylor S, Hollingworth S. Sarcoplasmic reticulum calcium release compared in slow-twitch and fast-twitch fibres of mouse muscle. J Physiol. 2003;551:125–138. doi: 10.1113/jphysiol.2003.041608. [DOI] [PMC free article] [PubMed] [Google Scholar]
- Beam KG, Knudson CM. Effect of postnatal development on calcium currents and slow charge movement in mammalian skeletal muscle. J Gen Physiol. 1988;91:799–815. doi: 10.1085/jgp.91.6.799. [DOI] [PMC free article] [PubMed] [Google Scholar]
- Berchtold MW, Brinkmeier H, Müntener M. Calcium ion in skeletal muscle: its crucial role for muscle function, plasticity, and disease. Physiol Rev. 2000;80:1215–1265. doi: 10.1152/physrev.2000.80.3.1215. [DOI] [PubMed] [Google Scholar]
- Berthier CA, Monteil A, Lory P, Strube C. α1H mRNA in single skeletal muscle fibres accounts for T-type calcium current transient expression during fetal development in mice. J Physiol. 2002;539:681–691. doi: 10.1113/jphysiol.2001.013246. [DOI] [PMC free article] [PubMed] [Google Scholar]
- Bianchi CP, Shanes AM. Calcium influx in skeletal muscle at rest, during activity, and during potassium contracture. J Gen Physiol. 1959;42:803–815. doi: 10.1085/jgp.42.4.803. [DOI] [PMC free article] [PubMed] [Google Scholar]
- Cairns SP, Buller SJ, Loiselle DS, Renaud JM. Changes of action potentials and force at lowered [Na+]o in mouse skeletal muscle: implications for fatigue. Am J Physiol Cell Physiol. 2003;285:C1131–C1141. doi: 10.1152/ajpcell.00401.2002. [DOI] [PubMed] [Google Scholar]
- Cherednichenko G, Hurne AM, Fessenden JD, Lee EH, Allen PD, Beam KG, Pessah IN. Conformational activation of Ca2+ entry by depolarization of skeletal myotubes. Proc Natl Acad Sci U S A. 2004;101:15793–15798. doi: 10.1073/pnas.0403485101. [DOI] [PMC free article] [PubMed] [Google Scholar]
- Cheung A, Dantzig JA, Hollingworth S, Baylor SM, Goldman YE, Mitchison TJ, Straight AF. A small-molecule inhibitor of skeletal muscle myosin II. Nat Cell Biol. 2002;4:83–88. doi: 10.1038/ncb734. [DOI] [PubMed] [Google Scholar]
- Claflin DR, Morgan DL, Stephenson DG, Julian FJ. The intracellular Ca2+ transient and tension in frog skeletal muscle fibres measured with high temporal resolution. J Physiol. 1994;475:319–325. doi: 10.1113/jphysiol.1994.sp020072. [DOI] [PMC free article] [PubMed] [Google Scholar]
- Collet C, Csernoch L, Jacquemond V. Intramembrane charge movement and L-type calcium current in skeletal muscle fibers isolated from control and mdx mice. Biophys J. 2003;84:251–265. doi: 10.1016/S0006-3495(03)74846-2. [DOI] [PMC free article] [PubMed] [Google Scholar]
- Curtis BA. Ca fluxes in single twitch muscle fibers. J Gen Physiol. 1966;50:255–267. doi: 10.1085/jgp.50.2.255. [DOI] [PMC free article] [PubMed] [Google Scholar]
- Delbono O, Stefani E. Calcium transients in single mammalian skeletal muscle fibres. J Physiol. 1993;463:689–707. doi: 10.1113/jphysiol.1993.sp019617. [DOI] [PMC free article] [PubMed] [Google Scholar]
- DiFranco M, Capote J, Vergara JL. Optical imaging and functional characterization of the transverse tubular system of mammalian muscle fibers using the potentiometric indicator di-8-ANEPPS. J Membr Biol. 2005;208:141–153. doi: 10.1007/s00232-005-0825-9. [DOI] [PubMed] [Google Scholar]
- Donaldson PL, Beam KG. Calcium currents in fast-twitch skeletal muscle of the rat. J Gen Physiol. 1983;82:449–468. doi: 10.1085/jgp.82.4.449. [DOI] [PMC free article] [PubMed] [Google Scholar]
- Dutka TL, Murphy RM, Stephenson DG, Lamb GD. Chloride conductance in the transverse tubular system of rat skeletal muscle fibres: importance in excitation–contraction coupling and fatigue. J Physiol. 2008;586:875–887. doi: 10.1113/jphysiol.2007.144667. [DOI] [PMC free article] [PubMed] [Google Scholar]
- Feldmeyer D, Melzer W, Pohl B, Zöllner P. Fast gating kinetics of the slow Ca2+ current in cut skeletal muscle fibres of the frog. J Physiol. 1990;425:347–367. doi: 10.1113/jphysiol.1990.sp018107. [DOI] [PMC free article] [PubMed] [Google Scholar]
- Friedrich O, Both M, Gillis JM, Chamberlain JS, Fink RHA. Mini-dystrophin restores L-type calcium currents in skeletal muscle of transgenic mdx mice. J Physiol. 2004;555:251–265. doi: 10.1113/jphysiol.2003.054213. [DOI] [PMC free article] [PubMed] [Google Scholar]
- Friedrich O, Ehmer T, Fink RHA. Calcium currents during contraction and shortening in enzymatically isolated murine skeletal muscle fibres. J Physiol. 1999;517:757–770. doi: 10.1111/j.1469-7793.1999.0757s.x. [DOI] [PMC free article] [PubMed] [Google Scholar]
- Fryer MW, Stephenson DG. Total and sarcoplasmic reticulum calcium contents of skinned fibres from rat skeletal muscle. J Physiol. 1996;493:357–370. doi: 10.1113/jphysiol.1996.sp021388. [DOI] [PMC free article] [PubMed] [Google Scholar]
- Gissel H, Clausen T. Excitation-induced Ca2+ uptake in rat skeletal muscle. Am J Physiol Regul Integr Comp Physiol. 1999;276:R331–R339. doi: 10.1152/ajpregu.1999.276.2.R331. [DOI] [PubMed] [Google Scholar]
- Gissel H, Clausen T. Excitation-induced Ca2+ influx in rat soleus and EDL muscle: mechanisms and effects on cellular integrity. Am J Physiol Regul Integr Comp Physiol. 2000;279:R917–R924. doi: 10.1152/ajpregu.2000.279.3.R917. [DOI] [PubMed] [Google Scholar]
- Harasztosi CS, Sipos I, Kovacs L, Melzer W. Kinetics of inactivation and restoration from inactivation of the L-type calcium current in human myotubes. J Physiol. 1998;516:129–138. doi: 10.1111/j.1469-7793.1999.129aa.x. [DOI] [PMC free article] [PubMed] [Google Scholar]
- Hodgkin AL, Katz B. The effect of sodium ions on the electrical activity of the giant axon of the squid. J Physiol. 1949;108:37–77. doi: 10.1113/jphysiol.1949.sp004310. [DOI] [PMC free article] [PubMed] [Google Scholar]
- Hofer AM. Another dimension to calcium signaling. J Cell Sci. 2005;118:855–862. doi: 10.1242/jcs.01705. [DOI] [PubMed] [Google Scholar]
- Jacquemond V. Indo-1 fluorescence signals elicited by membrane depolarization in enzymatically isolated mouse skeletal muscle fibers. Biophys J. 1997;73:920–928. doi: 10.1016/S0006-3495(97)78124-4. [DOI] [PMC free article] [PubMed] [Google Scholar]
- Johnson BD, Brousal JP, Peterson BZ, Gallombardo PA, Hockerman GH, Lai Y, Scheuer T, Catterall WA. Modulation of the cloned skeletal muscle L-type Ca2+ channel by anchored cAMP-dependent protein kinase. J Neurosci. 1997;17:1243–1255. doi: 10.1523/JNEUROSCI.17-04-01243.1997. [DOI] [PMC free article] [PubMed] [Google Scholar]
- Johnson BD, Scheuer T, Catterall WA. Convergent regulation of skeletal muscle Ca2+ channels by dystrophin, the actin cytoskeleton, and cAMP dependent protein kinase. Proc Natl Acad Sci U S A. 2005;102:4191–4196. doi: 10.1073/pnas.0409695102. [DOI] [PMC free article] [PubMed] [Google Scholar]
- Ju YK, Chu Y, Chaulet H, Lai D, Gervasio OL, Graham RM, Cannell MB, Allen DG. Store-operated Ca2+ influx and expression of TRPC genes in mouse sinoatrial node. Circ Res. 2007;100:1605–1614. doi: 10.1161/CIRCRESAHA.107.152181. [DOI] [PubMed] [Google Scholar]
- Kurebayashi N, Ogawa Y. Depletion of Ca2+ in the sarcoplasmic reticulum stimulates Ca2+ entry into mouse skeletal muscle fibres. J Physiol. 2001;533:185–199. doi: 10.1111/j.1469-7793.2001.0185b.x. [DOI] [PMC free article] [PubMed] [Google Scholar]
- Lamb GD, Junankar P, Stephenson DG. Raised intracellular [Ca2+] abolishes excitation–contraction coupling in skeletal muscle fibres of rat and toad. J Physiol. 1995;489:349–362. doi: 10.1113/jphysiol.1995.sp021056. [DOI] [PMC free article] [PubMed] [Google Scholar]
- Lamb GD, Stephenson DG. Effects of intracellular pH and [Mg2+] on excitation-contraction coupling in skeletal muscle fibres of the rat. J Physiol. 1994;478:331–339. doi: 10.1113/jphysiol.1994.sp020253. [DOI] [PMC free article] [PubMed] [Google Scholar]
- Launikonis BS, Barnes M, Stephenson DG. Identification of the coupling between skeletal muscle store-operated calcium entry and the inositol trisphosphate receptor. Proc Natl Acad Sci U S A. 2003;100:2941–2944. doi: 10.1073/pnas.0536227100. [DOI] [PMC free article] [PubMed] [Google Scholar]
- Launikonis BS, Ríos E. Store-operated Ca2+ entry during intracellular Ca2+ release in mammalian skeletal muscle. J Physiol. 2007;583:81–97. doi: 10.1113/jphysiol.2007.135046. [DOI] [PMC free article] [PubMed] [Google Scholar]
- Launikonis BS, Stephenson DG. Properties of the vertebrate tubular system as a sealed compartment. Cell Biol Int. 2002;26:921–929. doi: 10.1006/cbir.2002.0942. [DOI] [PubMed] [Google Scholar]
- Launikonis BS, Zhou J, Royer L, Shannon TR, Brum G, Ríos E. Confocal imaging of [Ca2+] in cellular organelles by SEER, shifted excitation and emission ratioing. J Physiol. 2005;567:523–543. doi: 10.1113/jphysiol.2005.087973. [DOI] [PMC free article] [PubMed] [Google Scholar]
- Launikonis BS, Zhou J, Royer L, Shannon TR, Brum G, Ríos E. Depletion “skraps” and dynamic buffering inside the cellular Ca2+ store. Proc Natl Acad Sci U S A. 2006;103:2982–2987. doi: 10.1073/pnas.0511252103. [DOI] [PMC free article] [PubMed] [Google Scholar]
- Laver DR, O’Neill ER, Lamb GD. Luminal Ca2+-regulated Mg2+ inhibition of skeletal RyRs reconstituted as isolated channels or coupled clusters. J Gen Physiol. 2004;124:741–758. doi: 10.1085/jgp.200409092. [DOI] [PMC free article] [PubMed] [Google Scholar]
- Leung YM, Kwan CY. Current perspectives in the pharmacological studies of store-operated Ca2+ entry blockers. Jpn J Pharmacol. 1999;81:253–258. doi: 10.1254/jjp.81.253. [DOI] [PubMed] [Google Scholar]
- Lüttgau HC, Spiecker W. The effects of calcium deprivation upon mechanical and electrophysiological parameters in skeletal muscle fibres of the frog. J Physiol. 1979;296:411–429. doi: 10.1113/jphysiol.1979.sp013013. [DOI] [PMC free article] [PubMed] [Google Scholar]
- Lyfenko AD, Dirksen RT. Differential dependence of store-operated and excitation-coupled Ca2+ entry in skeletal muscle on STIM1 and Orai1. J Physiol. 2008;586:4815–4824. doi: 10.1113/jphysiol.2008.160481. [DOI] [PMC free article] [PubMed] [Google Scholar]
- Macdonald WA, Pedersen TH, Clausen T, Neilsen OB. N-Benzyl-p-toluene sulphonamide allows the recording of trains of intracellular action potentials from nerve stimulated intact fast-twitch skeletal muscle of the rat. Exp Physiol. 2005;90:815–825. doi: 10.1113/expphysiol.2005.031435. [DOI] [PubMed] [Google Scholar]
- Melzer W, Herrman-Frank A, Luttgau HC. The role of Ca2+ ions in excitation-contraction coupling of skeletal muscle fibres. Biochim Biophys Acta. 1995;1241:59–116. doi: 10.1016/0304-4157(94)00014-5. [DOI] [PubMed] [Google Scholar]
- Morrill JA, Jr, Brown RH, Cannon SC. Gating of the L-type Ca channel in human skeletal myotubes: an activation defect caused by the hypokalemic periodic paralysis mutation R528H. J Neurosci. 1998;18:10320–10334. doi: 10.1523/JNEUROSCI.18-24-10320.1998. [DOI] [PMC free article] [PubMed] [Google Scholar]
- Nielsen OB, Ørtenblad N, Lamb GD, Stephenson DG. Excitability of the T-tubular system in rat skeletal muscle: roles of K+ and Na+ gradients and Na+-K+ pump activity. J Physiol. 2004;557:133–146. doi: 10.1113/jphysiol.2003.059014. [DOI] [PMC free article] [PubMed] [Google Scholar]
- Obukhov AG, Nowycky MC. TRPC5 channels undergo changes in gating properties during the activation-deactivation cycle. J Cell Physiol. 2008;216:162–171. doi: 10.1002/jcp.21388. [DOI] [PMC free article] [PubMed] [Google Scholar]
- Peachey LD. The role of transverse tubules in excitation contraction coupling in striated muscles. Ann N Y Acad Sci. 1966;137:1025–1037. doi: 10.1111/j.1749-6632.1966.tb50214.x. [DOI] [PubMed] [Google Scholar]
- Pedersen TH, de Paoli F, Nielsen OB. Increased excitability of acidified skeletal muscle: role of chloride conductance. J Gen Physiol. 2005;125:237–246. doi: 10.1085/jgp.200409173. [DOI] [PMC free article] [PubMed] [Google Scholar]
- Posterino GS, Lamb GD. Effect of sarcoplasmic reticulum Ca2+ content on action potential-induced Ca2+ release in rat skeletal muscle fibres. J Physiol. 2003;551:219–237. doi: 10.1113/jphysiol.2003.040022. [DOI] [PMC free article] [PubMed] [Google Scholar]
- Posterino GS, Lamb GD, Stephenson DG. Twitch and tetanic force responses and longitudinal propagation of action potentials in skinned skeletal muscle fibres of the rat. J Physiol. 2000;527:131–137. doi: 10.1111/j.1469-7793.2000.t01-2-00131.x. [DOI] [PMC free article] [PubMed] [Google Scholar]
- Royer L, Pouvreau S, Ríos E. Evolution and modulation of intracellular calcium release during long-lasting, depleting depolarization in mouse muscle. J Physiol. 2008;586:4609–4629. doi: 10.1113/jphysiol.2008.157990. [DOI] [PMC free article] [PubMed] [Google Scholar]
- Sachetto R, Margreth A, Pelosi M, Carofoli E. Colocalization of the dihydropyridine receptor, the plasma-membrane calcium ATPase isoform 1 and the sodium/calcium exchanger to the junctional-membrane domain of transverse tubules of rabbit skeletal muscle. Eur J Biochem. 1996;237:483–488. doi: 10.1111/j.1432-1033.1996.0483k.x. [DOI] [PubMed] [Google Scholar]
- Shimizu T, Janssens A, Voets T, Nilius B. Regulation of the murine TRPP3 channel by voltage, pH, and changes in cell volume. Pflügers Arch. 2009;457:795–807. doi: 10.1007/s00424-008-0558-6. [DOI] [PubMed] [Google Scholar]
- Shirokova N, García J, Pizarro G, Ríos E. Ca2+ release from the sarcoplasmic reticulum compared in amphibian and mammalian skeletal muscle. J Gen Physiol. 1996;107:1–18. doi: 10.1085/jgp.107.1.1. [DOI] [PMC free article] [PubMed] [Google Scholar]
- Shirokova N, García J, Ríos E. Local calcium release in mammalian skeletal muscle. J Physiol. 1998;512:377–384. doi: 10.1111/j.1469-7793.1998.377be.x. [DOI] [PMC free article] [PubMed] [Google Scholar]
- Vandebrouck C, Martin D, Colson-Van Schoor M, Debaix H, Gailly P. Involvement of TRPC in the abnormal calcium influx observed in dystrophic (mdx) mouse skeletal muscle fibers. J Cell Biol. 2002;158:1089–1096. doi: 10.1083/jcb.200203091. [DOI] [PMC free article] [PubMed] [Google Scholar]
- Westerblad H, Allen DG. Intracellular calibration of the calcium indicator indo-1 in isolated fibers of Xenopus muscle. Biophys J. 1996;71:908–917. doi: 10.1016/S0006-3495(96)79294-9. [DOI] [PMC free article] [PubMed] [Google Scholar]
- Woods CE, Novo D, DiFranco M, Vergara JL. The action potential-evoked sarcoplasmic reticulum calcium release is impaired in mdx mouse muscle fibres. J Physiol. 2004;557:59–75. doi: 10.1113/jphysiol.2004.061291. [DOI] [PMC free article] [PubMed] [Google Scholar]
- Zhou J, Yi J, Royer L, Launikonis BS, González A, García J, Ríos E. A probable role of dihydropyridine receptors in repression of Ca2+ sparks demonstrated in cultured mammalian muscle. Am J Physiol Cell Physiol. 2006;290:C539–C553. doi: 10.1152/ajpcell.00592.2004. [DOI] [PubMed] [Google Scholar]
Associated Data
This section collects any data citations, data availability statements, or supplementary materials included in this article.


